Well, you probably expected 3D view of some surface, you should wait a bit for that. This is graph of Z-axis and you can see the Van der vaals forces. Which is how this microscope works.
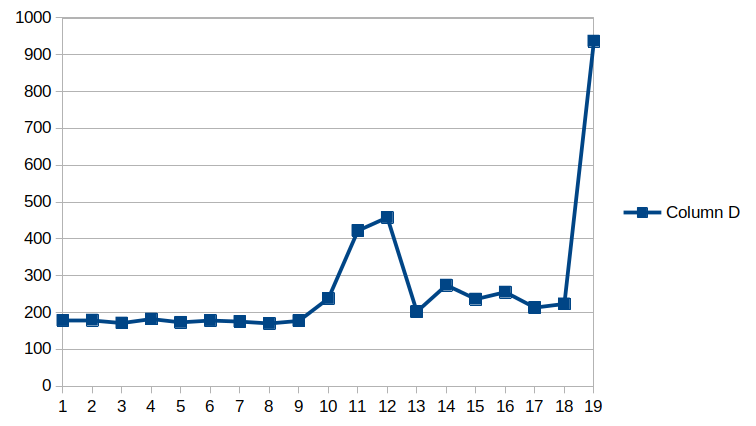
The X axis in this graph is 100 steps in Z axis of AFM microscope. The Y axis in this graph represent PLL mismatch. If my electronics would be perfect it should be 0, but there is noise. Once the sample gets near the surface it's frequency changes. Thus, changing PLL output from about 200 to 2000 mismatched samples.
I got three different graph (different resolution 50 and 100 stesps) and they all have this structure which is coharent with theoretical ones you can find in scientifical papers about AFM.
Discussions
Become a Hackaday.io Member
Create an account to leave a comment. Already have an account? Log In.