 WJCarpenter
These graphs show the power (in watts) and current (in amps) drawn by the washer (blue) and dryer (purple) that happened to be both running at roughly the same time. The bars at the top of the screenshot show the state of the door sensors for the machines. Click the image to get a larger view of it.
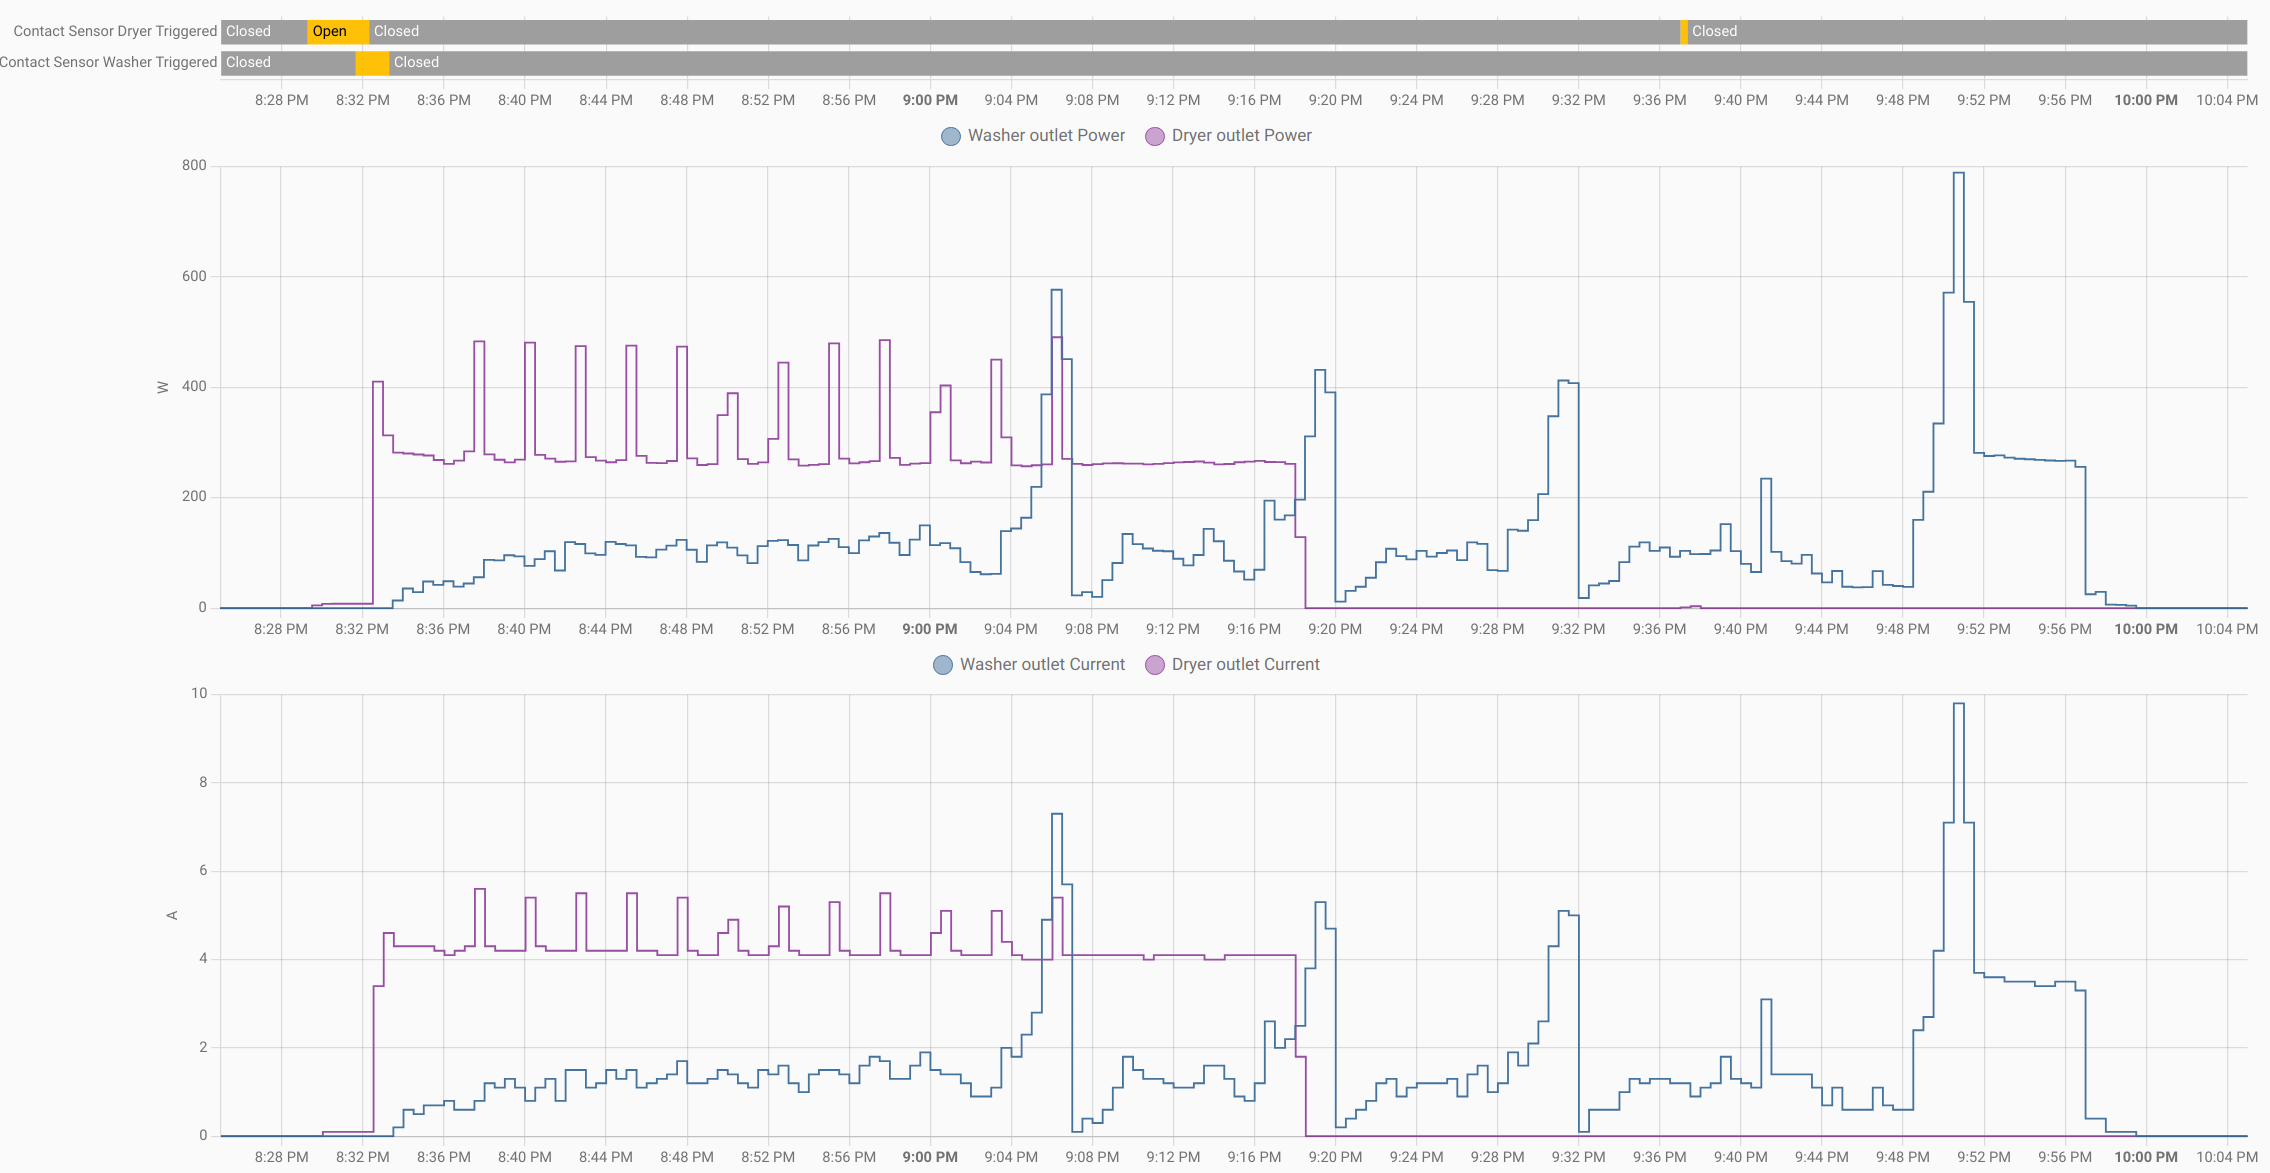
Observations....
- When the washer is off, it is completely off with zero energy consumption. That can't be literally true because it has to be able to sense the soft switch to be able to be turned on. It's zero within the precision of the smart socket measuring it.
- The same is true of the dryer, with one important extra factor. There is a light in the dryer that comes on when the door is open. If you look closely, you can see a small blip in the top graph for the dryer between 9:36 and 9:40. It's directly under the yellow "open" patch for the door sensor. I opened the door for a little while specifically to see what the energy consumption would be. It's 3.7 watts. The current graph does not show a similar draw. It stays at zero, which I think is probably due to a difference in the measuring sensors in the smart outlet.
- The very end of the cycle for the washer shows a small power draw (4-6 watts) that lasts about a minute. I don't know what the machine is thinking about during that time, but it always does it before it finally switches completely off.
- There are other low spots in the washer's cycle when it is switching between phases. The durations are all exactly 30 seconds, but that is probably the granularity of how often the smart socket is reporting things. The lowest of those dips is 11.9 watts for this particular cycle. There are other types of cycles that could be different in that respect.
- Since I want to use the power consumption to know when the machines start or stop running, I think I can reliably do that for the washer by saying "zero watts for at least some time period", which is an easy thing to do in Home Assistant triggers. For the dryer, I can't use zero watts because of the light. I will have to use a small value of perhaps 5 watts. But in both cases, I can reasonably assume that the machines are not running if their door is open. I'll have to tinker with this a little, but I'm pretty sure I will be able to work out triggers and conditions that can be the same for both machines. (Using the same triggers and conditions is not a hard requirement for me. It's just for simplicity.)
Discussions
Become a Hackaday.io Member
Create an account to leave a comment. Already have an account? Log In.