 Mark Henderson
Why eye2see ?
For decades professional embedded tools have included sophisticated debuggers, typically ones that provide debug data using information from the source code ("symbolic debuggers"). The Arduino universe has enabled millions of people to develop amazing embedded projects, but has never offered robust debugging capabilities (this is changing with some of the newer hardware and IDE versions). But since so many folks are happily using legacy, small, low cost and low performance Arduino-based platforms, we're left without good debug tools!
eye2see (a play on words ;-) ) was developed by me as a way to get debug info out of Arduino projects that were very limited, in terms of pins, memory and ports (like the ATTiny85). Many of my projects (most?) have an I2C bus connecting displays and sensors, or have a free I2C port. So, why not output debug information over those wires?? ZERO additional pins used if you're already using I2C!
Once I started sending debug info out the I2C port, I realized I could use C/C++ macros to get actual symbolic information at run-time (!), and format data for display on a PC. I used an Arduino as an I2C to serial-over-USB bridge, but soon added functionality to this "probe" (hardware and software). eye2see was now a light weight, sophisticated symbolic debugger (with a couple of small limitations).
I've used eye2see for a couple of years, and it's now indispensable for all my projects. It's far superior to using "Serial.print()" debugging, and it frees up the serial port for other duties! I typically add a Qwiic/StemmaQT connector to all my PCBs so connecting the eye2see probe is plug-and-play. Where eye2see is particularly helpful is debugging results of type conversions (different sized integers, signed/unsigned, overflows etc.) as it can display variable values in different bases and formats.
eye2see - Overview
Once you have the eye2see system set up (more on this below), using eye2see is extremely easy! Any time you want to see the value of a variable in your running program, all you need to do is insert a line to call eye2see, with the variable name in the function call:
e2clog(VariableName);
When you upload your program to the target and it starts running, and the line of code you inserted executes, you will see a display like this on the eye2see PC graphical user interface:

ey2see displays a timestamp (each time the variable is updated), the file name of the Arduino source file (aka Arduino IDE tab), the line number of the added line of code, the variable name and the variable value - which can be displayed in user-selectable signed decimal, unsigned decimal, hex or binary formats!
eye2see can also display text strings (like using Serial.print()):
e2cslog("Hello world");
Will display :

You can use eye2see to watch multiple variables, with the most-recently updated value being highlighted in red.
Break Points
In addition to watching variable values, eye2see can also stop execution on the target when a variable is updated ("Break Points"). A red dot indicates the execution has hit a "break", and a "Resume" button allows the target code to resume running:

Break points can be enabled and disabled from the eye2see GUI, and can also be set using the following function call in your code:
e2clogbrk(anint);
eye2see - Limitations
The main limitation of eye2see is that it slows down target execution (a lot). This is due to handshaking that occurs between the eye2see components (running on target, eye2see Probe and the PC).
For many debug cases this is not a big problem (for example, when developing user interfaces etc.). In some cases it doesn't impact programs that interact with the real world (for example, reading a sensor), but in some cases it will impact operation of the target (for example, motor control). In some cases it's possible to record variable values to global variables in time-critical code (example: interrupt service routine) and use eye2see to output the debug information in non-time-critical code (for example, this might be in Arduino "loop()" ).
As long as you're aware of this limitation, I'm sure you'll find that eye2see is an incredible time saver!
eye2see Components
eye2see - Arduino Code (on debug target)
The eye2see code needed to be included in your user code, on the debug target, consists of just one function, consisting of about 20 lines of functional code. This code can be pasted directly into your Arduino program, or another tab in the Arduino IDE.
There are just two #defines to configure the target eye2see code:
- EYE_2_SEE_I2C_ADDRESS - set this to the I2C slave address you'd like eye2see to use
- TINY_EYE2SEE - uncomment this to use the TinyI2C library instead of the standard Wire library
C/C++ macros in the included source code perform some of the "magic", allowing eye2see to access variable names, source code line numbers and source code file name.
Due to the small size of the target-resident eye2see code, and particularly when using the Technoblogy TinyI2C library, eye2see works on even tiny processors like the ATTiny85. Symbolic debugging with breakpoints on an 8 pin processor!
eye2see Probe (external device)
The eye2see probe is an Arduino-based device that acts as an external I2C slave, attached to your target I2C bus, that receives debug information from the eye2see Arduino code running on your target. This device then formats the debug information and sends it to a PC via serial-over-USB.
Any Arduino with I2C slave and serial-over-USB capabilities can be used as an eye2see device (for example, Raspberry Pi Pico, Arduino ProMicro etc.).
Since I wanted a general purpose eye2see device, I put together one using a Seeed Xiao RP2040 board (which uses a Raspberry Pi Pico CPU), small graphical LCD, Qwiic/StemmaQT connector, 0.1" I2C pin connectors and software configurable SDA and SCL pullup resistors.
It would be possible to use a basic I2C-USB bridge (chip- or processor-based) for the eye2see device, and perform all processing on the PC, however I chose to put some software functionality into the device, along with the hardware features mentioned above.
The eye2see Probe will soon be available for purchase on Tindie, or you can build your own from the included files.
eye2see Python User Interface (Windows 10/11 PC)
The last component of eye2see is a Python Graphical User Interface program that runs on your PC (only tested on Windows 10/11). This program receives debug data from the eye2see Probe and displays it in a GUI.
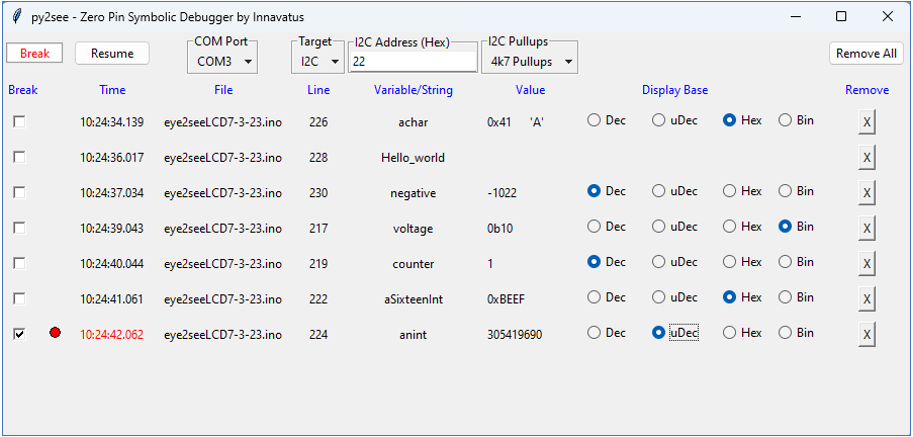
The GUI displays and controls several different things:
- PC Configuration
- COM Port - connects to the GUI to the COM post the eye2see Probe is attached to
- eye2see Status
- The top left text box displays eye2see status (PC COM status, Running, Break)
- eye2see Probe Configuration
- Target - the target type (currently only I2C is supported)
- I2C Address - the I2C slave address the eye2see Probe is to respond to
- I2C Pullups - enable or disable 4k7 ohm pullups on I2C SDA and SCL (depending on whether target has pullups, or not)
- Break/Resume
- Break Checkboxes - checking a box will cause eye2see to stop target execution the next time this line is updated. If unchecked, execution will not break on the next update.
- Resume - if the target is stopped (break), this button will restart target execution.
- Debug information
- Time stamp, filename, line number, variable name
- Value - the value of a variable can be displayed in different formats based on the radio buttons on the right of the screen. eye2see knows the size of the variable (8, 16, 32 bits) and displays appropriately:
- Dec - signed decimal
- uDec - unsigned decimal
- Hex - hexadecimal
- Bin - binary
- Display Control
- The "X" buttons in the "Remove" column allow debug lines that are no longer active to be removed from the display
- The "Remove All" button will remove all debug lines (until new debug information is received)