 kasik
kasikNeural Networks can be often viewed as a kind of black boxes - with a lot of computation happening behind the scenes. I thought it would be really interesting to be able to somehow visualize their work.
There are various ways to visualize what CNNs do. Personally, I find visualizing feature maps and regions that are most important for the network, particularly interesting.
Seeing the feature maps can show us the internal representation of the input the model has in a specific location - which features are found and focused on by the CNN.
It is very easy to see visualize them in python, we can simply take the first convolution layer and make a prediction with that subset of network. The result will give us the 8 feature maps :
# redefine model to output right after the first hidden layer
model = Model(inputs=probability_model.inputs, outputs=probability_model.layers[1].output)
model.summary()

# get feature map for first hidden layer
feature_maps = model.predict(test_image)
# plot all 8 maps in an 2x4 squares
r = 2
c = 4
ix = 1
for _ in range(r):
	for _ in range(c):
		# specify subplot and turn of axis
		ax = plt.subplot(r, c, ix)
		ax.set_xticks([])
		ax.set_yticks([])
		# plot filter channel in grayscale
		plt.imshow(feature_maps[0, :, :, ix-1], cmap='gray')
		ix += 1
# show the figure
plt.show()
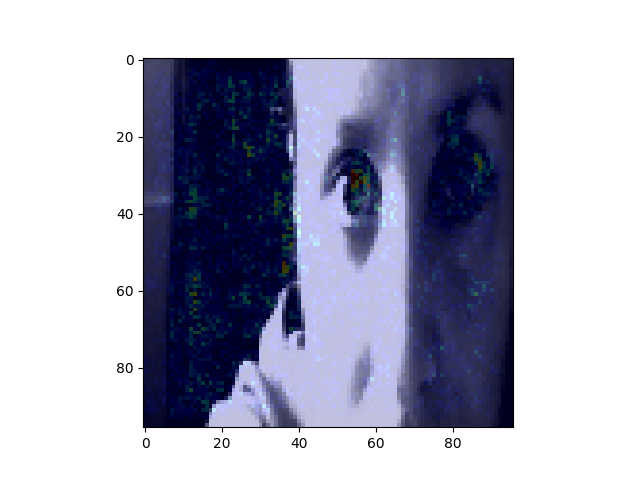
Another interesting way to show what is going on with our model is something called saliency map - with this technique we can see where our network focuses thus we can understand better the decision process.It is most common to visualize the saliency maps as the heatmap overlayed on the image of interest. There are various ways to compute the saliency map, there are even several gradient-based approaches - where the gradient of prediction with respect to input features is calculated. Symonian et al. were the first (in 2013) to propose a method that uses backpropagation to calculate the gradient of the loss function for the class we are interested in with respect to the input pixels. An example (I based mine on other available ) is in the script and here are some results:
Discussions
Become a Hackaday.io Member
Create an account to leave a comment. Already have an account? Log In.