Today a few notes on useful metrics. In one of the previous logs I mentioned looking at accuracy and loss, but of course the topic is more complex. Sometimes accuracy may even be misleading.
Let's imagine that we have a naive classifier - a classification algorithm with no logic or rather with minimum effort and data manipulation to prepare a forecast. We want to model anomaly detection, with 0 for no anomaly and 1 for anomaly detected. We can use for example a method called Uniformly Random Guess: that predicts 0 or 1 with equal probability. Or even better - an algorithm that always outputs 0. With a low anomaly rate, we can get the accuracy of our algorithm even 100% and have an impression that we did an excellent job.
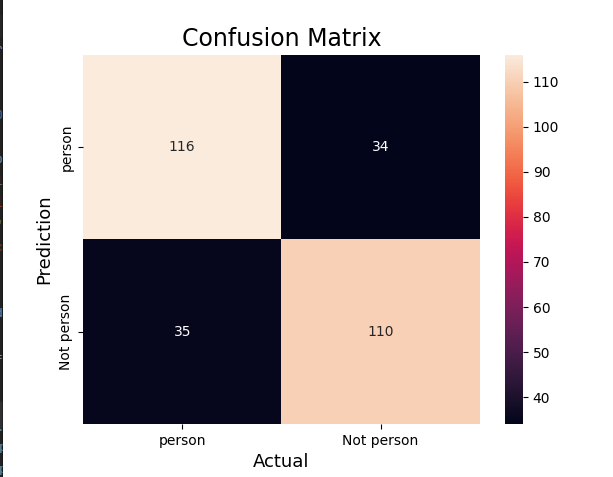
A nice tool to consider is a confusion matrix - a table where we have predicted labels and actual labels with scores for each, for example:
It is very easy to create and display the confusion matrix in python using sklearn.metrics:
    # Compute confusion matrix
    cm = confusion_matrix(y_val, y_pred)

    sns.heatmap(cm,
                annot=True,
                fmt='g',
                xticklabels=['Person', 'Not person'],
                yticklabels=['Person', 'Not person'])
    plt.ylabel('Prediction', fontsize=13)
    plt.xlabel('Actual', fontsize=13)
    plt.title('Confusion Matrix', fontsize=17)
    plt.show()
Useful terms related with confusion matrix:
True Positive (TP): Values that are actually positive and predicted positive.
False Positive (FP): Values that are actually negative but predicted positive.
False Negative (FN): Values that are actually positive but predicted negative.
True Negative (TN): Values that are actually negative and predicted negative.
With the use of the above, we can calculate the following:
Precision
Out of all the positive predicted, what percentage is truly positive.
Precision = True Positive/Predicted Positive
Recall
Out of the actual positive, what percentage are predicted properly.
Recall = True Positive/Actual Positive
It is very common to calculate F1 score, which is used to measure test accuracy. It is a weighted average of the precision and recall. When F1 score is 1 it’s best and on 0 it’s worst.
F1 = 2 * (precision * recall) / (precision + recall)
Note, that the above are calculated for the target class and not for the full system.
And as always, we need to have our particular problem in mind, in some cases the occurrences of False Negatives have more severe consequences then False Positives (for example cancer detection). Which means we may need to consider some weights in the calculation of metrics or maybe even choose different ones.
 kasik
kasik
Discussions
Become a Hackaday.io Member
Create an account to leave a comment. Already have an account? Log In.