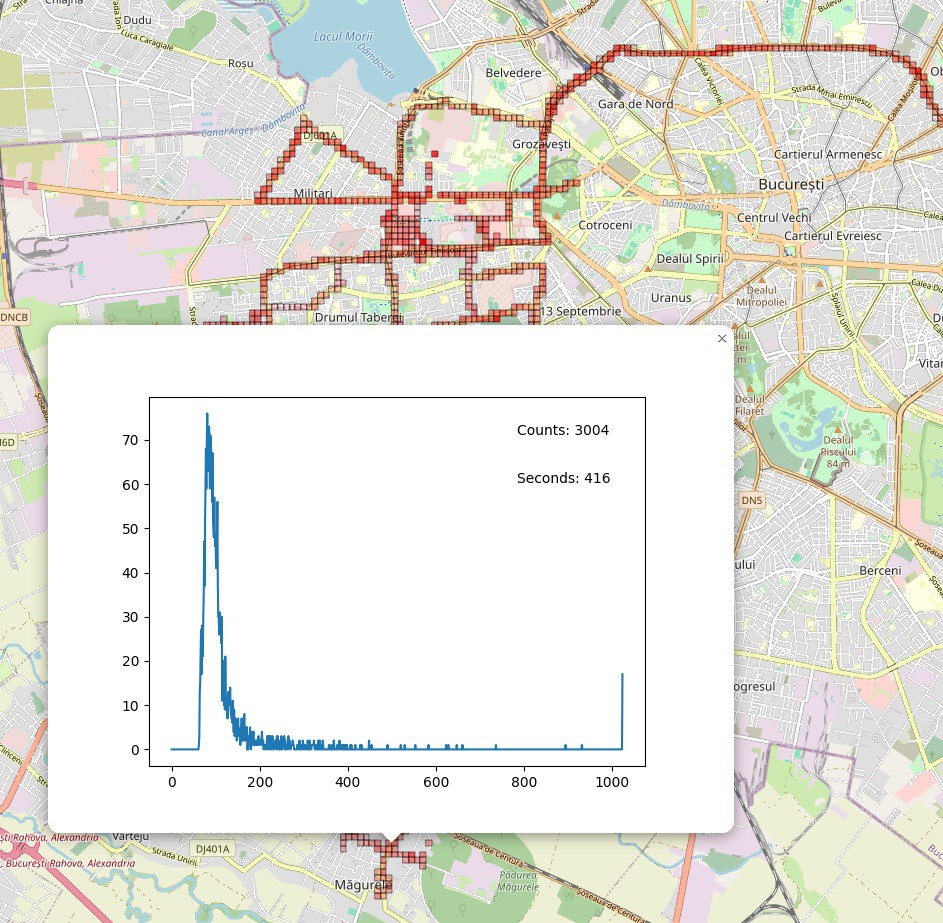
Check out the interactive version of the map here: http://pomelomap.s3-website.eu-central-1.amazonaws.com
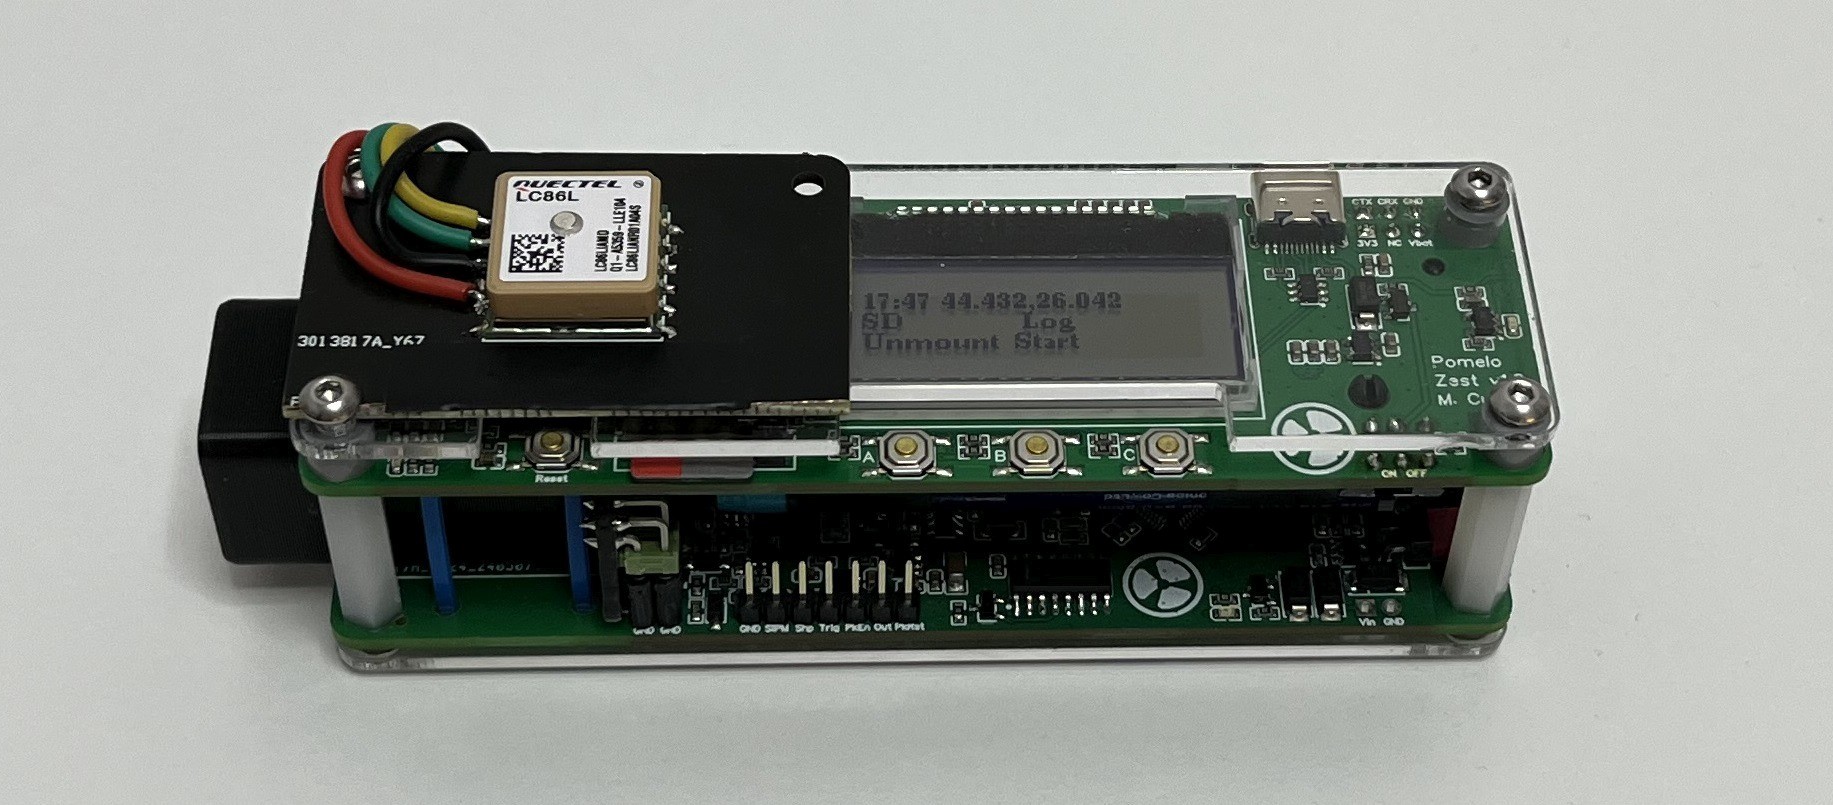
I strapped a GPS module to one of the Pomelo Zest prototypes and drove it around for the past week. It logs positioning and spectrum data to text files on an SD card and I then read all those text files in a python script to generate a map using Folium. Individual measurement points are grouped together in squares on the map and all the spectra from these measurements are added together to calculate an average dose rate at that point. You can click a square to see the associated spectrum.

GPS module jerry-rigged onto detector
 mihai.cuciuc
Discussions
Become a Hackaday.io Member
Create an account to leave a comment. Already have an account? Log In.