Being able to measure and record outdoor weather data is something that I have wanted to do for quite a while. A few years ago, I bought a commercial, all in one, "weather station" at a ham radio swap meet. This system has an anemometer, thermometer, barometer, rain gauge and humidity sensor mounted on the roof. An RF link brings the data down to a display in the house. It has two significant problems:
1) there is no way to record the data, with a short power glitch and all the stored data is gone.
2) The best place for an anemometer is a terrible place for a thermometer.
Anemometers work best in a clear area, away from trees and wind obstructions. Thermometers need to be out of the sun to measure air temperature accurately. The only clear area in our yard is in the middle of the house roof. As long as the sun is up, the rooftop temperature reads about 10 degrees F above the temperature in the shade.
It might be possible to access the measured data inside the commercial display box, but it will not be simple to do. This is the motivation behind this project.
Several years ago, I built a box that displays time, temperature, humidity and barometric pressure information in my electronics shop area. In the future, I thought that I might expand it to display the outdoor weather information too. This weather display uses the large matrix LED displays that I have been working with for a while.
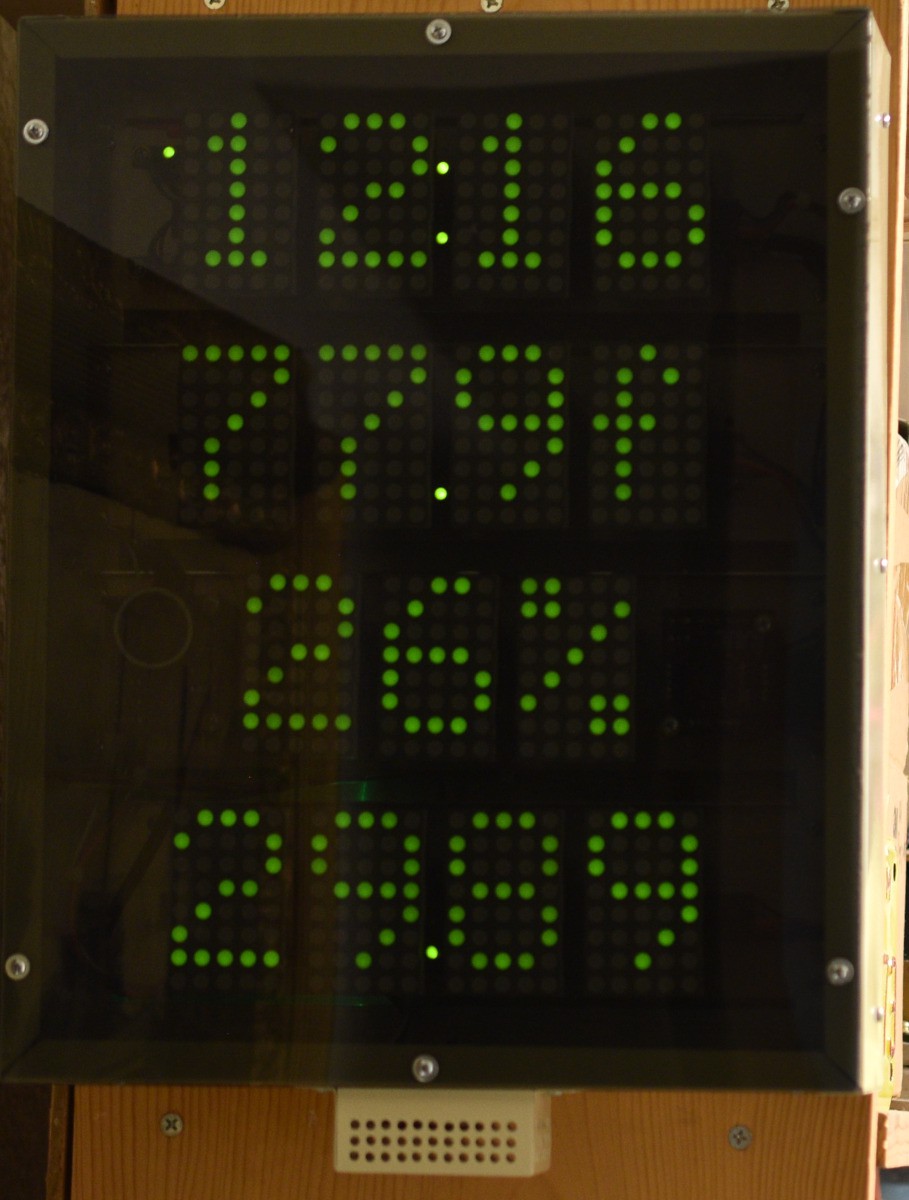
I like this display, but it is not a piece for the living room of a house, not even my house... Initially, I thought about building a "headless" system that would just record the data to my PC. After thinking about it more, I decided that displaying the data without having to power up the PC would be nice. This grew into the idea of a small indoor display and an outdoor sensor box. There are already enough of the large LED matrix displays operating in the house, so I decided on some smaller LED matrix displays in a small enclosure that will sit in the living room. This project became sort of a mini-split version of the large box displaying indoor conditions.

There is already a convenient run of CAT 5 8 conductor cable from the living room to a spot on the back porch. Since the box would require power anyway, I just opted to use RS422 for communications instead of wireless. RS422 is a differential physical layer standard that has good noise immunity which seems important for a 20 meter run of unshielded wire. The two RS422 serial data paths (Rx,Tx) use 4 wires and the remaining 4 wires are used for power to the remote sensor box. Two of the power conductors provide +5V and two provide ground. An electronic current limit on the power to the remote sensor box protects the cable and box from problems.
Both the remote sensor and the display units are smart boxes using SAMD21 microcontrollers.
The remote sensor unit has a real time clock, barometer, and temperature/humidity sensor operating on an I2C bus. Sample data is cached in a circular FIFO buffer that will hold up to 15 days of samples. Samples are captured for the FIFO every 15 minutes. The communications protocol between the display unit and the remote unit support immediate measurement requests as well as fetching the contents of the sample FIFO.
Data to update the displays on the display unit get requested from the remote unit once per minute by the MCU in the display unit. This MCU also handles formatting for the LED displays. A USB serial port on the display unit connects to the nearby PC. The display unit passes commands from the PC through to the remote unit and returns requested FIFO sample data from the remote unit to the PC. A small program on the PC requests the FIFO sample data and stores it in .csv files. This program runs every time I log into that PC.
The remote unit is housed in a (hopefully) weatherproof, poly-carbonate box. The mechanical drawing available from the manufacturer was completely useless. It was not even for the size box that I have. The sides of the box slope slightly, so there are very few right angles to work from. I measured the box and drew my own mechanical drawings to get the dimensions for the plate to hold the internal components of the box and the cutout dimensions for the (weather tight) connector. In spite of careful measurements, it still took 2 iterations on the sheet metal for the mounting plate to get everything to fit properly.
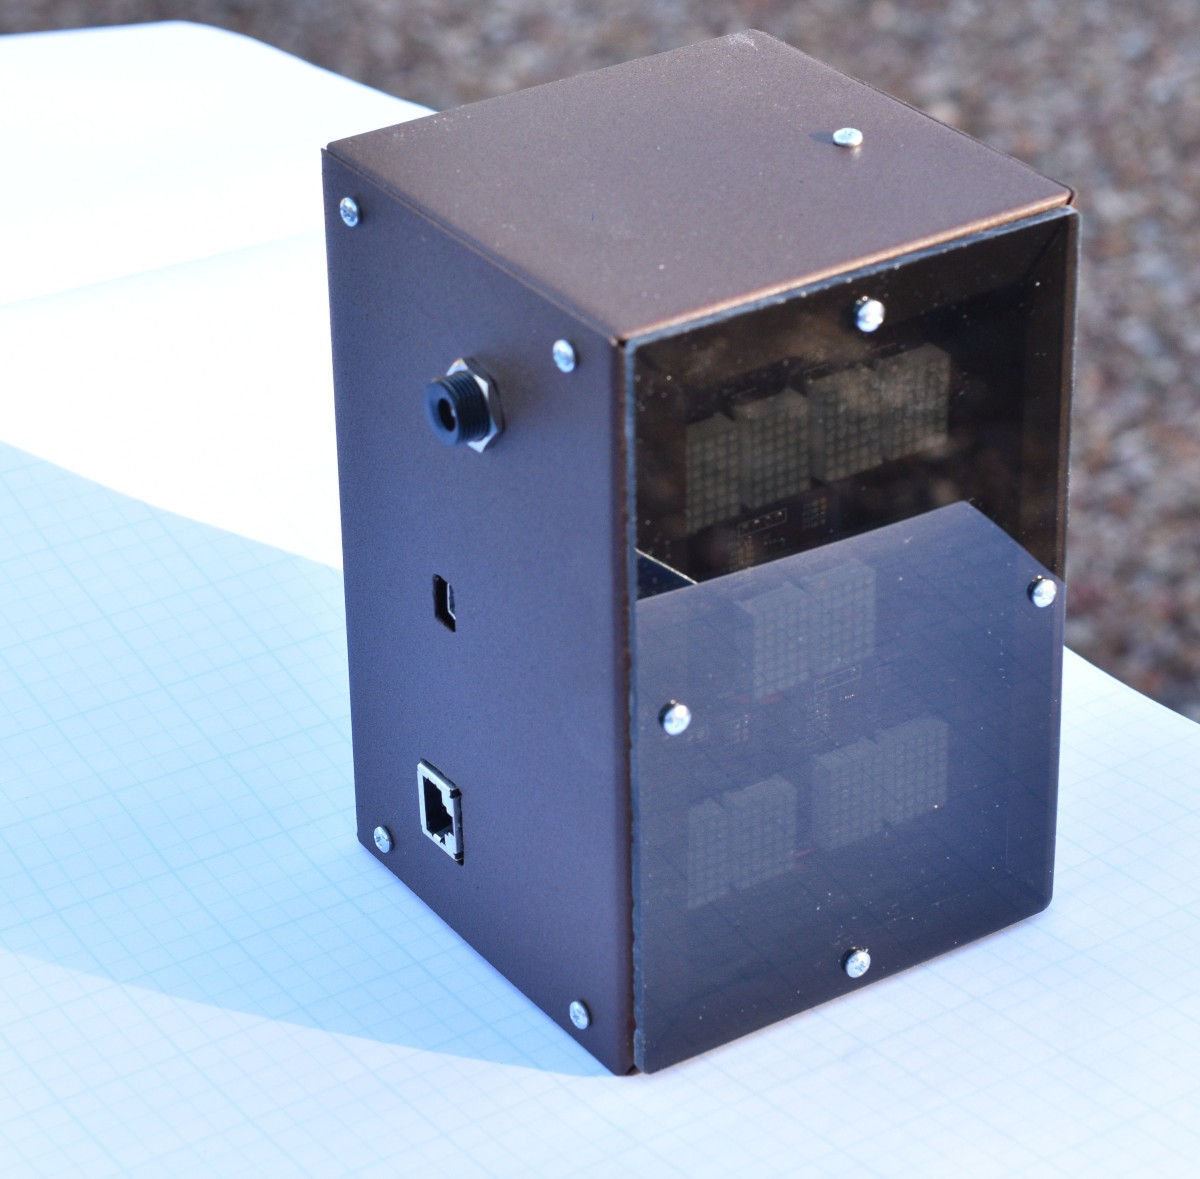
I wanted the display unit to be a small, unobtrusive box that will sit on top of the cabinet that my PC lives in. The display unit is housed in a completely custom box, made from 0.030" 5051 aluminum sheet. There was a lot of CAD work in it's design, but I am pleased with the way it turned out. The housing is powdercoated with a matte brown that looks fairly like wood at a distance. An ambient light sensor works with the display unit microcontroller software to set the display brightness to make the displays readable in any light level, but not light the whole room up in dark conditions.
Hardware
Here is a complete top level schematic of the system. The Display Box electronics are on the left side and the Remote Sensor Box electronics are on the right side. The two boxes are connected across the top of the schematic with a piece of CAT5 cable, complete with RJ45 connectors on each end.
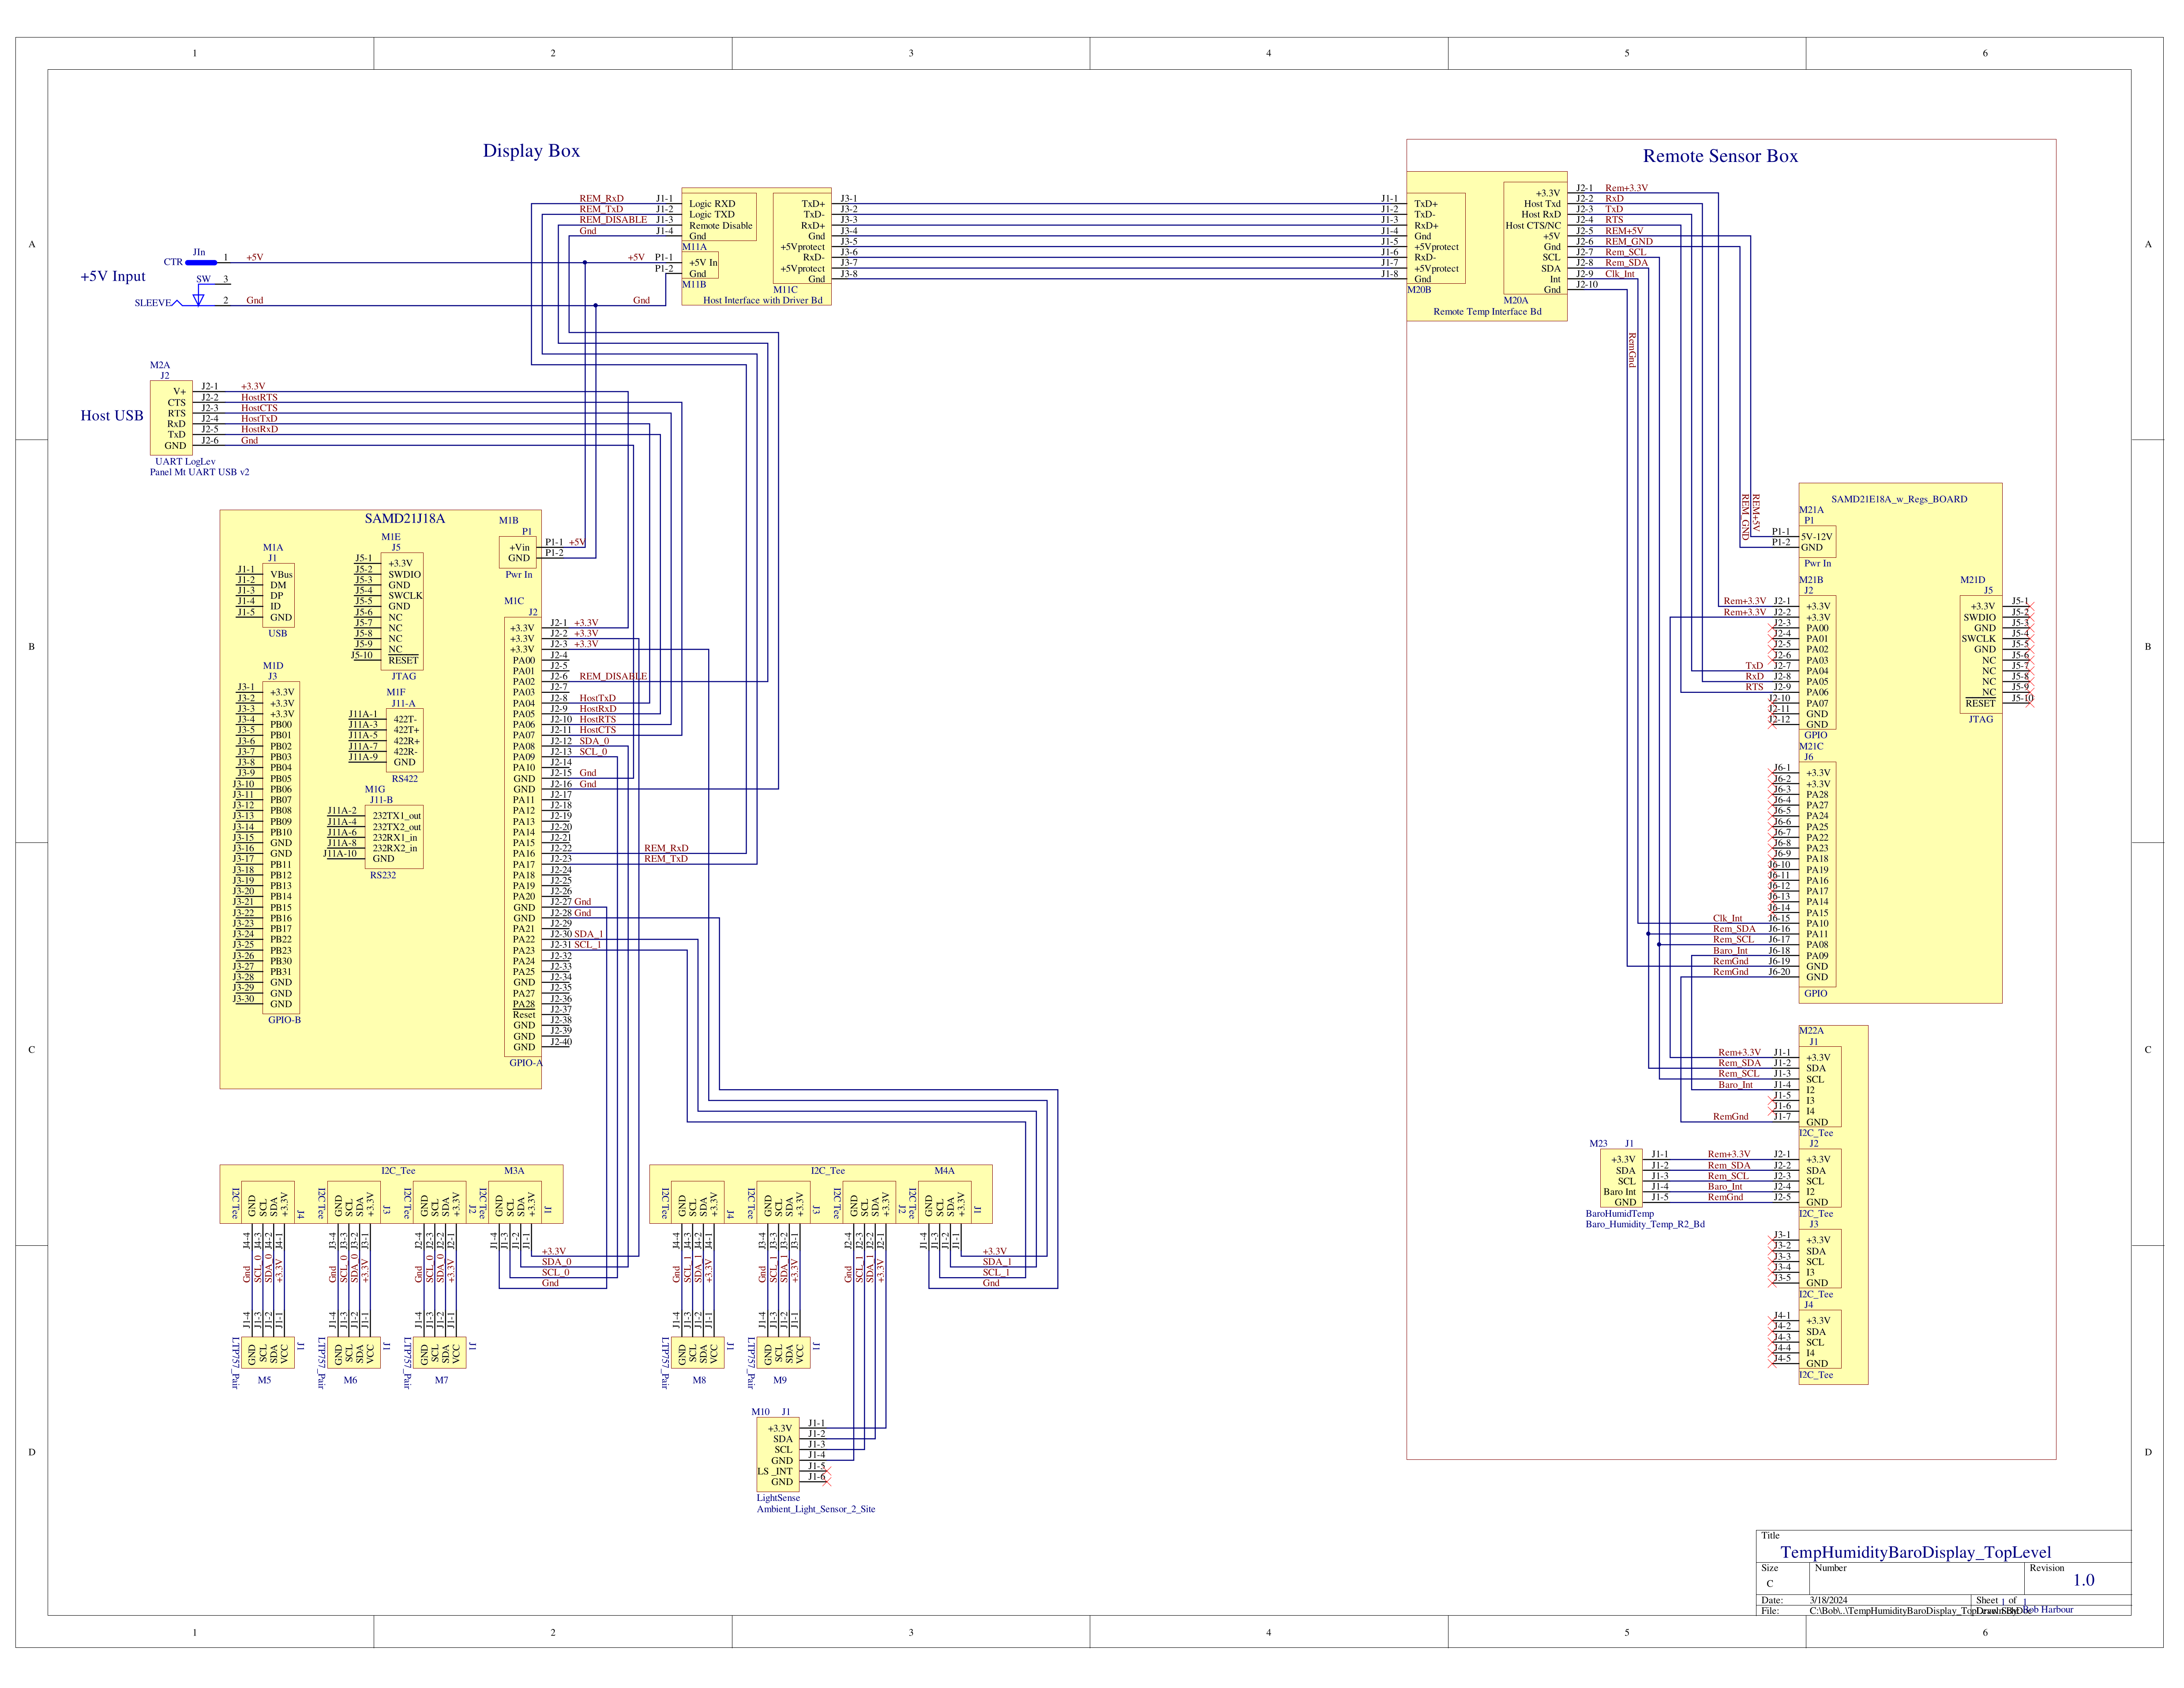
Hardware-wise, this is a pretty simple system. Both boxes have a processor board with a SAMD21 microcontroller on it. About half the board designs are re-used from previous projects. Since OSHPark sells boards in increments of 3, I often have leftover PCBs to use in new projects.

Here are all the boards that go in the Remote Sensor Box. The Remote Interface board is the lower board with the metal RJ45 connector at the left end. The CPU board is sitting on top of the interface board. The I2C Tee board is mounted to the right of the interface board and the sensor board is floating loose on the cable to the Tee board.
For prototype work and firmware development, I like to mount everything on a good base so that boards don't float around and short against each other. It is also a good way for me to check the mechanical drawings that I use for laying out the final enclosure.
The Remote Sensor Box interface board has an RS422 transceiver chip, a clock/calendar chip with battery backup, and connectors. The RJ45 connector is a "Rugged" with IP68 rated sealing to keep moisture out of the sensor box. On the mounting face of the connector, an O ring seals the face to the inside of the sensor box to complete the seal.

Signals and power into the box are protected with TVS diodes because of the long cable and exposed environment. A ferrite bead is also included on the power input to reduce conducted RF emissions from the box to the cable. So far, the system has been reliable, but I am curious to see how it behaves through the upcoming summer electrical storm season.
Accurate time is kept in the sensor box to time stamp the sample data. An NXP PCF2127T chip is used for the clock/calendar. A few resistors and capacitors and a coin cell backup battery complete the clock. The crystal is inside the chip package and it is very well trimmed at the factory for accuracy. There is also a small amount of RAM (512 bytes) that is backed up with the battery. It talks to the processor via I2C and an interrupt signal. I have used this chip in several projects and been very happy with the results. The on-chip RAM is a convenient place to store system setup data and such. I also have drivers written that are reliable.
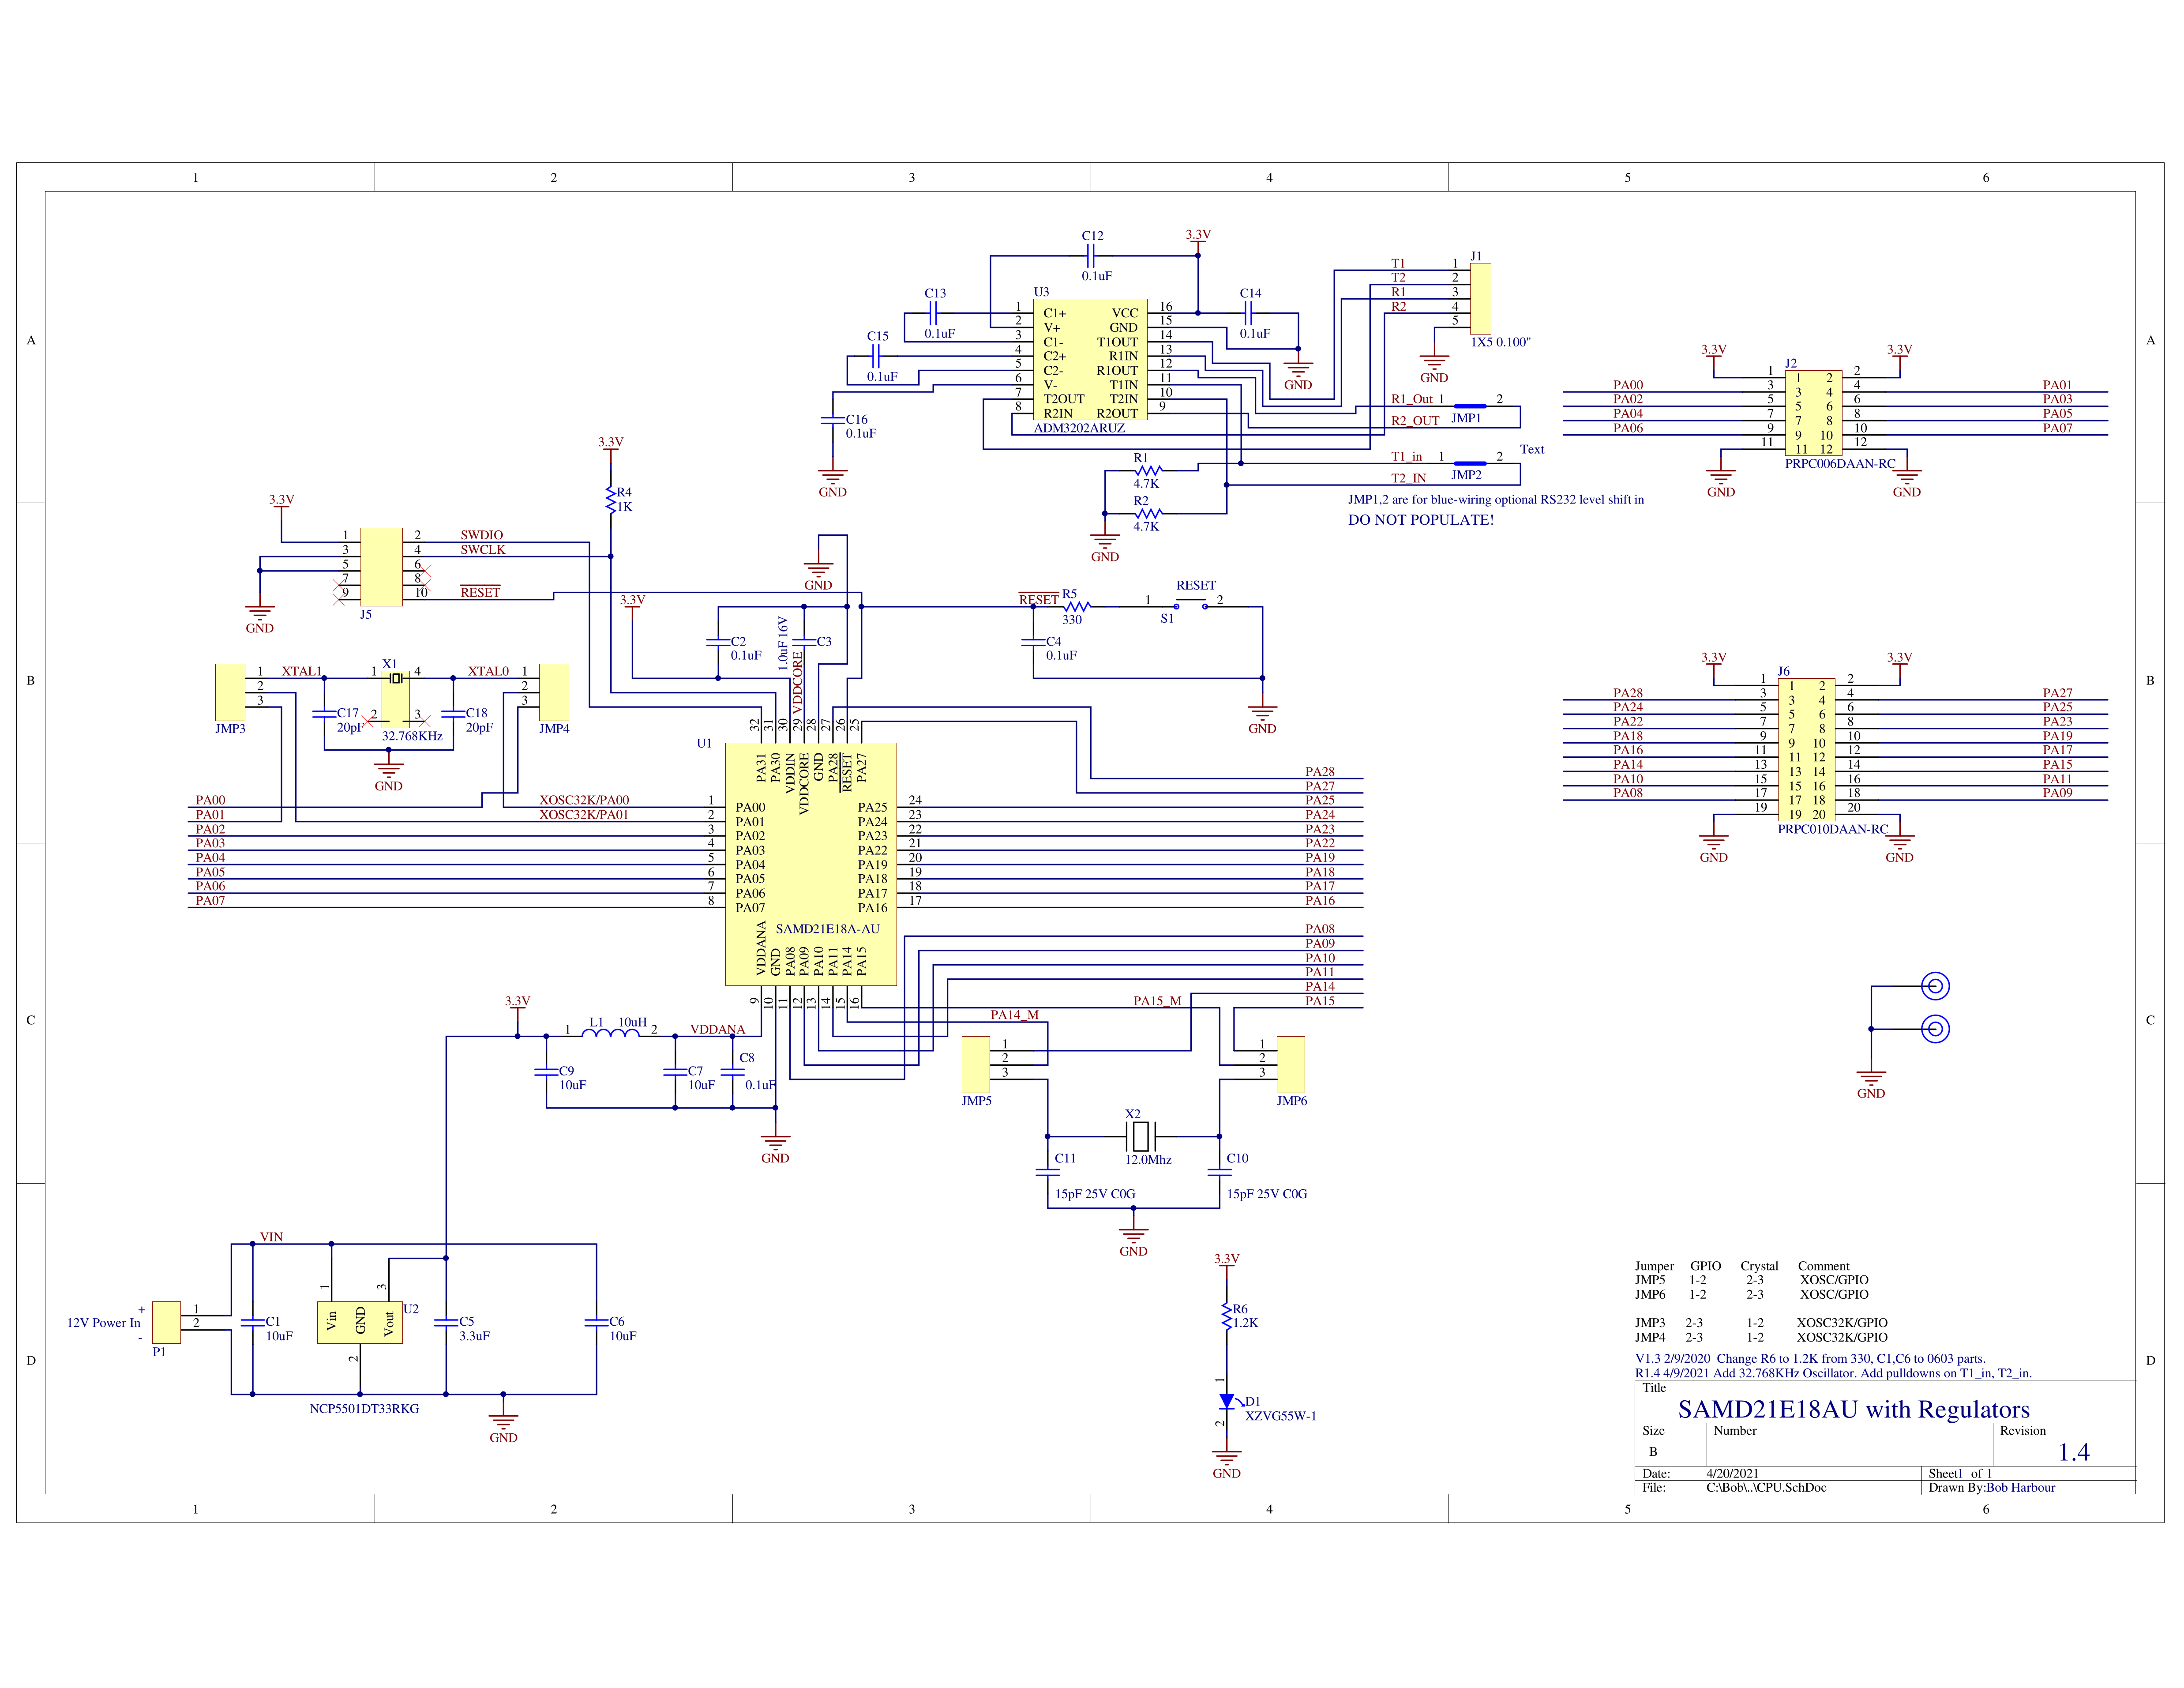
The processor board has the SAMD21E18 version of the the processor on it and an LDO voltage regulator to drop the incoming 5V down to 3.3 for the processor and sensors. This processor is in a 32 pin package and only has 3 of the SERCOM blocks pinned out. The board has 12.0MHz and 32.768KHz crystals for the processor clocks and an RS232 driver. For this project, the RS232 driver is not populated. One of the SERCOM blocks is configured as a UART and is wired to the RS422 transceiver on the interface board. Another SERCOM block is configured as an I2C interface and it talks to the barometer and humidity sensors on the sensor board.
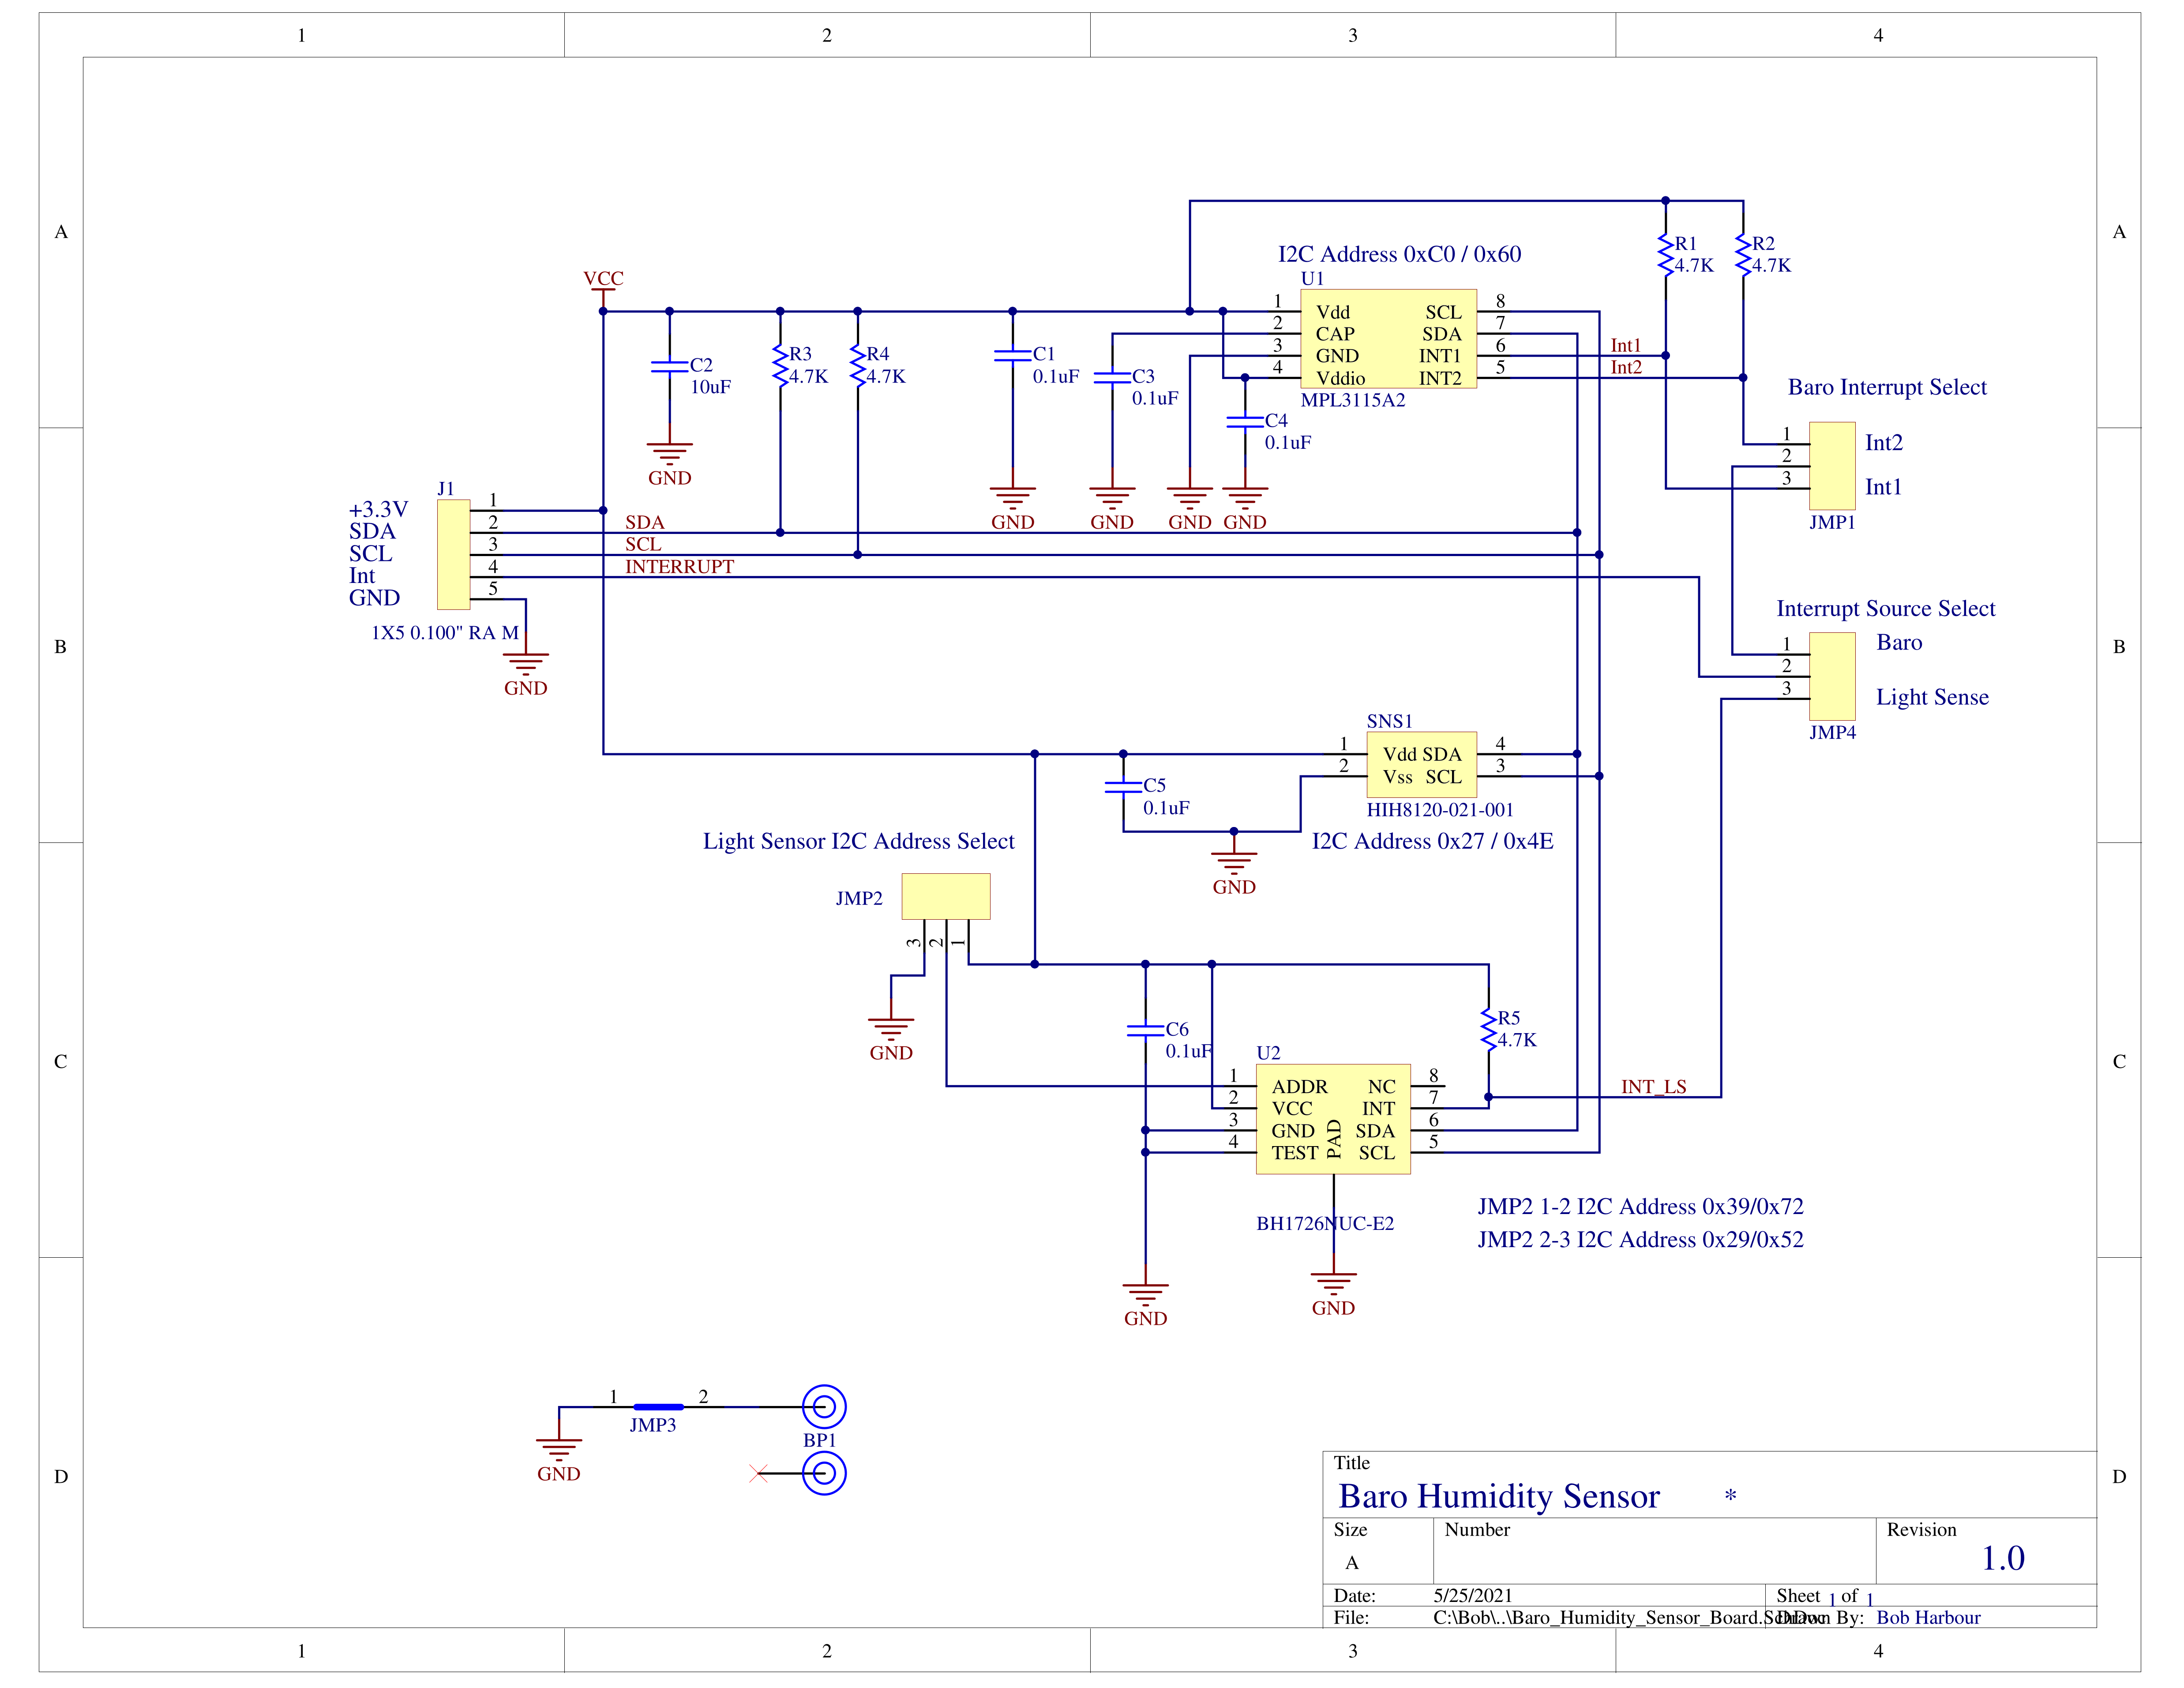
The Baro/Humidity/Temp sensor board is another re-used board design from a few years ago. It uses a Temperature and Barometer sensor from Freescale/NXP and a Temperature and Humidity Sensor from Honeywell. There is a site on the board for an ambient light sensor, but it is not populated on this project. This board sits outside the sealed box so that it can sense the air conditions. Both the barometer chip and the humidity sensor chips measure temperature. I used the humidity sensor temperature measurement because it is slightly higher resolution.
Wiring for this board is put through a gland nut to maintain the seal on the box. Normally, I put connectors on each board, but I soldered the wires for this board and put the connectors on the other end. In order to make the sensor board removable, I used a 2 pin and a 3 pin connector shell on the loose end of the cable so that the connectors can be threaded through the hole in the box for the gland nut. To separate the sensor wiring from the large connector, I used a fanout board. The only components on these fanout boards are connectors. This board makes it easy to connect multiple things to an I2C bus without having to make in-line splices of the wiring harness. In this case, it was used to make the connector genders work out.
The clock and the baro sensors have interrupt signals back to the processor board to simplify the software. These interrupt signals are routed to normal GPIO signals for the processor. One register read by the processor can fetch the state of all of the interrupts.
Here is the Indoor Display Unit with the power, USB and RJ45 connectors visible..
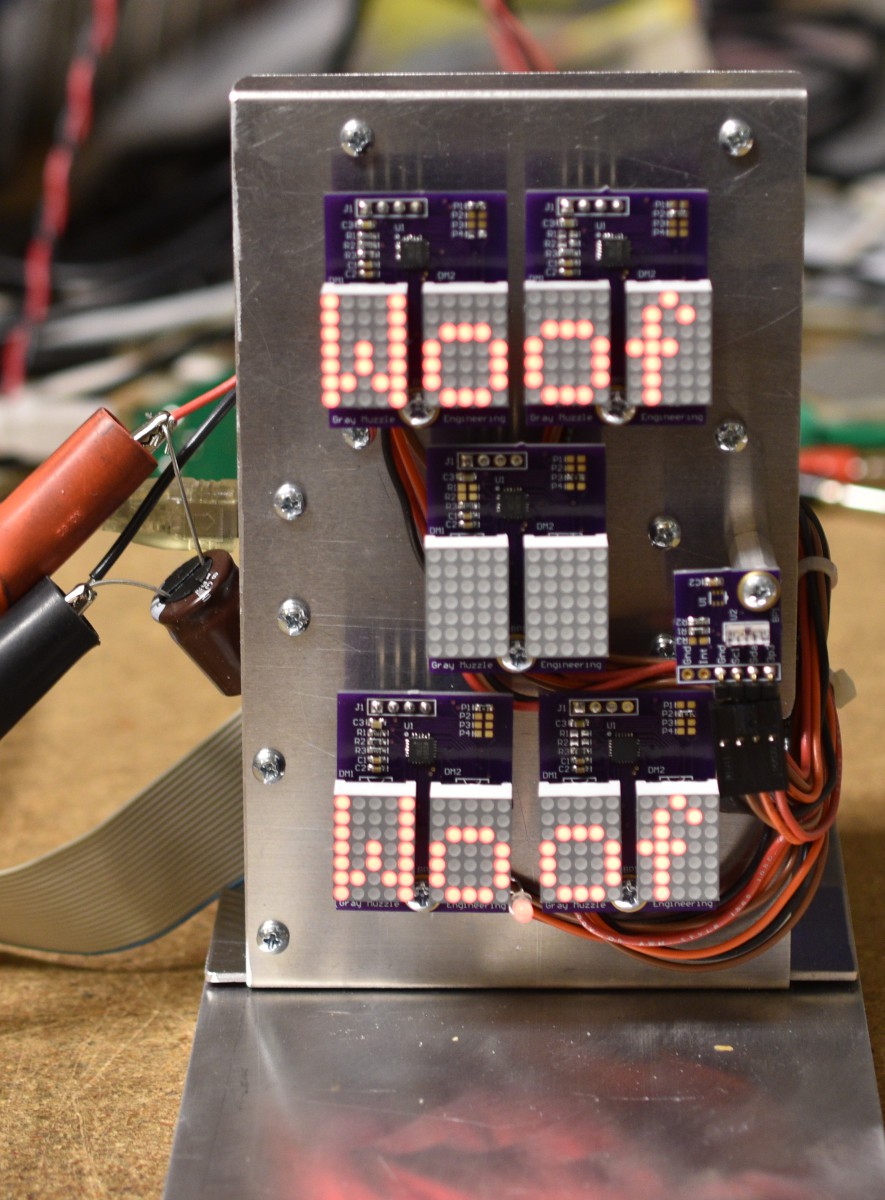
Here are the display boards and the ambient light sensor on the front of the electronics mounting plate. The ambient light sensor is used for automatic intensity control of the displays. Matrix displays can show any character that you have in the character generator tables. In the normal use, most of the displays are showing numeric data. A little more information about the displays can be found in my project #More LED Matrix Display Fun .
For development, I made a thick aluminum base plate and clamped the electronics mounting plate to it.
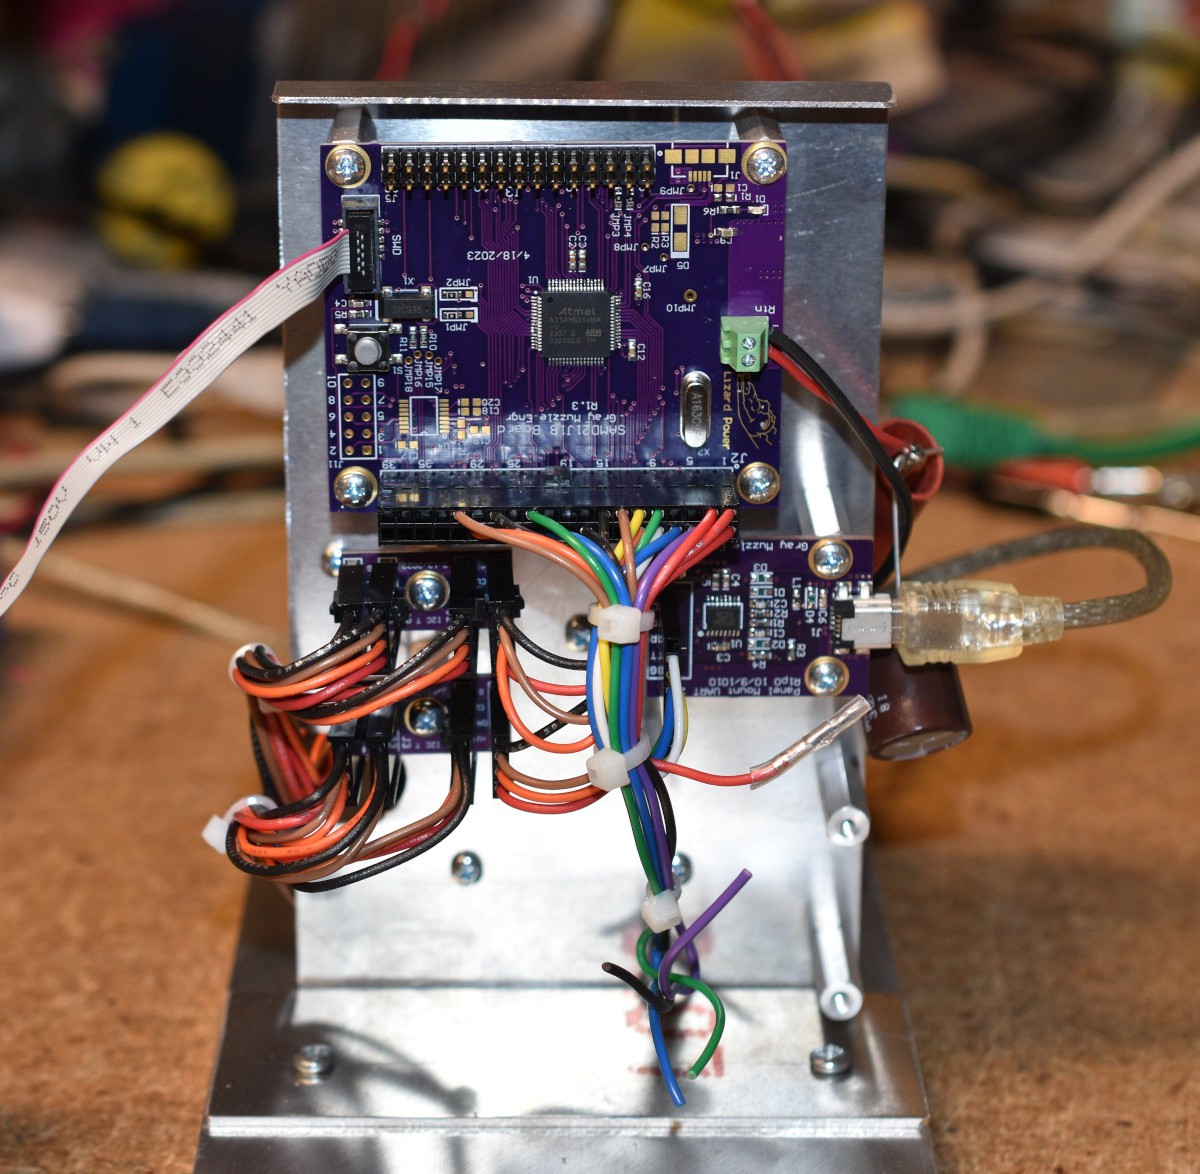
Here are the boards for the Display Unit The processor board is the one on top. The lower right board is a UART to USB board that is used for downloading sample data from the remote sensor to a PC. Two of my I2C Tee boards are on the lower left. Two I2C ports are used for driving the 5 display boards and the Ambient Light Sensor board. Each of the display boards can be configured for one of four I2C addresses. I could have driven everything from one port using an I2C multiplexor, but I had spare ports on the processor board and the I2C Tee boards are cheap. The empty space at the bottom is for the remote interface board, which was at OSHPark being fabricated when this picture was taken.
This processor board uses the SAMD21J18 chip which is in a 64 pin package. A 64 pin package provides enough pins to access all 5 of the SERCOM blocks and all of the timers and other goodies on the chip. I used this board because I had one bare board left over from previous projects and most of the parts to populate it.

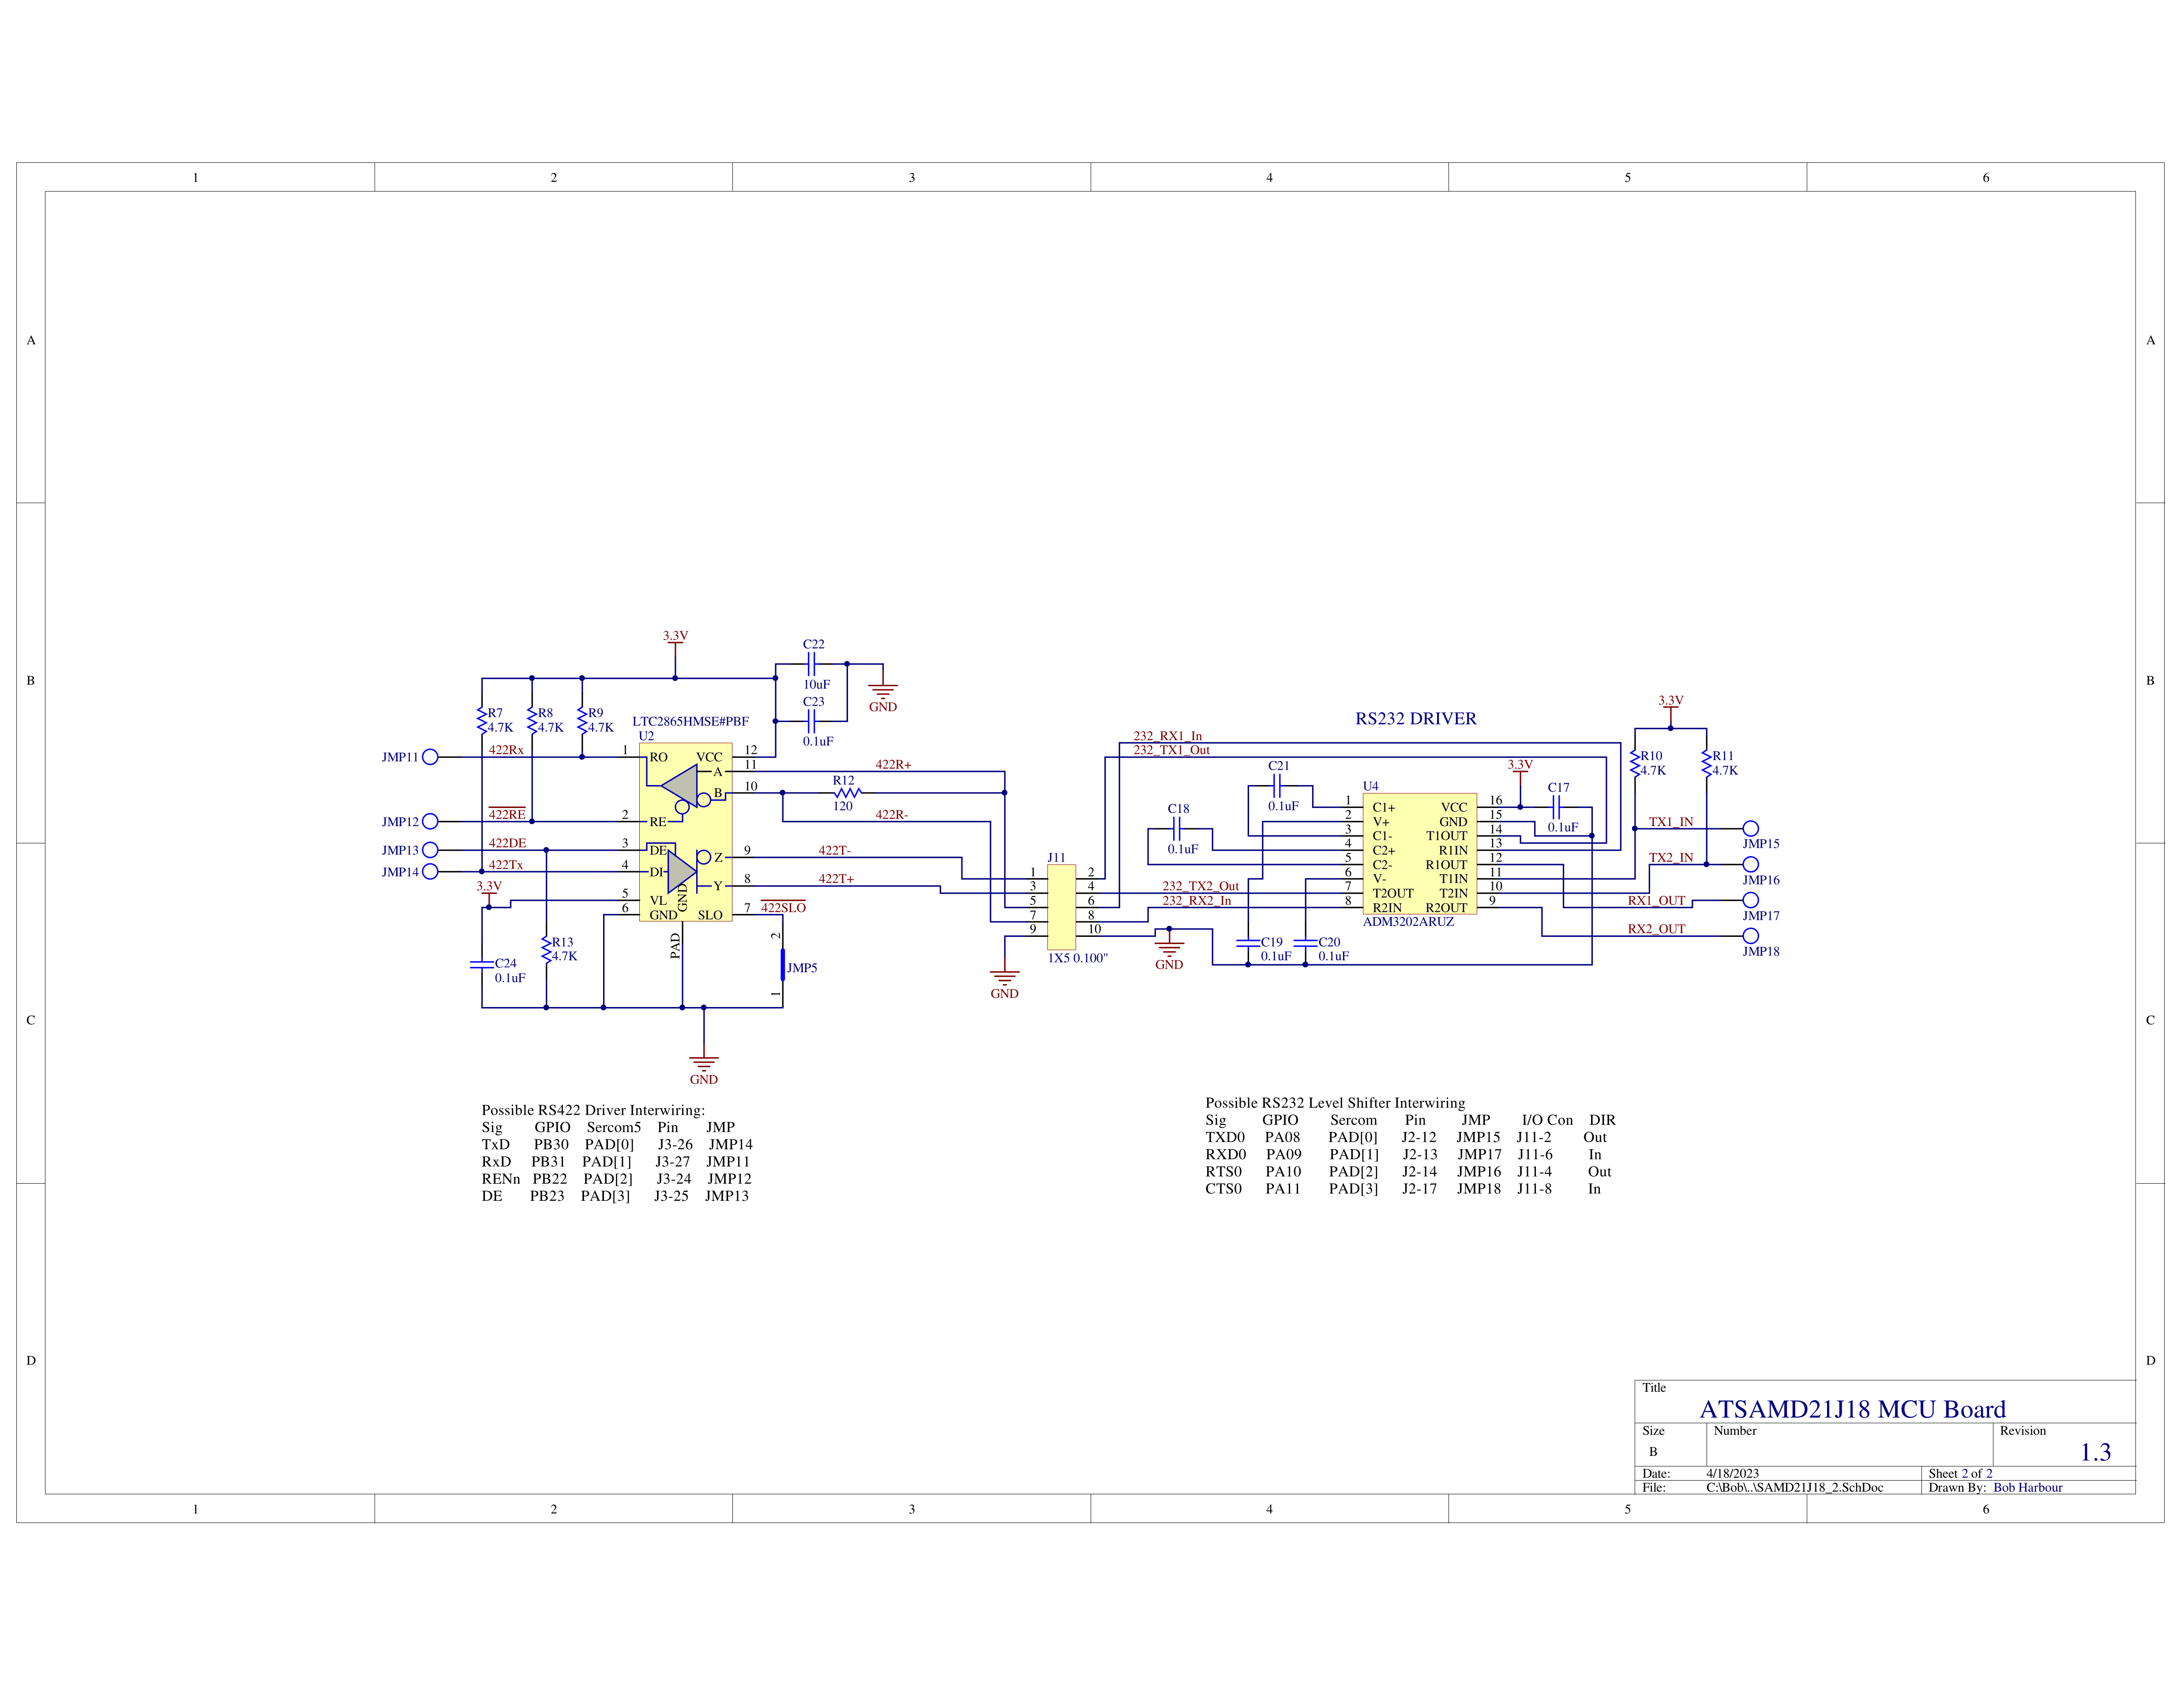
This board has sites for a USB connector, an RS232 level shifter and an RS422/485 transceiver chip, but I opted not to use any of those. I skipped the RS232 level shifter and used the off board UART to USB board because I was going to have to get to USB somewhere in the system and it makes more sense to go directly from the UART to the USB interface.
When I designed the hardware, I had not designed the communications protocol between the display and the remote sensor box. The on-board RS422 interface only supports the Rx and Tx signals, and I was expecting to need the RTS/CTS path for handshaking. As a result, I put a separate RS422 interface chip on the remote interface board that has an extra driver and receiver channel. After designing the comm protocol, I realized that I did not need the handshake signals, and re-used those wires for extra power wiring.
It is probably possible to implement the USB UART interface on the SAMD21 chip, but I have not done the software for driving it yet and I did not feel like fighting with the manufacturer library implementation to do this.
The UART to USB board uses the FTDI FT230 chip and a few passive parts. The USB VBus is not used to power anything in this configuration because the display box is powered continuously and the PC that hosts the USB is turned off when not in use. I tried powering the FTDI chip from the VBus, but when the PC is switched off, it was generating spurious characters in the display box UART data. Changing the power source for the FTDI chip over to the display box power solved this.
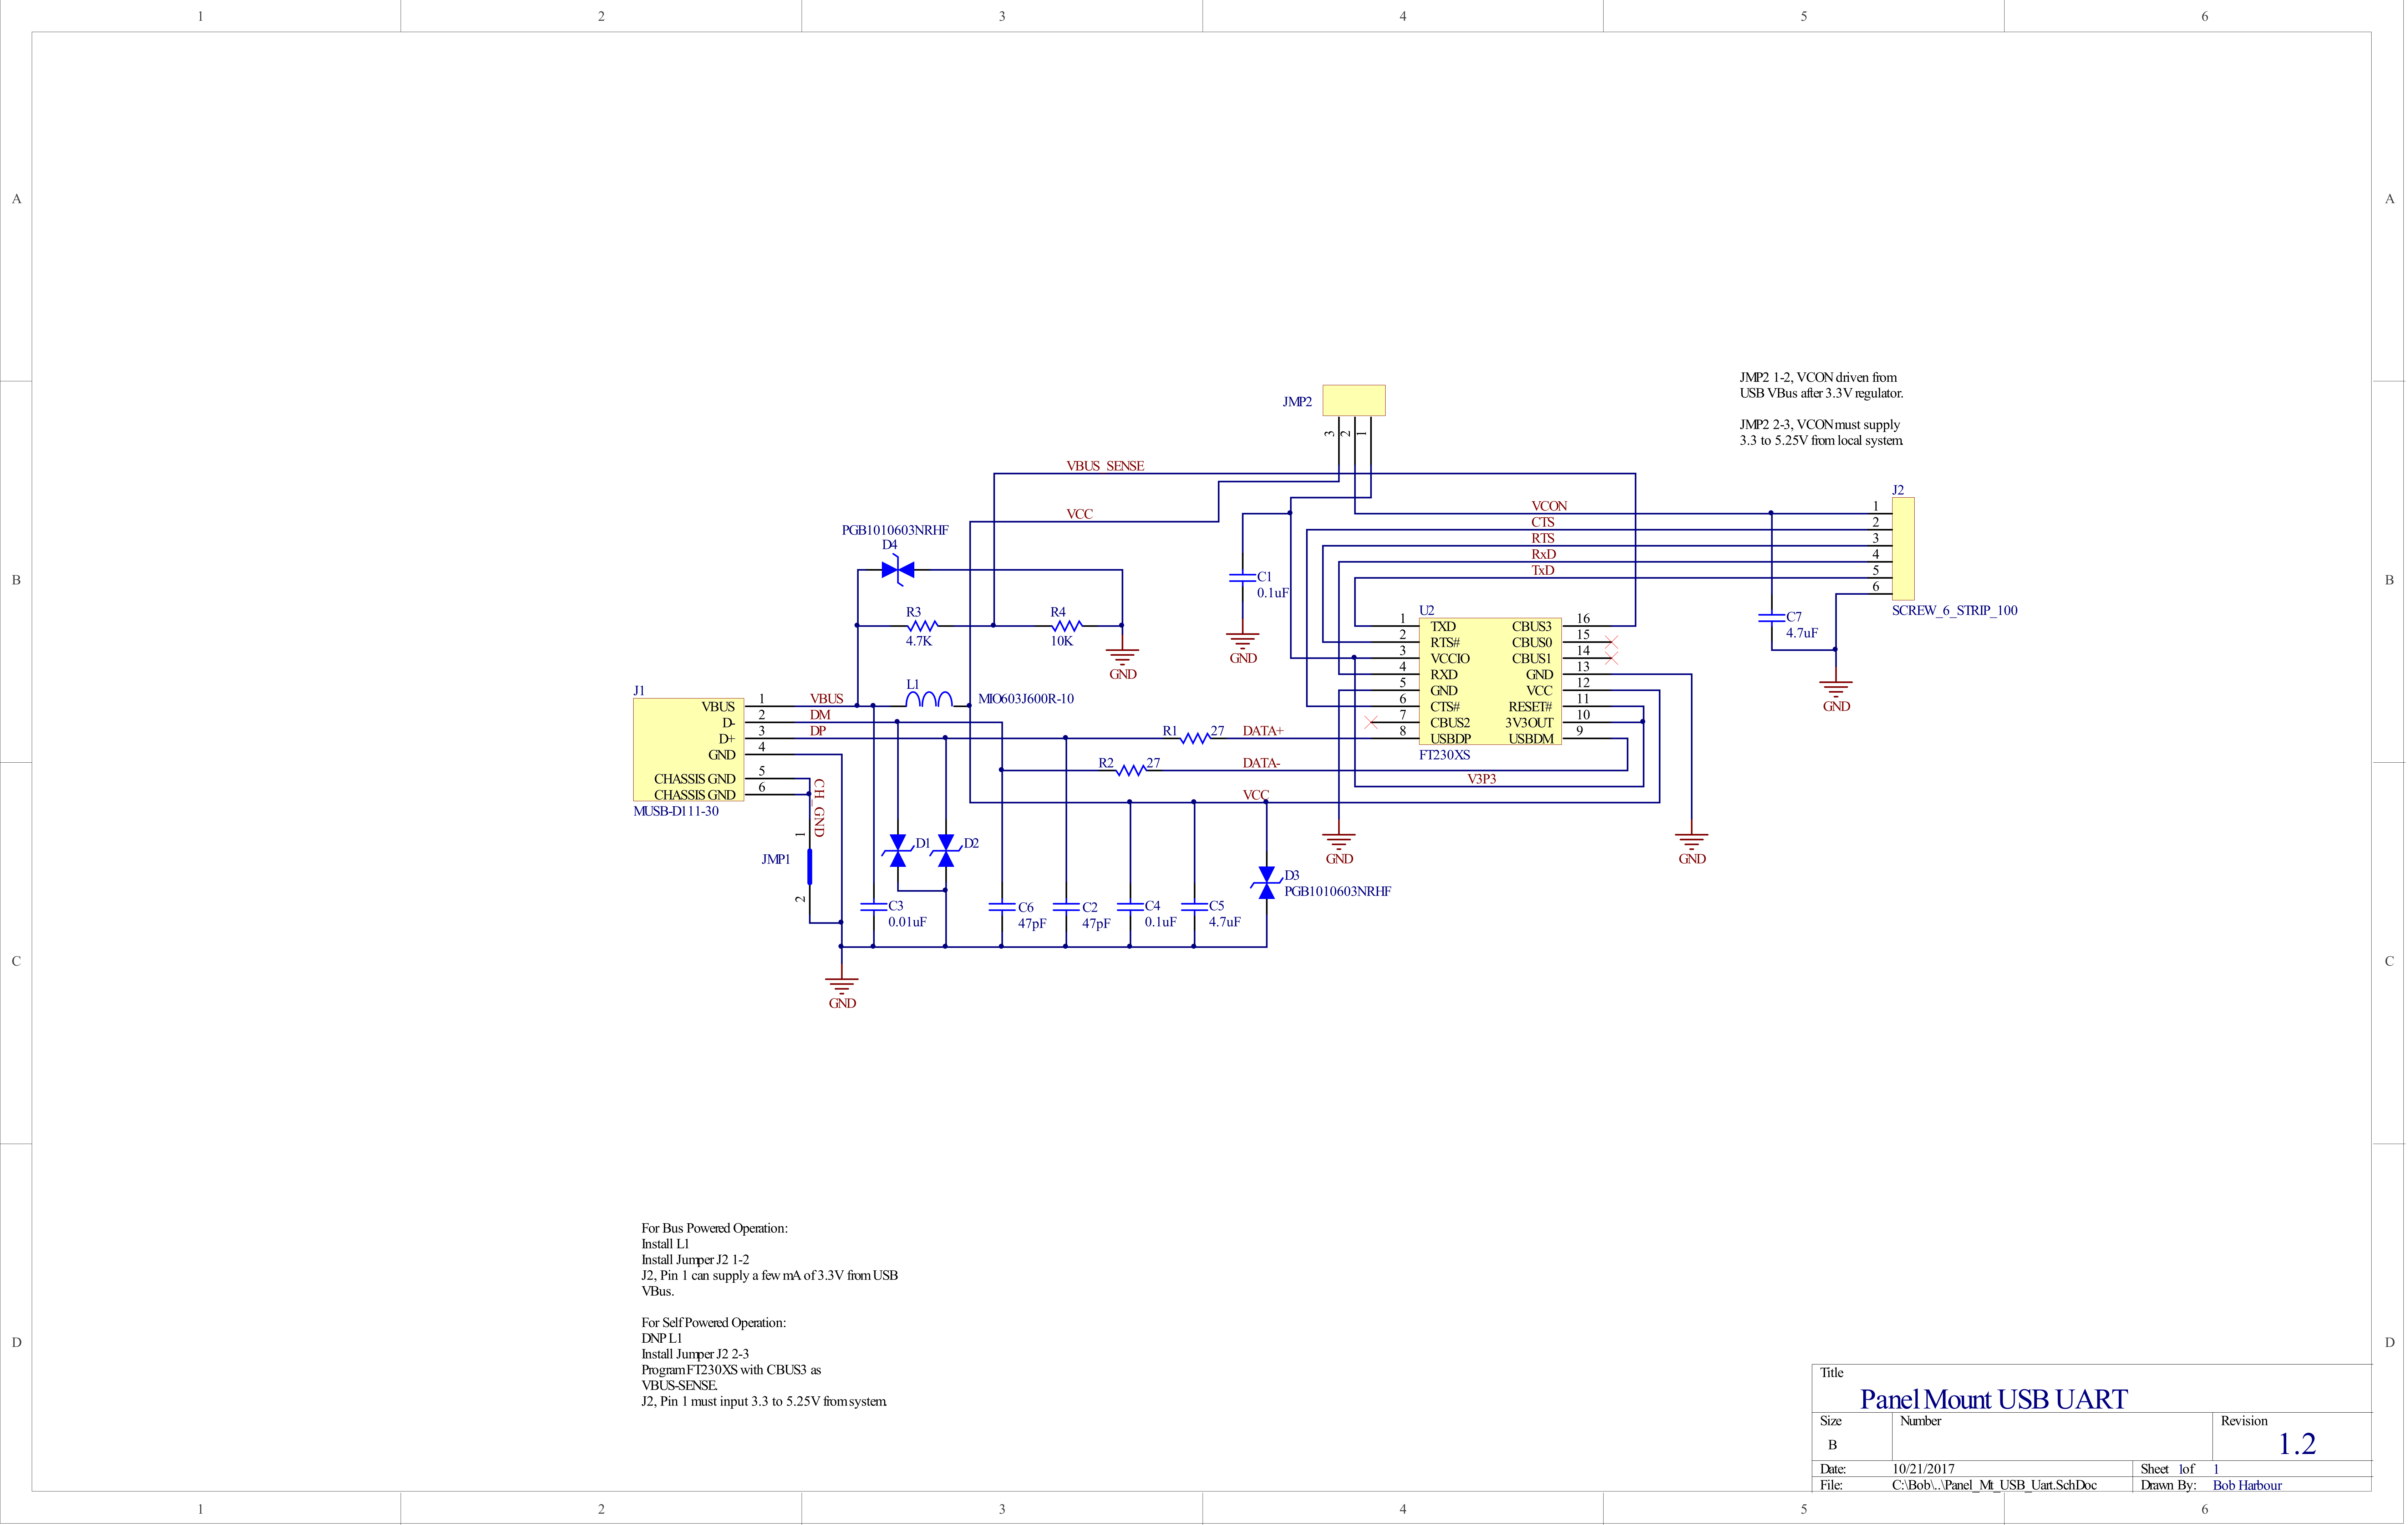
Connecting JMP2 pins 2 to 3 sets the board up for external power input.
The remote interface board has the RS422 chip that has already been discussed and an efuse chip to limit the current supplied to the remote sensor box. A run of about 60' (20M) of CAT5 cable through the attic of the house connects the display box and the remote sensor box. Considering that the wires in CAT5 cable are 24 gauge, I wanted to prevent fires in the event of a short in that cable or in the remote sensor box. The efuse is configured to turn off the power to the remote sensor box if the current exceeds 450mA. There is a 1 Amp conventional fuse on the input path in case the efuse were to be damaged.
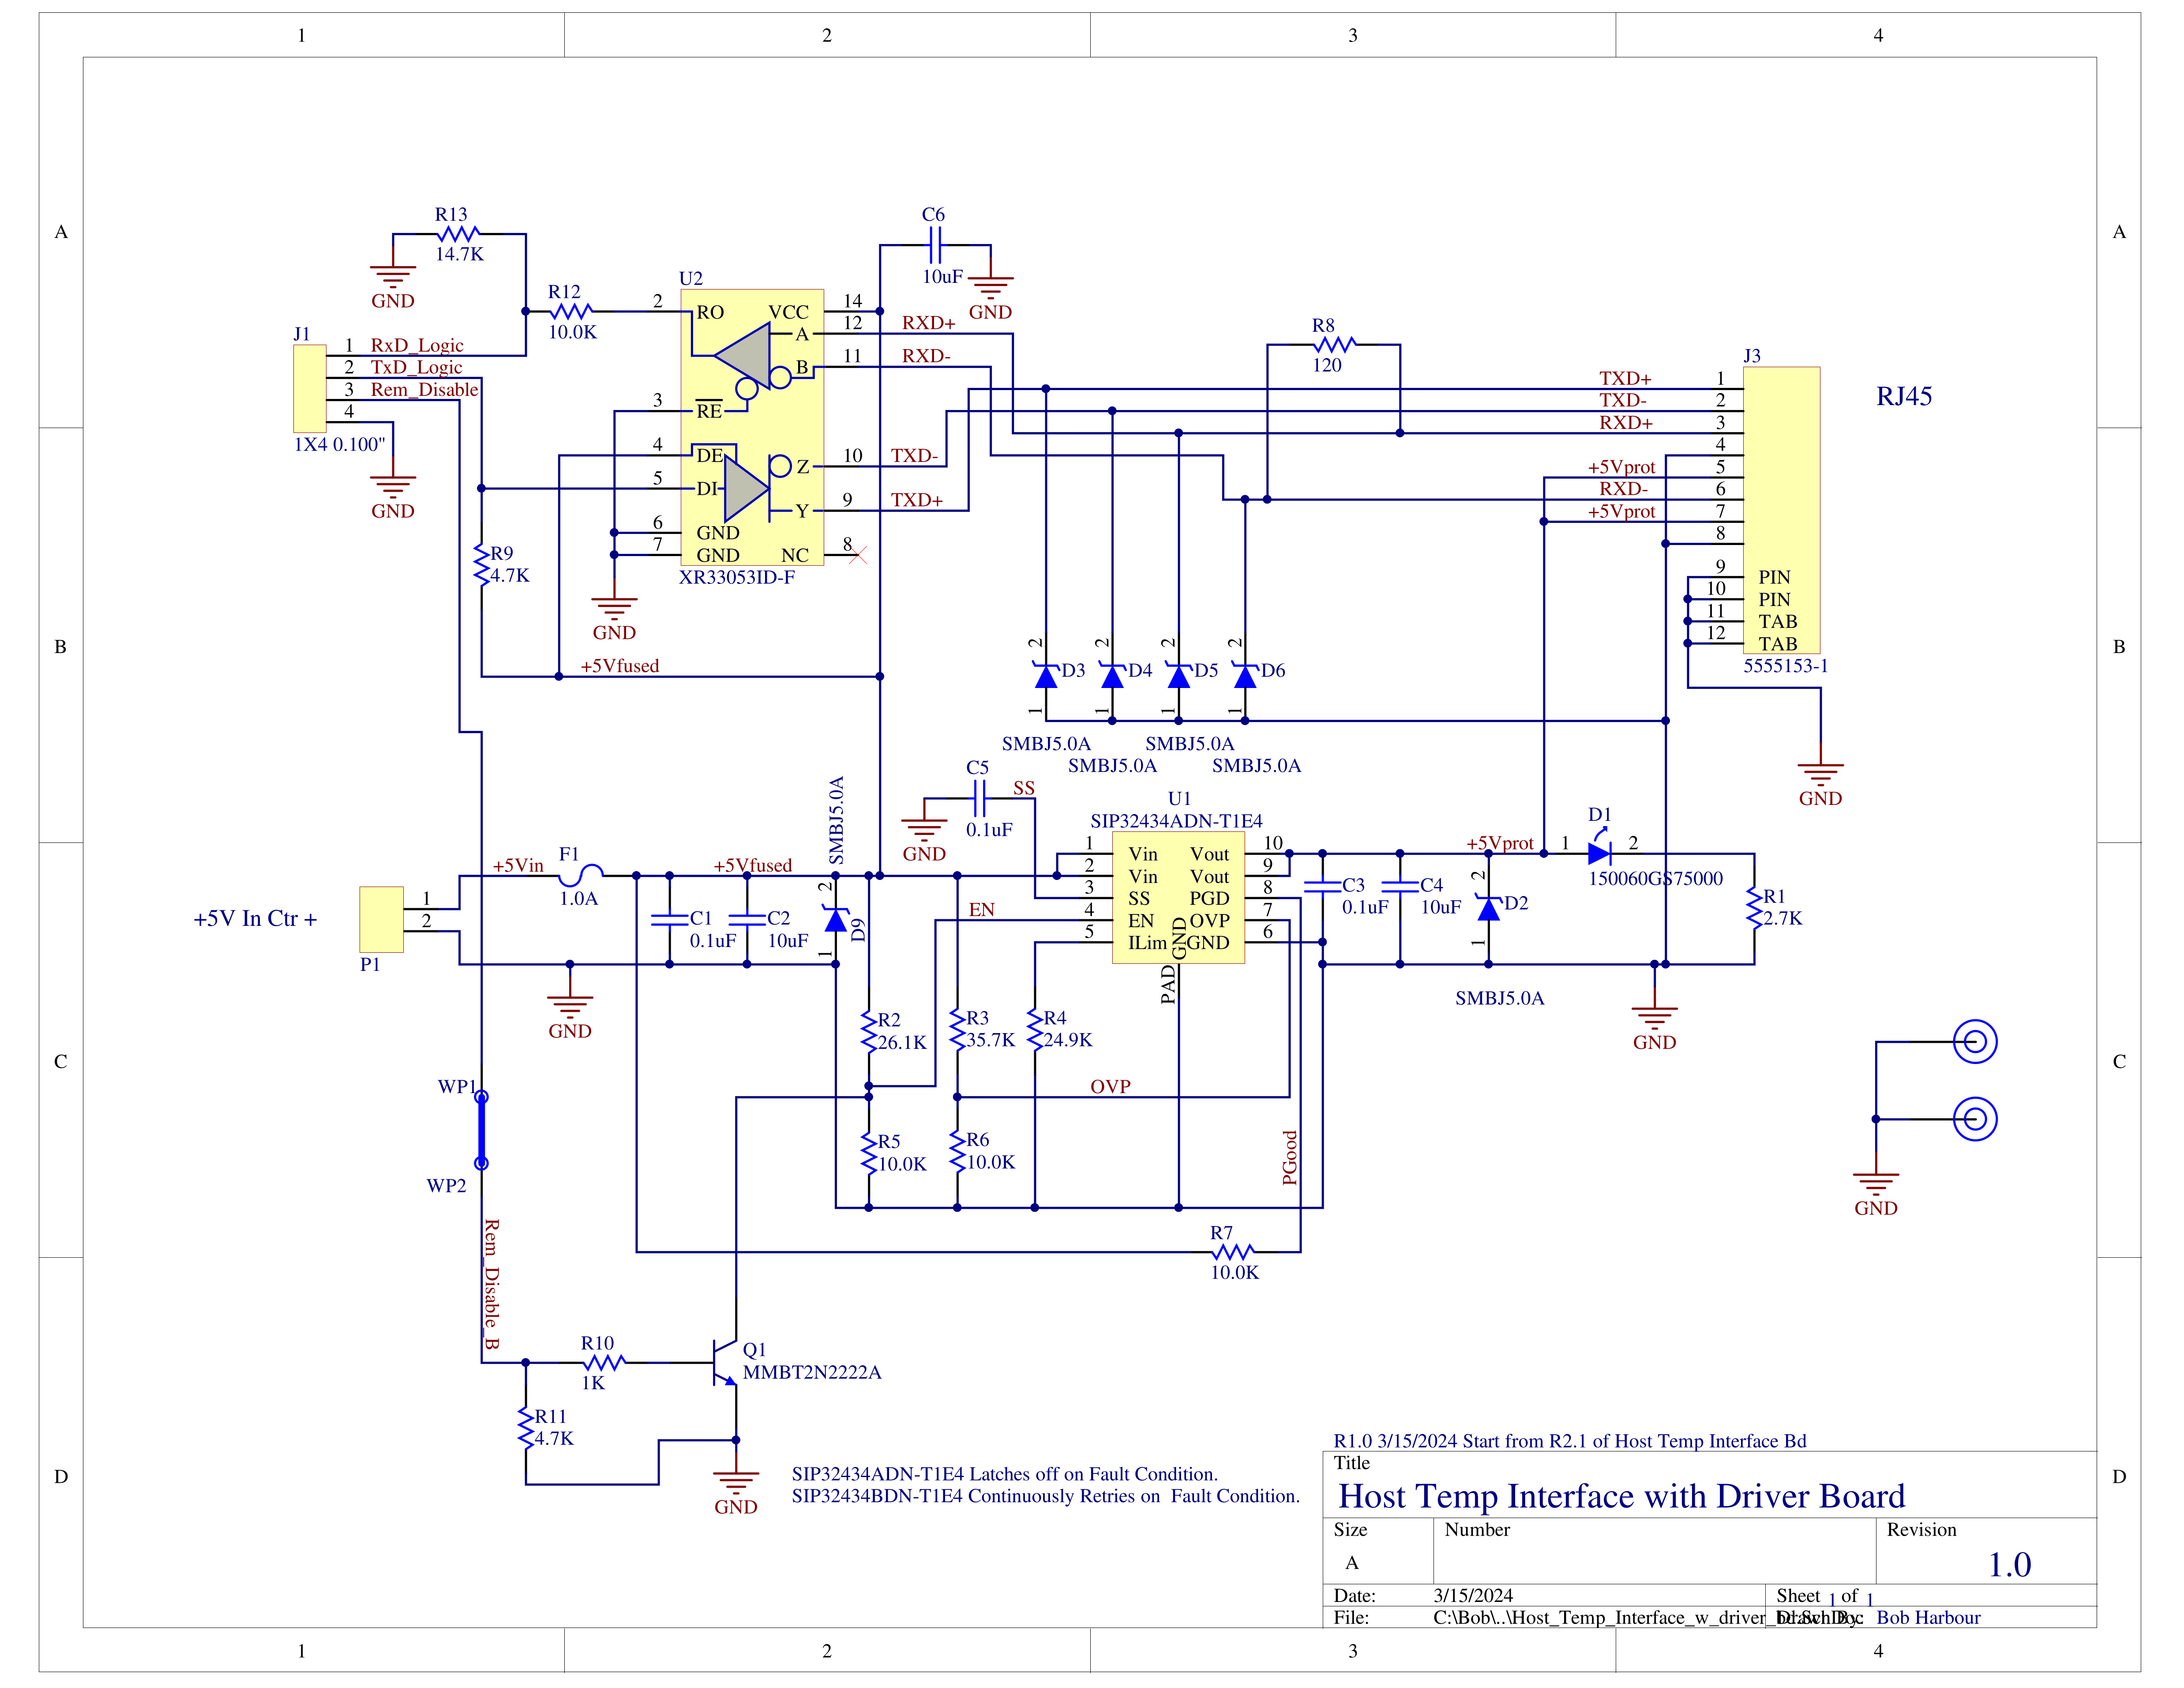
In addition to the efuse providing over-current protection, it allows the display box processor to reset the remote sensor box in the event that messages are not responded to in a timely way.
Initially, this board used a USB type current limiter chip (AP21410FM-7) instead of the efuse. When the current exceeded the 500mA set point, the chip changed into linear mode, so the chip would attempt to dissipate the power needed to limit the output current to 500mA. I was not happy with this because the chip got extremely hot. I designed the comm protocol between the display and the remote sensor box while I was deciding what to do about the heating problem. I realized that I did not need the extra handshake signal on the RS422 interface. Re-using the two wires that were assigned to the handshake signal to become additional power and ground wires would reduce the voltage dropped across the cable. While this was going on, I found the efuse chip that would do what I wanted, so I re-designed the remote interface board to use the new efuse and a new RS422 driver/receiver chip that only had one receiver and transmitter. This could have been moved to the CPU board, but I already had the wiring harness made, so I left the RS422 chip on the remote interface board.
TVS diodes protect all of the signals and power on the cable against inductive effects and other problems related to 60' of wire in the attic.
Measuring the current requirements of the remote sensor box, it only uses about 65mA at 5 Volts. Testing with a 100' CAT5 cable showed the voltage drop using two power and two ground conductors was only about 45mV.
A 5 Volt wall wart provides power to the display box and the remote sensor box. There is some sensitivity to the input voltage on the display box. If the input voltage is below 5.0V the system does not start reliably. I found a wall wart that puts out 5.20 Volts, and everything is happy. A better fix would have been to use a 12V wall wart and put a voltage regulator board in the display box, but I got lazy. If problems show up, I can do that later.
Current consumption on the display box and the remote sensor box is dependent on the LED brightness. At maximum brightness, the current is about 210mA. At minimum brightness, it is about 130mA.
Software
6/22/2024
This system was originally designed to be used without the display unit. All of the measurement control and calculations take place in the remote sensor box. The display unit behaves as a pass through for PC to remote sensor unit communications, and originates requests for measurement information once per minute for local display.
Periodic sample data is stored in a FIFO that takes up most of the RAM in the remote sensor box. FIFO data is handled via separate commands from the configuration and single measurement commands. The SAMD21E18 processor has enough RAM to store about 15 days worth of periodic measurements when samples are acquired every 15 minutes.
The command set for the remote sensor box looks like this:
"FRQST", // 0 FIFO Data Request
"FACK", // 1 FIFO Data Acknowledge
"FNAK", // 2 FIFO Data Negative Acknowledge
"FCLR", // 3 FIFO Data Clear
"DATE", // 4 Set Date and Time
"SHOW_DATE", // 5 Request Data and Time
"ALTITUDE", // 6 Set Barometer compensation Altitude
"TSAMPLE", // 7 Set sample Period in seconds
"SET_F_C", // 8 Select Farhenheit or Celsius units
"SHOW_DATA", // 9 Request date, time, pressure, humidity and temperature data
"SHOW_ALT", // 10 Request barometer compensation altitude.
"SHOW_F_C", // 11 Request temperature unit setting
"SHOW_TSAMPLE", // 12 Request time between periodic samples
"SHOW_HW_STATUS", // 13 Request hardware configuration results (debug)
"NVM_WRT", // 14 Write TSAMPLE, ALTITUDE, and temp units to NVM
"NVM_DEFAULT", // 15 Set NVM values to defaults
"HELP" // 16 Show command list and parameters needed
In order to fetch FIFO samples, the PC host issues an FRQST command. The remote unit responds with a data packet. The PC calculates a checksum for the received data packet and compares it to the one transmitted with the data packet. If the two checksums match, the PC issues an FACK command and the remote unit advances the FIFO pointers to the next record. If the checksums do not match, the remote unit re-sends the previous data packet. When all data from the FIFO has been sent, the remote unit indicates that it has no more FIFO data by sending a packet with zeros in all of the data fields except the checksum.
All of the communications traffic is in ASCII. This choice was made because it is a lot easier to debug communications that are human readable than binary communications. The volume of communications traffic is low enough that it did not justify the extra effort to use a binary protocol. FIFO data packets look like this:
int8_t Synch_Char_1 // 'Z'
int 8_t Sync_Char_2 // 'Z'
uint8_t year; // sample time year - 2000
uint8_t month; // sample time month
uint8_t day; // sample time day
uint8_t hour; // sample time hour
uint8_t minute; // sample time minute
uint8_t weekday; // sample time weekday
uint16_t baro_x_100; // barometric pressure x100 fixed point
uint16_t hum_val_x10; // humidity x10 fixed point
int16_t temp_val_x10; // temperature x10 fixed point
uint16_t checksum; // Transmitted Checksum value
The actual data values are sent as hex ASCII (0..9 A..F). Measurement data (baro, humidity, and temperature) is handled as fixed point data.
A FIFO request data (FRQST) gets a response on the physical layer that looks like:
// Z Z Year-2000 Month Day Hour Minute Weekday Baro x 100
0x5A 0x5A 0x31 0x38 0x30 0x36 0x30 0x42 0x31 0x30 0x31 0x45 0x30 0x32 0x30 0x42 0x41 0x39
// Humidity % x 10 Temperature x 10 Checksum <LF>
0x30 0x30 0x30 0x35 0x30 0x34 0x33 0x39 0x30 0x34 0x46 0x42 0x0A
Field labels indicated by the // are not part of the transmission. Data is sent in Big Endian format. The previous data corresponds to:
Tuesday 06/11/2024 16:30 29.85in_hg 5%, 108.1 degrees F
Non-FIFO command responses are completely human readable, using decimal numbers with other text attached for readability. For example, the SHOW_ALT command gets a response:
Compensation Altitude 1134 feet <LF>
6/25/2024
All of the firmware and the PC Host code are written in ANSI C.
Firmware in the remote sensor box is a pretty conventional "bare metal" design. At start up, all the hardware gets configured, then data structures initialized. Once the initialization is done, there is a forever loop at the bottom of main() that watches for a complete input line on the UART buffer and if there is one, go parse and execute that line. Next, the baro sensor data ready interrupt signal on the GPIO bit is checked. If the baro sensor has completed a conversion, fetch that data into a local variable. Similarly, the humidity sensor data is fetched into another local variable. The clock/calendar chip is read to get the time and date. The Tic Counter is checked to see if another sample period has elapsed. If so, update the next_sample variable, copy the measurement data into a FIFO block and write it to the FIFO. If the sample period has not elapsed fall skip the previous steps. This is the bottom of the loop.
The Tic Counter is a uint64_t variable that is incremented in the 1mS Tic interrupt service routine. It's important to note that a uint64_t variable is used here because a uint32_t counter would overflow in about 7 weeks, which would make testing for the period much more complex. The world will be dust before that 64 bit counter overflows.
Both the UART receive and transmit operations are interrupt driven, so the foreground code only needs to check to see if there is a complete line of text in the receive buffer.
Both the baro sensor and the humidity sensor measure temperature. The humidity sensor has 14 bit resolution on the temperature, where the baro sensor only has 12 bit resolution. The system uses the temperature data from the humidity sensor.
Communications with the baro and humidity sensors and the clock/calendar are via I2C. The I2C drivers are not interrupt driven, so they need to get polled to retrieve data before it gets overwritten. All communications on the I2C bus must be initiated by the bus host, so the firmware does not need to poll for data until it starts a transaction.
As mentioned in the hardware section, the clock/calendar chip has some battery backed RAM on it that is accessible via the I2C interface. The remote sensor box uses that RAM to store the values for the barometer compensation altitude, the periodic sample delay value, and the temperature units value.
None of the timing in this system is critical, but the real time clock will accumulate large errors if it's reference clock is not trimmed carefully and temperature compensated. The NXP PCF2127AT chips have an internal oscillator that keeps very accurate time. It is also battery backed so that power glitches will not lose the memory or the time.
The command parser is called by the main loop if a complete command line is found. If a command is received that needs sensor or clock data, that data is read from the hardware by the code in the parser.
All of the hardware has low level device drivers to support initialization, reading and where appropriate, writing. This makes it fairly easy to change out sensors and such. It also makes it much easier to re-use the code for other projects in the future.
Firmware in the Indoor Display Unit is also written as "Bare Metal" code.
A 64 bit interrupt driven Tick Counter is used for timing events in the display unit also. There is no need for real time in the display unit. All timing is relative to the Tick Counter.
Two UARTs are used, one to talk to the remote sensor box and one to talk to the host PC. Both UARTs use interrupt driven code to service them for receive and transmit.
The displays and the ambient light sensor communications are done via I2C.
At startup, all of the hardware gets configured, then data structures and variables get initialized. After the initialization, the forever loop at the bottom of main() gets entered. At the top of the loop, a communications handler function gets called. Next, the ambient light sensor timer gets checked to see if it is time to read it. If so, the sensor is read and the value translated to a "brightness" value and sent to the display boards. Translation between the ambient light sensor output and the "brightness" value is done from an empirically derived lookup table. If it is not time to read the sensor, the code returns to the top of the loop.
The communications handler deals with all traffic in and out of the display unit on both UARTs. It also issues the periodic SHOW_DATA commands to the remote sensor box that are used to update the LED displays. Code is written to fall through until the Tick Counter indicates that is is time to do something. There are only a few short (millisecond level) delays in the code in a few situations.
The display unit has control over the DC power to the remote sensor box. A watchdog tracks requests and responses to the remote sensor box and if too much time elapses between the request and a response, the remote sensor box gets reset by toggling the power off and on. After checking the watchdog status, the communications handler checks to see if it is time to request new data for the LED displays.
There are several flags that get set in the host comm handler sub-function that indicate that the host is using the remote sensor box interface. As long as the host is not using the remote sensor box interface, the display unit will request the new data. If the host is using the interface, it will set the timer to issue the new data request to a later time.
After the new data request stuff is done, the communications handler checks for a line of data from the remote sensor box. If there is a line of data, it gets passed to the target comm handler sub-function to be dealt with.
If the display unit is not using the sensor box interface, the communications handler checks the host receive buffer to see if there are any commands from the host PC. If there is a command, it gets passed to the host comm handler sub-function.
The target comm handler sub-function deals with data from the remote sensor box. There are only a few messages that it needs to deal with explicitly. FIFO data packets get passed directly to the host PC and the watchdog gets disabled since that transaction is done. Responses to the SHOW_DATA command are recognized and if the display box is waiting for that data, it gets parsed and the data displayed. The watchdog also gets disabled and the local_data flag gets cleared. If the display unit is not waiting for the response, it is passed up to the host and the watchdog disabled. All the rest of the messages just get passed on the the host and the host busy flag and watchdog cleared.
The host comm handler sub-function deals with data from the host. All of the data from the host is commands to the remote sensor box. The host command handler needs to recognize the FIFO commands FRQST, FACK and FNAK. It also needs to recognize the SHOW_DATA command. All the rest of the commands just get passed on to the remote sensor box and the host busy flag set when the display unit is not using the interface.
The FRQST command gets passed on to the remote sensor box (target) and the pending_fifo_request flag gets set. The watchdog also gets set to the current Tick Counter value.
The FACK command gets passed to the remote sensor box and the pending_fifo_request flag gets cleared. The watchdog gets disabled.
The FNAK command gets passed to the remote sensor box and the watchdog gets set to the current Tick counter value. The pending_fifo_request flag is left set since the FRQST command has not been filled.
The SHOW_DATA command gets passed to the remote sensor box and the host busy flag set to indicate that the response belongs to the host. The watchdog gets set to the current Tick Timer.
Code for the LED matrix displays was heavily leveraged from my previous LED matrix display projects. These display boards only support one color, so a single ISI31FL3730 driver chip can support 2 characters. The character generator arrays needed tweaking because the chosen displays are 5x7 instead of 5x8, so the descender characters needed fixing. In the low level code that accepts an ASCII character and a character index, routes the character generator values for the even character index values to one matrix and the ones for the odd character index values to the other matrix. This project mostly uses the decimal 0..10 input values but the rest of the printable characters are still supported. Some bit flags were added to control spare, discrete LEDs for stuff like a colon character between other characters or a decimal point below a character. Previous systems that I have done either use a complete display for those special characters or they use a separate "miscellaneous LED control board" that I didn't want to include in this system.
Host PC code
Right now, the host PC code is kind of a skeleton. It is a a command line tool that allows setting the various parameters in the remote sensor box and downloading the FIFO data. FIFO data is stored as a human readable, .csv file. Here are the commands that it supports:
Usage foo [-D serial_port_filename]
[-P outfile_path
[-N outfile_name
[-M] enable monitor mode
[CMD DATE MM:DD:YY HH:MM:SS]
[CMD ALTITUDE 1234.5]
[CMD TSAMPLE SS]
[CMD FCLR]
[CMD NVM_WRT]
[CMD NVM_DEFAULT]
[CMD SHOW_DATE]
[CMD SHOW_DATA]
[CMD SHOW_ALT]
[CMD SHOW_TSAMPLE]
[CMD SHOW_F_C]
Default behavior is to download all the FIFO data into a file that is date stamped for the Sunday of the current week and then exit. CSV files are really easy to parse and can be plotted in a number of ways. I may write a fancier GUI driven program that will plot the data without user intervention, or I may just leave this program and write some post processing tools. Right now, having the data is what I wanted to start with.
The End
I tried a couple of different things from the way that I have done previous writeups. The first thing is adding schematic drawings inline as pictures, rather than just including the .pdf files in the files section. My hope is that it will make it easier to read and follow the schematic with the text. The second thing is to try to do a semi-detailed explanation of the firmware operation. With AI scraping common now, I would rather not post source code. My suspicion is that very few people even looked at the source code files anyway.
Having gotten this far in this writeup, do you think that the inline schematics helped? Was it worth digging through the verbal explanation of the firmware operation? Please leave your thoughts on this in the comments section.
 Bharbour