Kris Winer
-
More on light sensing...
08/06/2017 at 01:43 • 0 comments08/5/17
I ran another test of the SensorTile2 correcting some of the power issues and integer cast issues I had on the last test.
First, I disabled the power-on green led, turned off the microphone, and changed the BLE output rate to once every ten seconds. Even so, the SensorTile2 ran for just 100 hours, so an average power usage of 1.5 mA. This is almost exactly what I estimated I might save (2.1 mA from the last test - ~570 uA estimated savings ~ 1.5 mA) but still this is a little disappointing; I have to remember that the air quality sensor uses ~550 uA all by itself, and outputting BLE every ten seconds instead of every second doesn't seem to drop the power used by the nRF52 (BMD-350) module very much. I used up the 4095 pages of SPI flash for logging after ony ~80 hours. Well, everytime I run one of these tests I learn how to use the device better.
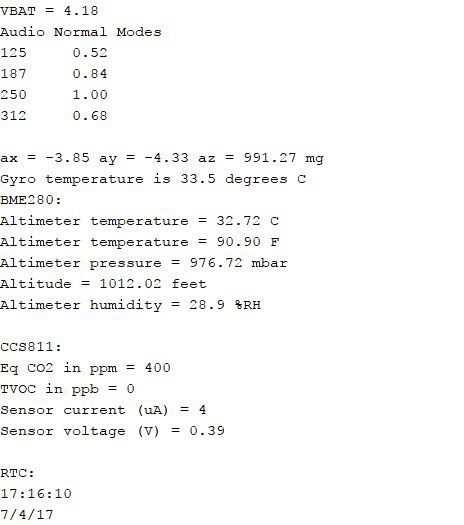
At least I am reliably getting a lot of data over a long enough time to be interesting. All of the initial trouble I was having with lost flash data, incorrect dates and times, etc is gone. Here just a reminder of what kind of data I am getting:
![]() and I am not even including the accelerometer data, which is available in the log, or any audio data which is not. I am still thinking how to use these vibration/sound sensors for environmental logging.
and I am not even including the accelerometer data, which is available in the log, or any audio data which is not. I am still thinking how to use these vibration/sound sensors for environmental logging.What's interesting about the eCO2 data above (SensorTile2 placed just outside my front door again in a covered location) is the changed characteristic of the signal starting at ~6 AM on August 1. The eCO2 level transitions from a subdued 500 +/- 100 ppm level for most of two days to spiking well above 1000 ppm and remaining generally higher thereafter. The transition coincides with a falling pressure (most easily seen with the pressure-derivative altitude rising from 900 to 1000 feet) and a general cooling trend. So the change in the weather seems to be able to affect the pollutant (CO2 and TVOC) levels. Looks like there is a lot that can be learned by correlating disparate data; I need to either add a larger SPI flash for longer data logging or figure out how to get a continuous stream of data for long-term logging. More on this in a minute.
I also fixed the integer cast error I had in analyzing the ambient light sensor (VEML6040) data and now I am getting much more sensible output with no negative light levels! Here is what the data look like:
![]() I am plotting total light received in lux as well as the red, green, and blue components in uW/cm^2. Remember the SensorTile2 was placed in a covered location so these values are quite low compared to the ones I showed in the previous log when the VEML6040 was exposed to the open air and direct sunlight for part of the day. Interestingly, the peak lux drops noticeably on August 1 corresponding to the increase in eCO2 levels, all due presumably, to the change from clear skies to cloud cover.
I am plotting total light received in lux as well as the red, green, and blue components in uW/cm^2. Remember the SensorTile2 was placed in a covered location so these values are quite low compared to the ones I showed in the previous log when the VEML6040 was exposed to the open air and direct sunlight for part of the day. Interestingly, the peak lux drops noticeably on August 1 corresponding to the increase in eCO2 levels, all due presumably, to the change from clear skies to cloud cover. Zooming in we can see the relative components of the ambient light:
![]() Somewhat to my surprise red and green seem to dominate the shadows; I guess this makes sense since all of the light the Sensor Tile2 sees in this covered location is scattered light and red is scattered most (that's why the sky is blue). The small excursion at ~10 PM each day is when the front porch lights are turned on.
Somewhat to my surprise red and green seem to dominate the shadows; I guess this makes sense since all of the light the Sensor Tile2 sees in this covered location is scattered light and red is scattered most (that's why the sky is blue). The small excursion at ~10 PM each day is when the front porch lights are turned on.Since I have a nifty battery monitor on the SensorTile2 and I want to see if I can have a perpetual environmental sensor the next experiment will use a BQ25504 boost converter and a solar cell to run the SensorTile2. I am particularly interested to capture the charging/discharging behavior in a location with only a few hours of sun each day. So I will essentially repeat this experiment using one of these and report results in a week or two.
-
SensorTile2
07/30/2017 at 19:12 • 0 comments07/30/17
Technically, this is SensorTile3 since I changed the original Sensor Tile by replacing the switch and substituting the BMA280 for the MPU6500. But since it was this modified Sensor Tile that was used for initial testing, gathering the first real data and sending that data over the BLE UART bridge as well as starting low power consumption testing, etc I will call the latest incarnation SensorTile2.
SensorTile2 is just like SensorTile1 except I have added two new components. The first is the VEML6040 RGBW ambient light sensor (white arrow) and the second is Maxim's MAX17048 LiPo battery fuel gauge (red arrow). Here is a picture of the SensorTile2:
![]() It's starting to get a little crowded on the pcb!
It's starting to get a little crowded on the pcb!Both of these components use I2C to communicate to the STM32L432 host. The VEML6040 has no interrupt but the MAX17048 does. Unfortunately, I have no GPIOs left. The VEML6040 measures ambient light resolved as red, green, blue and white (total) counts which, with proper scaling, can return R, G, and B light intensity in uW/cm^2 and total lux. The VEML6040 takes ~200 uA of power so I have made use of the embedded enable/disable capability to limit overall power usage.
I tried to extend the battery life in this first SensorTile2 experiment by updating the data sent via BLE every ten seconds instead of every second. I only got 70 hours, or an average power usage of 2.1 mA which is higher than the 1.75 mA I measured in a similar experiment using SensorTile1 with BLE update at 1 Hz. The reasons for this include that facts that I had the VEML6040 reading data at 1 Hz (~200 uA), I forgot to disable the green power-on led (just above the USB connector) which unnecessarily burns ~140 uA, I have the microphone powered on even though I am not really using it (~230 uA), and I am performing FFT analysis on the sound data when available at 1 Hz. I'll repeat the experiment after disabling the power-on led, reading the VEML6040 at 0.1 Hz, and turning off the microphone which should save at least ~570 uA and so I am hoping to finally get the average power at or below 1 mA.
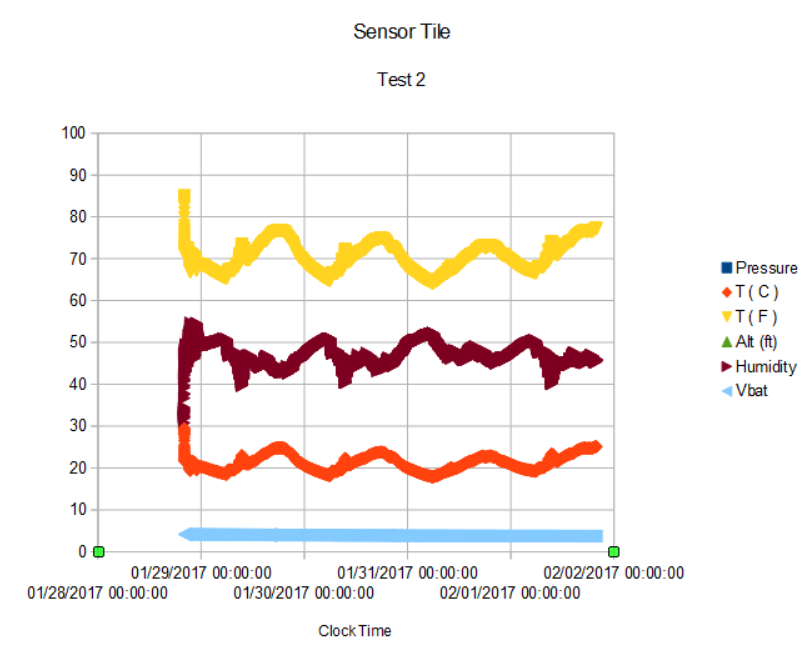
In the meantime, I did get some interesting data with these new components. First the ambient light data:
![]() I am plotting red, green, and blue light intensity as well as temperature in Fahrenheit over the seventy hours of the experiment. Note the date and time (24 hour PDT) are finally correctly recorded. The SensorTile2 was located on a metal bench on the back porch, mostly shielded from direct sun except for a short period twice a day, as can be seen by the spikes in both the light data and the temperature. I think there is a conversion error in the program since I am reading the data as int16_t, which can and does go negative occasionally, but I think this should be uint16_t. One more thing to fix. The initial spike in light coincides with sunrise and the second spike with overhead sun. There is a lot of detail in the shape of the light curves having to do with the particular siting of the sensor wrt the trees and house, etc. Not apparent on this scale but there are subtle changes in relative color components of the light that occur; there is more red at sunrise and sunset, for example, while green and blue dominate during mid-day.
I am plotting red, green, and blue light intensity as well as temperature in Fahrenheit over the seventy hours of the experiment. Note the date and time (24 hour PDT) are finally correctly recorded. The SensorTile2 was located on a metal bench on the back porch, mostly shielded from direct sun except for a short period twice a day, as can be seen by the spikes in both the light data and the temperature. I think there is a conversion error in the program since I am reading the data as int16_t, which can and does go negative occasionally, but I think this should be uint16_t. One more thing to fix. The initial spike in light coincides with sunrise and the second spike with overhead sun. There is a lot of detail in the shape of the light curves having to do with the particular siting of the sensor wrt the trees and house, etc. Not apparent on this scale but there are subtle changes in relative color components of the light that occur; there is more red at sunrise and sunset, for example, while green and blue dominate during mid-day.The battery fuel guage measures battery voltage, state of charge (in percent) and charge/discharge rate. When I first tried it while using the SensorTile2 to charge the 150 mAH LiPo battery, I was surprised that the charge rate was still positive and the state of charge was less than 100% after the red charging light went out. After another hour or so the charge rate dropped to ~1% and the state of charge reached 100% (actually 101% !). The way the fuel cell works is that it has a model of the battery whose parameters are automatically adjusted over a few battery charge/discharge cycles. So I guess I shouldn't expect the model will be correct at first and, indeed, the recorded data show some odd results:
![]() First the state of charge starts at 101% and steadily drops to 0% over the course of the 70 hour experiment. There are slight excursions when the SensorTile2 is exposed to direct sunlight and heats up a bit but otherwise the data are uninteresting at this scale.
First the state of charge starts at 101% and steadily drops to 0% over the course of the 70 hour experiment. There are slight excursions when the SensorTile2 is exposed to direct sunlight and heats up a bit but otherwise the data are uninteresting at this scale. Zooming in to the last 24 hours is more interesting:
![]() The battery voltage is steadily declining reaching ~3.54 V at about the same time the charge remaining reported by the MAX17048 reaches zero! The device was happliy reading data and sending data via BLE up to the time I pulled the plug at 70 hours so I have to conclude the MAX17048 isn't yet properly calibrated to this particular battery. Once calibrated, however, good practice would be to program the SensorTile2 to shutdown once the battery charge reached 2% just to avoid excessive discharge of the battery that could limit its useful life. if I did that now, I would be losing ~4 hours or ~6% of the available run time.
The battery voltage is steadily declining reaching ~3.54 V at about the same time the charge remaining reported by the MAX17048 reaches zero! The device was happliy reading data and sending data via BLE up to the time I pulled the plug at 70 hours so I have to conclude the MAX17048 isn't yet properly calibrated to this particular battery. Once calibrated, however, good practice would be to program the SensorTile2 to shutdown once the battery charge reached 2% just to avoid excessive discharge of the battery that could limit its useful life. if I did that now, I would be losing ~4 hours or ~6% of the available run time.Ultra-low power management is not easy....
-
Upgrading BMD-350 Firmware, Hot Swapping AT Mode
07/19/2017 at 03:03 • 0 comments07/18/2017
The BMD-350 comes loaded with firmware that creates a BLE UART bridge such that simply writing Serial2.print (the BMD-350 is on the STM32L432 host's Serial 2 port) in the host's Arduino sketch sends anything one would normally write to an IDE serial monitor to the UART console in the Rigado Toolbox app on the smart device (iPhone in my case). This is convenient for checking on current conditions or proper sensor operation during a logging session, for example. And the BMD-350 UART configuration (baud rate, TX power, etc) can be changed on the fly using the Rigado Toolbox app.
The way the BMD-350 is configured in the host sketch is by entering AT Command mode, passing some configuration statements via Serial2.write, and then entering UART bridge mode for normal functioning. In order to enter AT Command mode one has to 1) hold the AT Mode pin on the BMD-350 module LOW, 2) then hold and release BMD-350 Reset LOW to reset the module. Of course, these pins are connected to STM32L432 GPIOs for this purpose. When the module powers on it senses the AT Mode pin and if it is LOW, the module enters AT Command mode. After the commands have been entered, the reverse process puts the BMD-350 back into UART bridge mode for normal operation. All of this takes a bit of time (~seconds), but for a one-time initial configuration (i.e., in setup) this is fine.
Rigado has impemented a hot swap AT mode such that if the hot swap is enabled during the BMD-350 initialization, then simply holding the AT Mode pin LOW during the running of the sketch will put the BMD-350 in AT mode and the configuration can be changed "on the fly" in the same way the configuration can be changed from the Rigado Toolbox app on the smart phone. Resetting the AT Mode pin HIGH returns the BMD-350 to BLE UART bridge mode. This is very convenient. More on this in a moment...
I upgraded the firmware on the BMD-350 nRF52 BLE module on the Sensor Tile since I wanted to be able to use the hot swap capability just added to the new protocol 3 firmware; the BMD-350 came with protocol 2 from the factory. After some initial fussing and after I finally decided to actually follow the directions on the Rigado website I succeeded in getting the firmware update to work. The update process was accomplished via OTA from the iPhone and required e-mailing myself three separate .bin files, a bootloader, the S132 soft device and the new BMDware (firmware). For each file I used the Rigado toolbox firmware upgrade tool to load the corresponding .bin file and after a few false starts got everything properly loaded. In order to make my Sensor Tile work again with the new firmware I had to "restart" bluetooth on my iPhone, meaning I had to disable and re-enable it in Settings for the changes to "take". Don't ask me why, it all finally worked so---no harm no foul!
Now the initial idea for my interest in hot swapping was so I could set the Tx power to the lowest setting, as I have been doing, but just before a Serial2.write I would bump up the Tx power to 11 or at least a higher-than-minimum value to temporarily increase the range. Then after the message was sent, bump it back down to the minimum to save power. Nice idea, but it takes time to effect the mode changes even without having to reset the module twice. For data update rates of ~1 Hz like I am using on the Sensor Tile this is simply not practical. The reason is that it takes ~100 ms or so each direction. So my idea of using hot swapping as a power saving strategy isn't going to work.
But there is another potential application of hot swapping that might.
Turns out BLE, despite the hype about BLE 5.0, is often best as a near-field protocol. Meaning for a lot of applications, people choose BLE because it requires a lot less power than wifi. The lowest power is achieved with the lowest Tx power settings, meaning using the BLE as a near-field communication protocol for when someone brings a smartphone close, say within a few feet, is where the optimum power efficiency is achieved. For longer range, we really want something like LoRaWAN when power efficiency is critical. Best practice is both near- and far-field connectivity using BLE + wifi, like on and ESP32 or a Raspberry Pi W Zero, or BLE + LoRaWAN (we're working on this one), etc. With the Sensor Tile, all we have is the one radio.
But the Sensor Tile can smell and hear. So wouldn't it be interesting if the BLE range could be increased on alert to, say, 40 meters or so. This could occur when voices are detected in an area where there should be none, or when CO2 levels breach a threshold, etc. The idea is, for most of the time, the Sensor Tile is in its lowest power state sniffing and listening. Interactions with its minders can be in the near-field, such as when a maintenance tech stops by to make sure everything is still running. But when the Sensor Tile detects an alert condition, it lets out a yell by cranking the Tx power to 11 to be sure its alert is heard in the front office.
Now one doesn't need a hot swap capability to do this since what's the difference if the alert happens right away or after a few seconds delay? Well, the host program has to be interrupted during this transition and thereby miss some important information. There could be multiple alert conditions that might get lost if the mode transition takes a long time. Lastly, the Sensor Tile might spend more time at the higher-power alert condition than necessary, reducing life in the field.
Are there applications where a power-efficient, short-time-to-alert capability might be useful?
-
Sensor Tile Ears to Add to the Nose
07/16/2017 at 22:52 • 0 comments07/16/2017
I finally got around to playing with the ICS43434 I2S digital microphone on the Sensor Tile. I used the I2S library that is part of the STM32L4 Arduino core and Sandeep Mistry's Arduino Sound library for the FFT analysis. Both are very easy to use. But for some reason the I2S mic did not play well with the SPIFlash.h class I created. Both work well without the other and the SPIFlash class works well all of the time but there is some conflict I haven't yet discovered so in order to make some progress, I just regressed to having the SPIFlash functions in the main code. Now all is well.
I am reading the microphone data at 8000 samples per second, rather low for CD-quality music but perfectly fine for voices and machine chatter, etc. I capture 128 sound samples, perform an FFT and then normalize the spectrum and output only those frequencies that are 50% or higher of the maximum intensity of 64 frequencies in the spectrum. So if there is nothing but low ambient sound, nothing is output onto the serial monitor. If I speak, then a handful of frequencies appear. I am only plotting the few major modes once a second just to get a feel for what the data might look like.
Here is an example of the output on the serial monitor:
![]()
This from me holding some more or less constant tone voice sound. Apparently the sound has a dominant frequency of ~250 Hz. It is interesting to see the normal modes, and it would be easy to use this capability to detect clapping, for example, or detect when someone was speaking. But I can see already that I will want to capture complete time series of the data for speech recognition. How cool would it be if the Sensor Tile could recognize and respond to the key words "Open the pod bay door HAL" or "Soylent Green is people"!
I managed to send these dominant normal modes to the iPhone via BLE so when I speak I can see the response on the UART console. I had been converting the floats to strings using dtosrtf and assembling into a packet for transmission via serial and the BLE UART bridge using sprintf but I finally realized all I need to do is a Serial2.print to send the data to the iPhone serial console! Not sure why I started with the string packaging. Not necessary in Arduino.
If I hum a constant note (as well as I can anyway) I see one or two dominant frequencies at 250 Hz or 300 Hz or whatever note I can hold (see above). I checked with a metronome tone generator set for 440 Hz and I see 437 Hz with a small side band at 500 hz. I think the way I have the FFT set up the frequency resolution is only 62.5 Hz (8000 Hz sample rate divided by 128 FFT size) so I am not discriminating very finely yet. For normal voice recognition I should probably set the sample rate to 2000 or 4000 Hz or so. Or I can increase the FFT size to 256 or 512 to get better frequency resolution, but at the cost in compute power. The STM32L432 has a Cortex M4F processor and the floating point engine is not really taxed at these kinds of rates. Not sure where the limit is though.
The bigger problem is the flash memory required to hold the FFT code. The full sketch is 214 kB of which ~175 kB is the FFT package alone; this is getting close to the ~245 kB flash memory limit on the STM32L432. I think there are a lot of lookup tables and what not driving this load and I would like to find some lighter implementation of the FFT analyzer, but as far as I can tell everyone uses this CMSIS FFT package.
The point of all this is that all of the sensors including the I2S microphone now work and work together with a lot of the relevant data being sent to the smartphone via BLE.
The smartphone is convenient as a check but I want to start using the nRF52 in central role as a point-to-point gateway so I can get the data onto the Arduino IDE serial monitor running on the laptop. I am having the nRF52 add-on I designed for the Butterfly produced in China and I expect to start using this to monitor several of these Sensor Tiles at once for real-time data analysis. This is more fully described here.
The hard part now is to start applying the Sensor Tile(s) to solve some real world problems...
-
Sensor Tile as an air quality sensor
07/09/2017 at 01:49 • 1 comment07/08/17
The latest experiment was a partial success. I essentially repeated the last experiment but placed the Sensor Tile outside the house, near the threshold on a portico support pillar out of the sun. Disappointingly, the first several hours of data recorded on the SPI flash were all zeroes, so something is going wrong in the packet construction. I will have to sort this out. I got 53 hours of actual data when I should have gotten ~80.
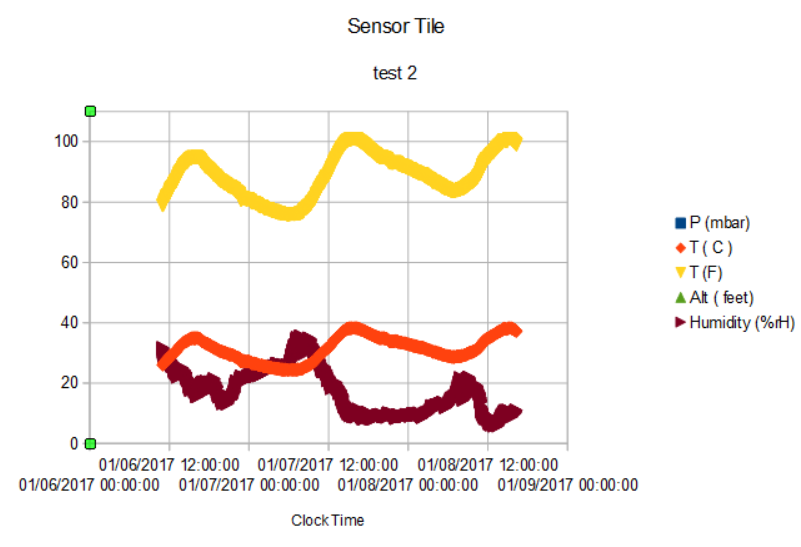
This time I recorded the equivalent CO2 (eCO2) and total volatile organics (TVOC) from the CCS811 measured at 60 second intervals, as well as the usual pressure, humidity, temperature, etc. The temperature data look familiar:
![]()
showing peaks at ~2 pm and troughs at ~4 am every day (again, this should be July not January! I have to find and fix this problem too).
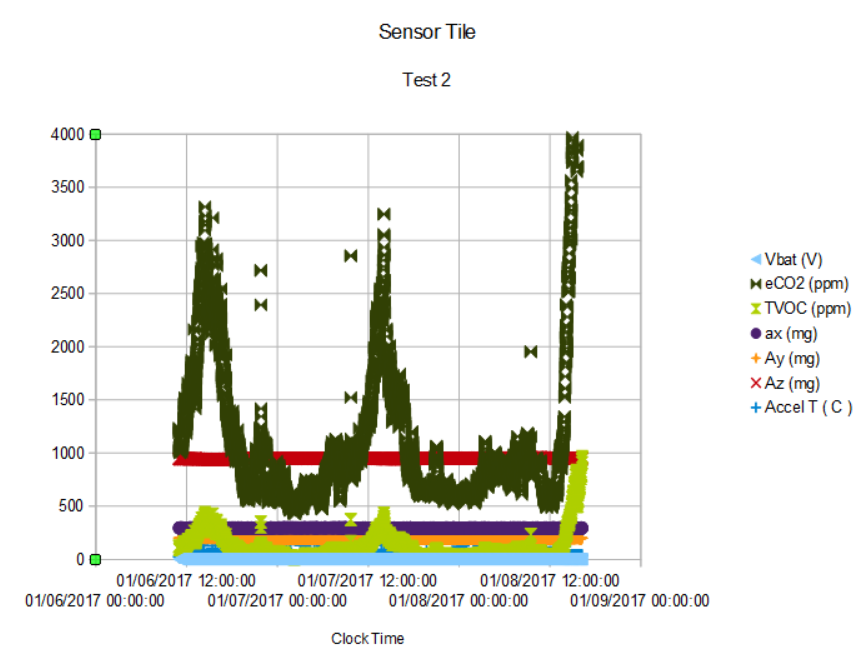
The eCO2 and TVOC data are interesting:
![]()
The eCO2 and TVOC levels shows a lot more sensitivity than I would have expected. Since I am compensating the CCS811 resistance measurement with current temperature and humidity data I am wondering if the large variation in eCO2 and TVOC levels is an artifact of the underlying variations of these instead. Although it makes intuitive sense that pollutants in the air would be maximum 1) in the middle of the day when people and machines are maximally active, and 2) that the volatiles and pollutants would be maximum at the hottest part of the day since this would be the condition for maximum outgassing of rotting vegetation, etc. I think the shorter duration excursions at ~10 pm and ~10 am are due to our old car arriving for the night or leaving in the morning, respectively. The Sensor Tile is close to where we park our cars.
I recorded all data at 10 second intervals but the CCS811 has a new measurement only once every sixty seconds. Yet, this was enough to capture the relatively rapid change in the eCO2 and TVOC levels. I probably do not need to measure the temperature, humidity, and pressure at 10 second intervals so I might reduce the data logging interval to sixty seconds generally since SPI flash writes use up some power. Also, with eight 32-byte samples per page and 4096 pages, there is a lot of data (even when half of it is lost) and Open Office is having trouble crunching all of it.
Astute observers will note that I have recorded the components of acceleration as well. These were pretty boring in general. I need to configure the accel with a high-pass filter and then interrupt on significant motion to see if I can capture vibrations above ambient. I have the second interrupt already configured as a tap detector. With the high-pass filter I should be able to analyze any high-frequency acceleration data with a FFT to extract normal modes. This is an outline for an earthquake detector when logging environmental data as in this experiment, or as a diagnostic for equipment faults in an industrial application.
Lot's to do yet...
-
Sensor Tile Update-Power measurements and data logging
07/04/2017 at 20:55 • 0 comments07/04/2017
I ran my first really successful test of the logging features of the Sensor Tile in the last few days and collected some interesting power efficiency information.
Firstly, I just ran the Sensor Tile with no attempt to manage the power usage. I was collecting data from the CCS811 air quality sensor (one of two big power users on the board) at 10 second intervals, with the BMD-350 nRF52 module (the other big power user on the board) operating with its defaults and sending data via BLE also every 10 seconds. In all of these experiments, I was simultaneously logging data to the 1 Mbyte SPI flash, although it took me a while to get this right. The result of the first experiment was a total run time of 31.5 hours on a 150 mAH LiPo battery; just under 4.8 mA average power usage. Not really great. Furthermore, I made several errors in setting up the SPI flash logging and ended up in these first few experiments with all zeros or a completely erased flash. But I finally figured this out too.
I was able to configure the TX power of the BMD-350 to its lowest power level (-30 dB from the -4 dB default) and maxed out the advertising interval to 2.5 s (from the 1.285 s default). These are the lowest power setting of the BMD-350 module when advertising BLE data to a central (my iPhone).
There is a way to enable hot swapping of the AT mode where these parameters can be set without resetting the BMD-350 module. This is useful for keeping the power minimized except when data has been packaged for transmission, when the TX power would be set to maximum (or at least a higher value than -30 dB), the data sent, the serial buffer cleared (TX complete) and then the power could again be minimized until the next data package was ready for transmission. This is the righter way to do things, but the firmware currently on my BMD-350 (Protocol 2) doesn't support this feature. Fortunately, it is straightforward to upgrade the firmware via OTA, I just haven't gotten around to doing so yet. So in these experiments, I simply kept the TX power (which affects the reception range) and advertising interval (how long one has to wait when pairing with the iPhone) at their low power limits. Even so I had no trouble reading the BLE data whenever I wanted within 10 feet of the Sensor Tile, which is good enough for these experiments.
The next thing I tried was some basic power management. I decreased the duty cycle of the CCS811 air quality sensor to once every 60 seconds, put the BMA280 in low-power mode (not really a big player in power consumption anyway) with a 50 ms sleep interval (effectively a sample rate of 20 Hz) and with the BMD-350 in its lowest power mode I asked for BLE data at 1 Hz and again attempted to capture all of the data on the SPI flash. In the end, I got all zeroes again on the flash but managed to get streaming BLE at least for 90 hours on a 150 mAH LiPo battery for an average power usage of just under 1.8 mA. This is a significant improvement in power usage!
The CCS811 is really quite a power hog, supposedly requiring 7 mW (~2.1 mA @ 3.3 V) at the 10 second per sample setting and 1.2 mW (360 uA @ 3.3 V) of power at the 60 second per sample setting per the data sheet. I wanted to figure out how much the CCS811 is really costing me. So I put the CCS811 in idle mode (where it presumably takes ~10 uA) and essentially just repeated the last experiment. To my pleasant surprise the Sensor Tile lasted at least 120 hours (having died sometime between midnight and 9 AM) for an average power usage without the CCS811 of < 1.25 mA. So running the CCS811 once per 60 seconds is actually costing >550 uA, a bit more that the data sheet (which in fairness is spec'd at 1.8 V and I am at 3.3V).
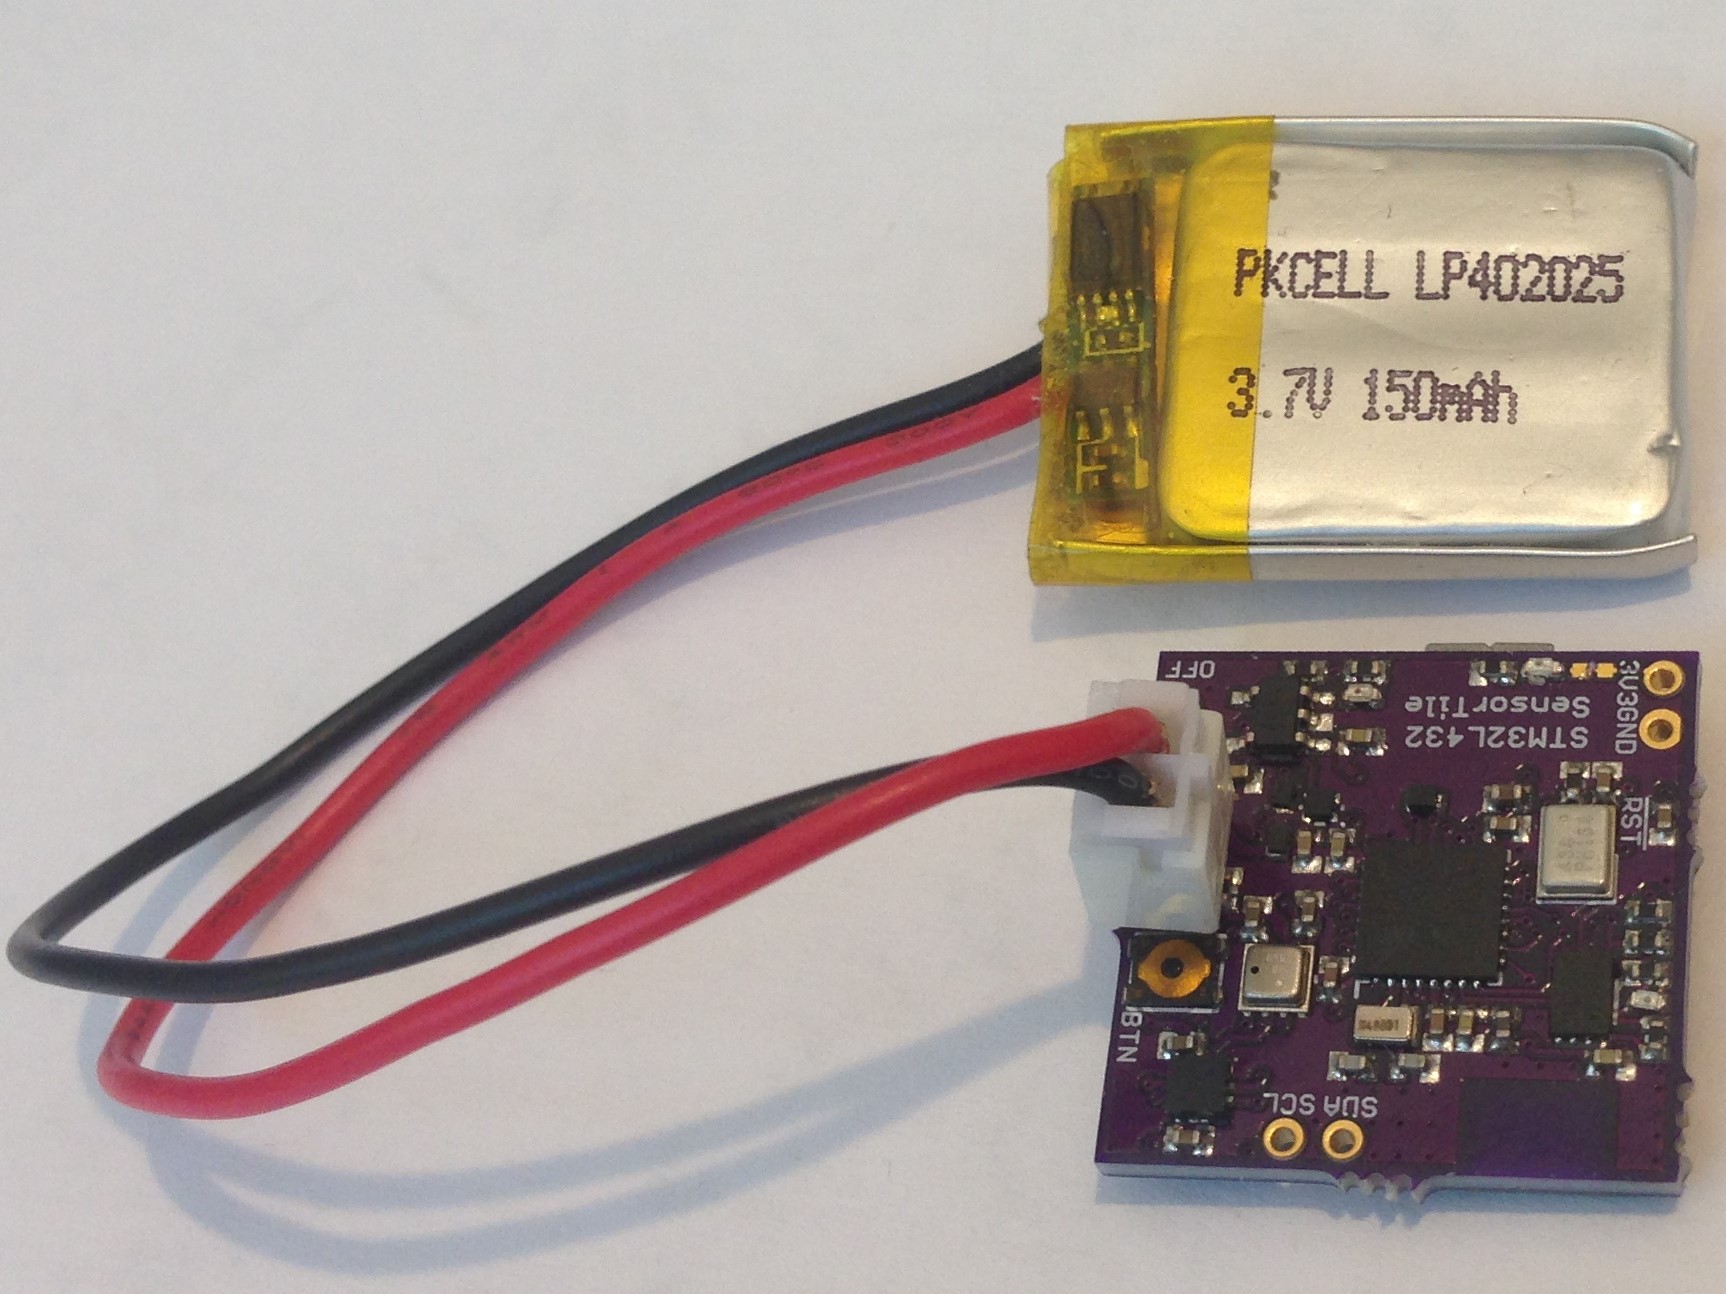
Even better, I got almost exactly 96 hours of sensor data recorded every ten seconds on the SPI flash for later analysis. I discovered yet one more error in that I had set the maximum number of pages to 0x0EFF instead of the 0X0FFF it should have been for the 4096, 256-byte pages of the 8 Mbit SPI NOR flash on the board. So I lost the last 256 pages of logging data or about 5 hours worth. Also, for some reason, the RTC month was not initialized properly so the date I recorded is January/February and not June/July! Oh well...What this result means is that the 150 mAH battery is well matched to the SPI flash capacity and power usage of the Sensor Tile. For logging purposes there is no sense in having the device last longer than the available logging capacity. Of course I can always adjust the data logging interval to some other value than 0.1 Hz and I can use a bigger battery, etc. But the 150 mAH battery is convenient, being almost exactly the same areal size as the Sensor tile, so the pair make a nice compact package.
![]()
So I am finally in range of the ultimate goal, having a practical, compact environmental data logger that can last for four or five days and that I can periodically query with my smartphone.
Here is some of the data I was able to collect:
![]()
![]()
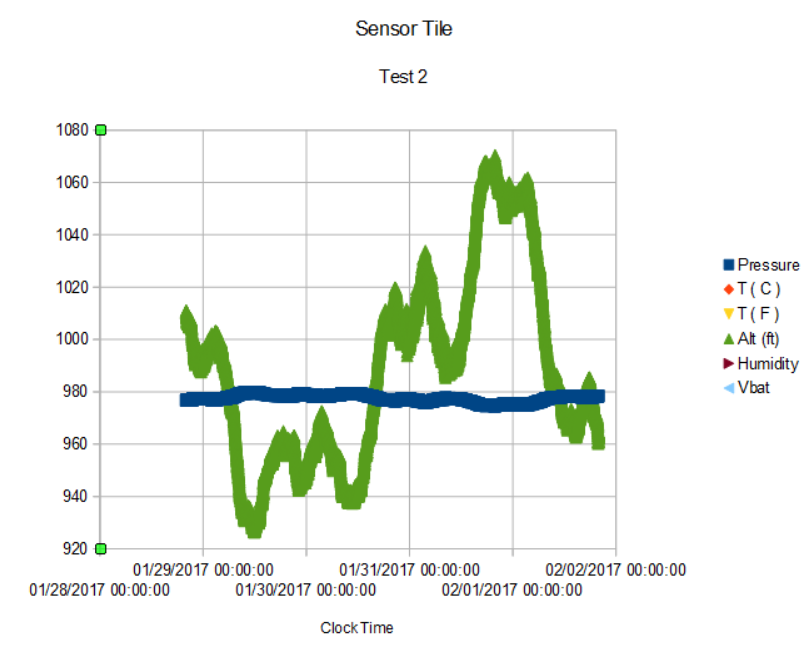
I haven't spent a lot of time analyzing this particular data since the environment of sitting on my window sill next to my work station isn't very interesting. But it is easy to see the diurnal variations of temperature and humidity (what is that blip at ~10 AM every day?!), pressure variations are muted on this scale but the pressure-derived altitude estimation (my house is at 1050 feet elevation) shows a lot of interesting structure. Interesting also is the battery voltage monitored via a resistor divider on an STM32L432 ADC pin which shows the battery voltage steadily decreasing but in a non-linear fashion from 4.2 to ~3.7. Anyway, I expect the data from a well-chosen spot outside the house will prove to be more interesting.
I need to upgrade the BMD-350 firmware to enable a wider range of the BLE, especially if I am going to start truly remote sensing experiments. Plus I redesigned the Sensor Tile again to add a VEML6040 RGBW ambient light sensor and a MAX17048 LiPo battery fuel gauge. Ambient light sensing provides a lot of interesting data, especially outside, and doesn't cost too much more power. And I want just a little more information about the battery behavior than I am getting from the voltage-divider measurement of battery voltage.
These improvements will take some time to get working, in the mean time I think I will repeat this experiment with the Sensor Tile placed in the garden or on the back deck....
-
First revision of the Sensor Tile
06/18/2017 at 06:33 • 0 comments06/16/2017
I redesigned the Sensor Tile slightly replacing the power switch with a smaller ALPS SSAJ110100 switch, replacing the 3 mm x 3 mm MPU6500 with a 2mm x 2 mm BMA280 accelerometer but otherwise it's still the same concept. The accelerometer change is to reduce the cost and improve the performance. The BMA280 has two multiply-configurable interrupts, is much lower power than the MPU6500 (I never really had a use for the gyro anyway) and offers a rich variety of interrupt configurations (single and double tap, pan, tilt, portrait and landscape detection), as well as a high-pass and low pass filter. It is much more versatlie than the MPU6500 and a better choice for a low-power wearable device.
The goals of the project remain the same. And I expect the BMA280 will make achieving them a little easier since I can run the accelerometer at 2 kHz (unfiltered) which means I can detect vibration and sound up to 1 kHz or so. This nicely complements the ICS43434 I2S digital microphone (50 - 20,000 Hz).
While the board has been slightly modified, I finally got around to learning how to construct "proper" C++ libraries and rewrote the single, integrated Arduino sketch I started with into a series of individual sensor libraries (with .h and .cpp files) and now I am able to control the I2C sensors with proper constructors resulting in a slimmer main code (still ~400 lines) that is a little easier to manage. Here is the library.
I am using interrupts wherever possible (BMA280, CCS811, and RTC) but for the devices that have no interrupt (ICS43434 and BME280) I am using the RTC alarm to interrupt in order to set the duty cycle for reading and reporting data, either to the serial monitor or to the smartphone via the UART bridge provided by the BMD-350 (nRF52) BLE module.
I still need to figure out how to efficiently transfer the data via BLE so I can run the Sensor Tile at the lowest CPU clock speeds (~1 MHz) and use the lowest power mode (STM32.stop between interrupts) to cut the average power usage down as low as possible while still getting useful data via BLE to a laptop.
To this end I have designed an nRF52 add-on for the Butterfly (STM32L433 development board, sister to the STM32L432 used as host MCU for the Sensor Tile) that will allow the nRF52 to operate in central role and pass data to the Butterfly via its own UART bridge and then on to the laptop via the USB cable. Thus I expect to have a wireless Sensor Tile spewing lots of data wirelessly to the laptop for capture and analysis.
Still a lot to do but the path is getting clearer and I see no showstoppers along the way to prevent eventual success.
-
Update for March 9, 2017
03/10/2017 at 05:04 • 0 commentsI finally got back to this project and made some progress today on several fronts.
First on the anomalous I2C address of the CCS811, which occasionally shows 0x5B even though I connected the ADO pad to GND in the design. I discovered that since this pad is connected to the large ground pad in the center of the CCS811 that the solder will wick away from the ADO pad during assembly and result in no contact between the address pad and GND, and a subsequent setting of the I2C address to 0x5B which seems to be the default. That is, the pad is pulled up by default. The solution is to butter this pad with solder paste either before (best) or after assembly (what I did) to ensure good contact. This kind of thing is a common problem with LGA packages, as I have learned the hard way on the LSM303D.
Secondly, I was getting weird results from the CCS811. I got CO2 levels way above what should have been the maximum range and the VOC always showed 144 ppb. Well, it turns out I had the register indices reversed, and now I am getting ~400 ppm CO2 and ~10 ppb VoC, unless I breathe on the Sensor Tile, and then these values go up in a pleasingly responsive way-- I have a bad breath detector!
Lastly, I took advantage of the BLE modules I finally received and assembled and started to set up broadcast of the data to the Rigado toolbox. So far I have battery voltage, BME280 pressure and humidity being written to the UART console on my iPhone every second via BLE and the BMD-350 UART bridge. It is not elegant but for the first step in a remote environmental sensor it will do.
Next step is to package all of the relevant data into a data packet and send the packet every 20 - 50 ms to the laptop, where the packet sniffer Wireshark will allow me to grab it for parsing and display. Packaging pressure, humidity, temperature, acceleration (or vibration), CO2 and VOC along with time and date will need a packet of about 60 bytes or so, small enough for BLE to handle. But there is an I2S microphone on the Sensor Tile and apart from analyzing normal modes via FFT and passing these along with the data packet, it will take some more thought to allow sound recording to be sent via BLE. There is a 1 MByte SPI flash on the board so I could simply record the I2S data from the microphone and then send it periodically in a dedicated bit stream via BLE. Preferable would be real time voice/sound transmission, but this might require wifi, as in the ESP8285, to be practical. There are a lot of possibilities in this sector, and the least mature aspect of the Sensor Tile.
The Sensor Tile is sort of a combination Start Trek Tricorder and Communicator rolled into one, but it will take me a bit longer and a lot more work to get the most utility out of it.
-
Added Rigado BMD-350 BLE module
02/26/2017 at 04:24 • 0 commentsFebruary 25, 2017-Finally got a hold of some of the Rigado BMD-350 nRF52 BLE modules; Digikey finally had some in stock so I bought 100 for prototyping, etc. Soldering them onto the board was a piece of cake. They are very small, and the pcb that supports the module is quite thin, I think 0.5-mm.
I had written a program last year when I got a couple of samples from Rigado to test the functionality of the UART bridge. The Arduino sketch (run on the STM32L432 on the Sensor Tile) instantiates two serial ports, one between the STM32L432 and the BMD-350 and one between the STM32L432 and the laptop through the USB cable.
The program starts by putting the module into AT command mode. There I check the module, bootloader, and firmware version numbers set the baud rate, query and/or set various parameters like flow control, parity and whatever else I need to configure the UART bridge parameters. Then the program puts the module back into UART bridge mode and the program waits for valid data to be sent from the laptop console, which is then sent on to a UART console running from Rigado's toolbox on my iPhone as a UART console app. Whatever I type in the UART console on the iPhone app shows up after some delay on the laptop and vice versa.
The speed of the transmission is surprisingly slow. The top speed I expect per Rigado's data sheet is 1 kByte/s, appallingly slow compared to wifi, for example. But the words that appear on either console take a second or two to spell themselves out so the rate seems even slower than this.
Next to do is to package the sensor data and have it sent by the program to the console. I think I am going to have to figure out how to write iOS apps if I want to have a custom interface to accept my Sensor Tile data. Well, at least all of the hardware is working as it should!
-
February 14, 2017
02/15/2017 at 05:14 • 0 commentsI received an application note from AMS on how to interface with and program the CCS811 Air Quality sensor and discovered the missing bit of information, which was I needed to write to the application ready register to take the CCS811 out of boot mode (into which it enters on power up) and into application mode. Once I did this I stopped getting I2C read and write errors and started getting data as well as a data ready bit in the status register. I got the interrupt working as well as the humidity and temperature compensation from the BME280 sensor to improve CCS811 accuracy. Over all the sensor seems to be working as designed. I need to let it stay on for a while to "burn in" before I can get reliable readings, but overall the initial phase of the sensor tile is a success. All sensors on board are functioning and returning data.
I measured the current used by the Sensor tile with no great effort to minimize power usage yet and found that when the BME280 and MPU6500 are running normally as well as having the STM32L4 host run at 80 MHz the current is about 6.25 mA, more or less what I expect. However, when the CCS811 air quality sensor is enabled once every 10 seconds in the present operating mode the current jumps to about 25 mA. If it takes ~1 second to get the air quality data, this is an additional ~25/10 ~ 2.5 mA for a total of almost 9 mA average current. Way too high to be practical as a remote sensing device. So as I work towards lowering the average power used by this device I will have to pay close attention to how long I enable the CCS811. In the application note there is an example of enabling it just long enough to read I2C data, but I think the best method is to take advantage of the rather long duty cycle (once per 60 second measurement) available and interrupt on threshold capability to save power.
STM32L4 Sensor Tile
Small, connected device for smelling and hearing in any environment.
 and I am not even including the accelerometer data, which is available in the log, or any audio data which is not. I am still thinking how to use these vibration/sound sensors for environmental logging.
 I am plotting total light received in lux as well as the red, green, and blue components in uW/cm^2. Remember the SensorTile2 was placed in a covered location so these values are quite low compared to the ones I showed in the previous log when the VEML6040 was exposed to the open air and direct sunlight for part of the day. Interestingly, the peak lux drops noticeably on August 1 corresponding to the increase in eCO2 levels, all due presumably, to the change from clear skies to cloud cover.
 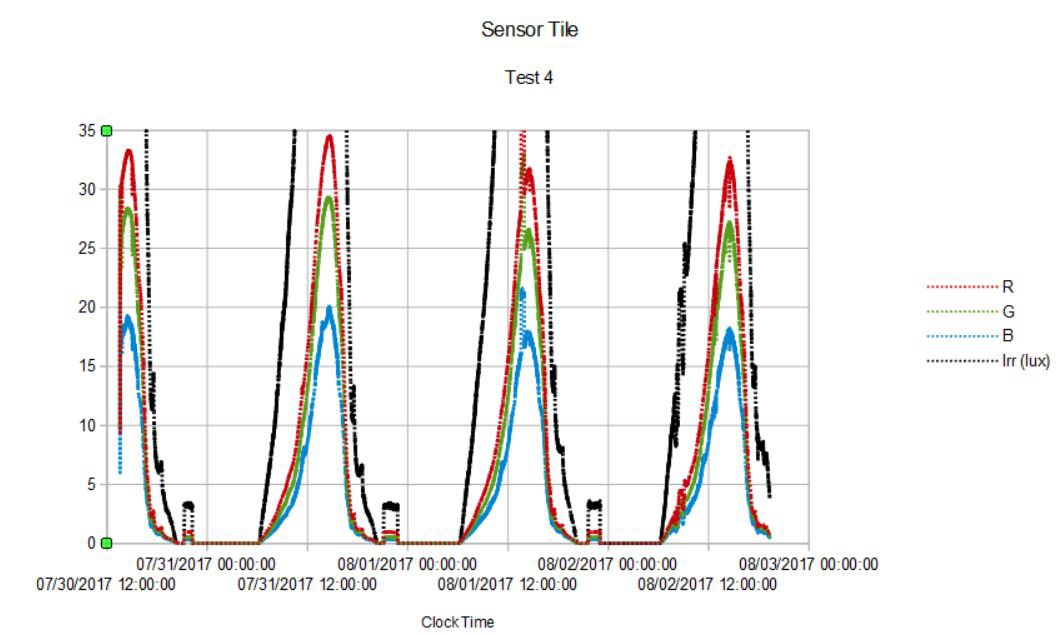 Somewhat to my surprise red and green seem to dominate the shadows; I guess this makes sense since all of the light the Sensor Tile2 sees in this covered location is scattered light and red is scattered most (that's why the sky is blue). The small excursion at ~10 PM each day is when the front porch lights are turned on.
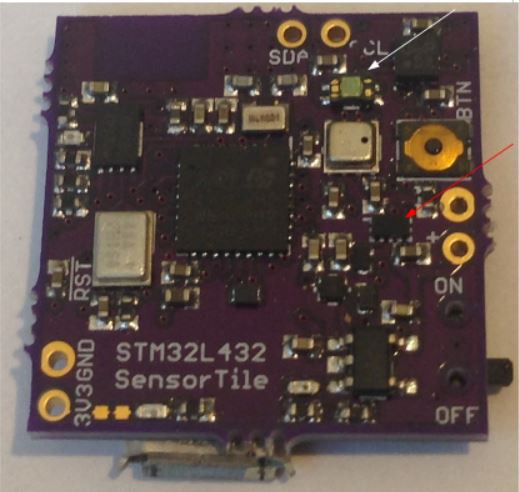 It's starting to get a little crowded on the pcb!
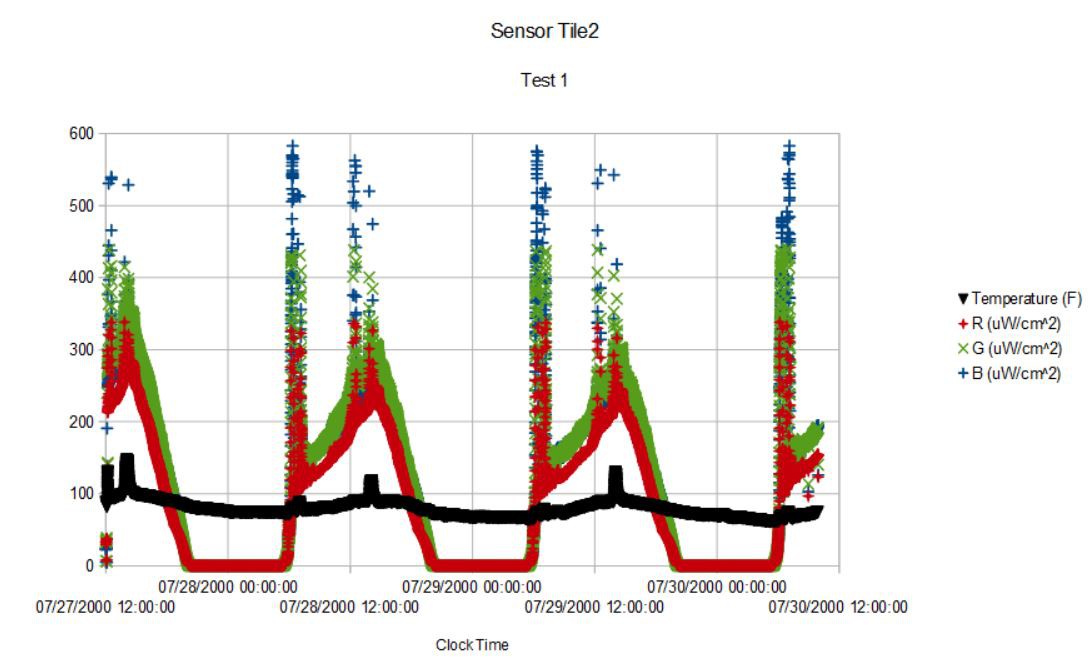 I am plotting red, green, and blue light intensity as well as temperature in Fahrenheit over the seventy hours of the experiment. Note the date and time (24 hour PDT) are finally correctly recorded. The SensorTile2 was located on a metal bench on the back porch, mostly shielded from direct sun except for a short period twice a day, as can be seen by the spikes in both the light data and the temperature. I think there is a conversion error in the program since I am reading the data as int16_t, which can and does go negative occasionally, but I think this should be uint16_t. One more thing to fix. The initial spike in light coincides with sunrise and the second spike with overhead sun. There is a lot of detail in the shape of the light curves having to do with the particular siting of the sensor wrt the trees and house, etc. Not apparent on this scale but there are subtle changes in relative color components of the light that occur; there is more red at sunrise and sunset, for example, while green and blue dominate during mid-day.
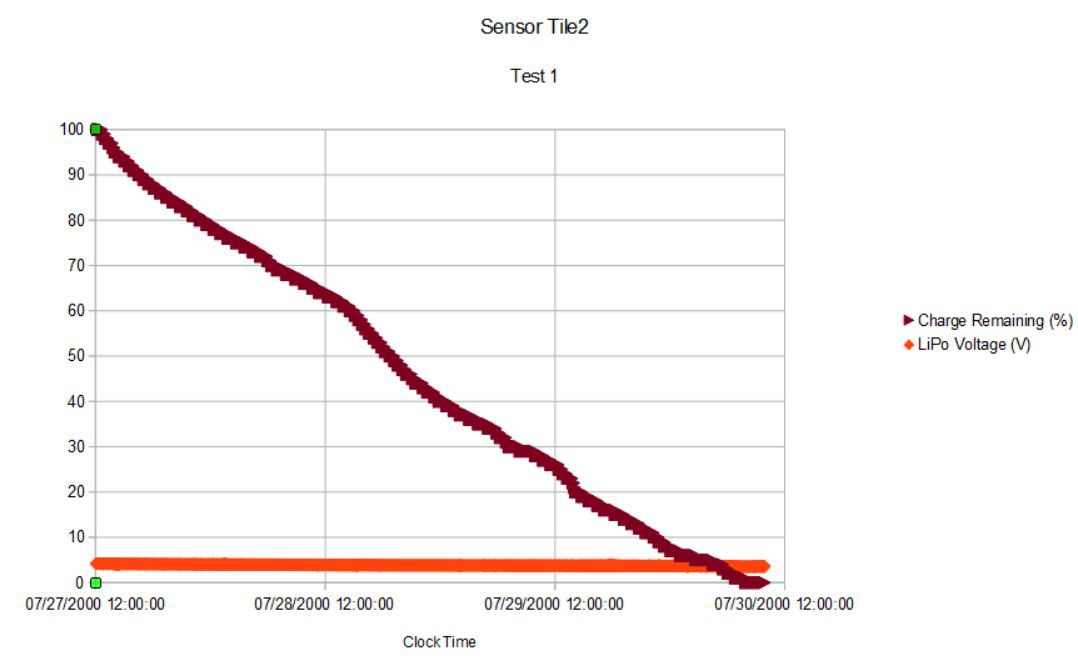 First the state of charge starts at 101% and steadily drops to 0% over the course of the 70 hour experiment. There are slight excursions when the SensorTile2 is exposed to direct sunlight and heats up a bit but otherwise the data are uninteresting at this scale.
 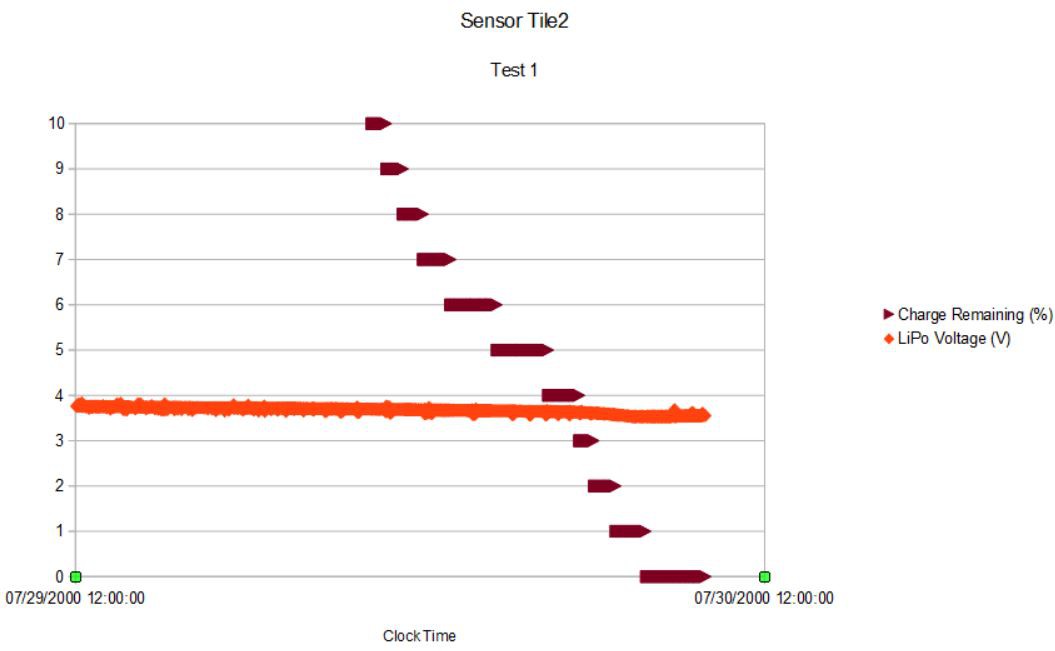 The battery voltage is steadily declining reaching ~3.54 V at about the same time the charge remaining reported by the MAX17048 reaches zero! The device was happliy reading data and sending data via BLE up to the time I pulled the plug at 70 hours so I have to conclude the MAX17048 isn't yet properly calibrated to this particular battery. Once calibrated, however, good practice would be to program the SensorTile2 to shutdown once the battery charge reached 2% just to avoid excessive discharge of the battery that could limit its useful life. if I did that now, I would be losing ~4 hours or ~6% of the available run time.