 Jesse Farrell
Its summer again, so the priority of this project has once again been bumped to the top of my list. Funnily enough the prototype project started just last week one year ago… in my defense though I was busy last weekend, if not for that maybe I would have done my first revisit post EXACTLY one year later.
I fell deep into a power budget rabbit hole this weekend...
I’ve been interested in hybrid capacitor technologies for some time now, and this project presented a perfect opportunity to evaluate one on paper: the Lithium-Ion Capacitor (LiC). Compared to conventional lithium polymer batteries, LiCs offer some intriguing benefits. However, their primary drawback is energy density, which is lower than that of a lead-acid battery.
My goal in this post is to investigate the feasibility of using a LiC for energy storage in this project.
Modeling the System
To evaluate whether the lower energy density, and therefore reduced capacity, of a Li-Ion capacitor is feasible for my application, I needed to model the stored energy in the system over a full 24-hour cycle.
The model had to be detailed enough to capture subtle droops in stored energy. This allows me to then assess voltage margins ensuring that the system remains operational throughout the day. In particular, I’m focused on tracking the minimum voltage across the energy storage element.
Solar Subsystem
Irradiance Waveform
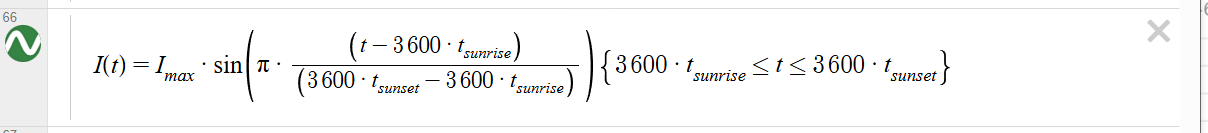
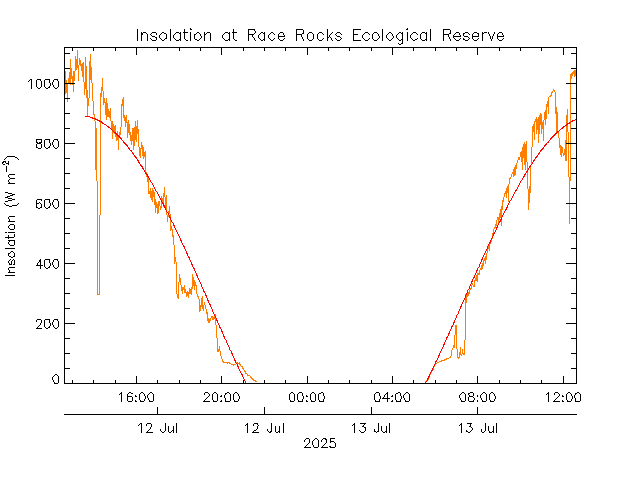
To begin modeling the solar input, I approximated the irradiance over a 24-hour period using I(t). Using a sunrise at 7 AM, sunset at 5 PM, and a peak irradiance of 800 W/m², resulting in the below plot…
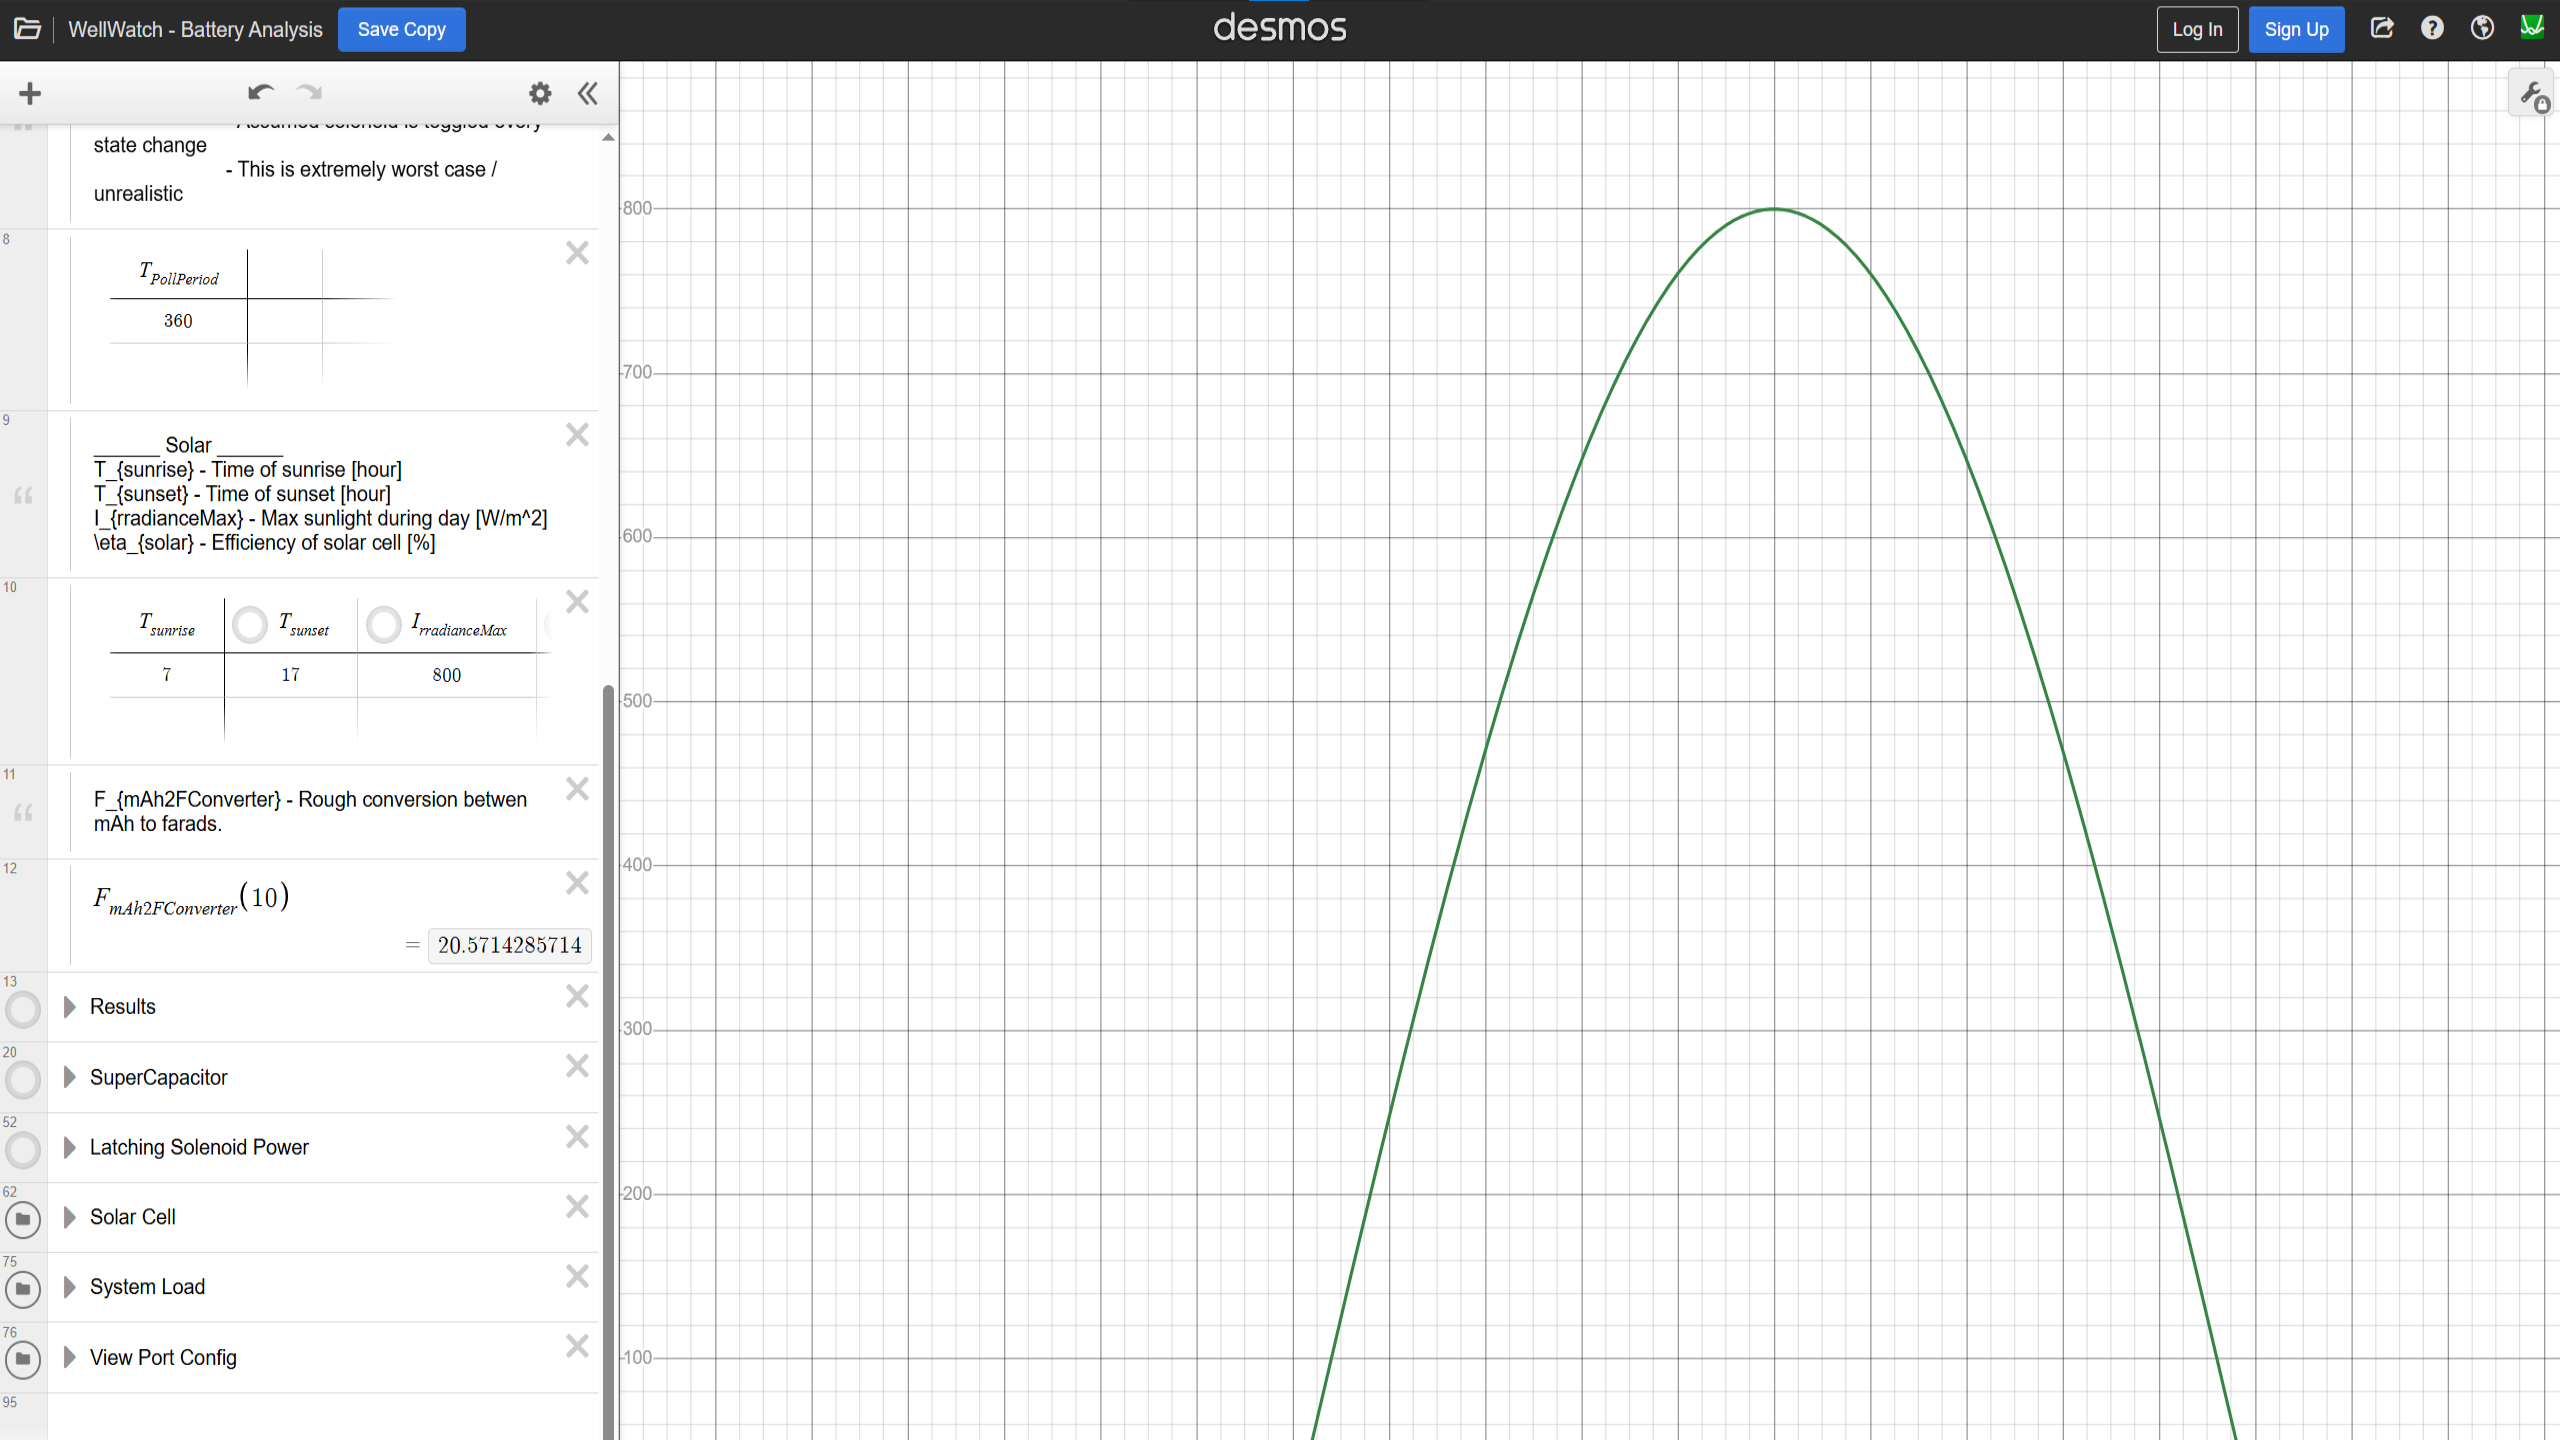
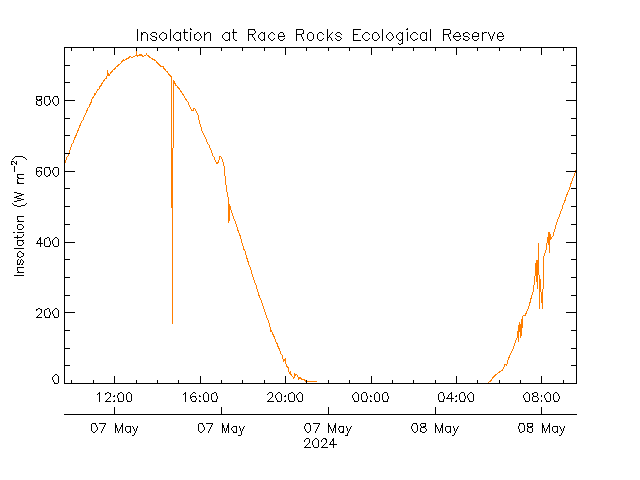
To validate the model, I compared it to real-world data from a nearby Ecological Reserve. The overall trend aligns well (Albeit less noisy).
From Irradiance to Power
Next, I converted the irradiance to instantaneous power using the specs of the SP-53X30-4-DK solar panel. While the datasheet reports its dimensions as 53×30 mm, the effective area seems to be closer to 48×25 mm. The devices maximum output power is 0.21W, and its efficiency is 18.6%.
The instantaneous power equation becomes….

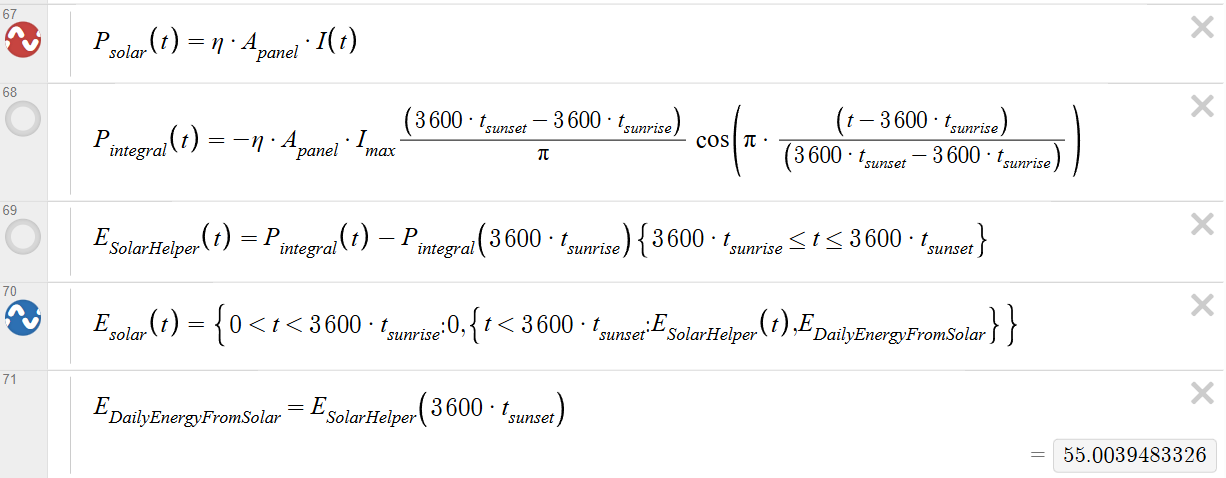
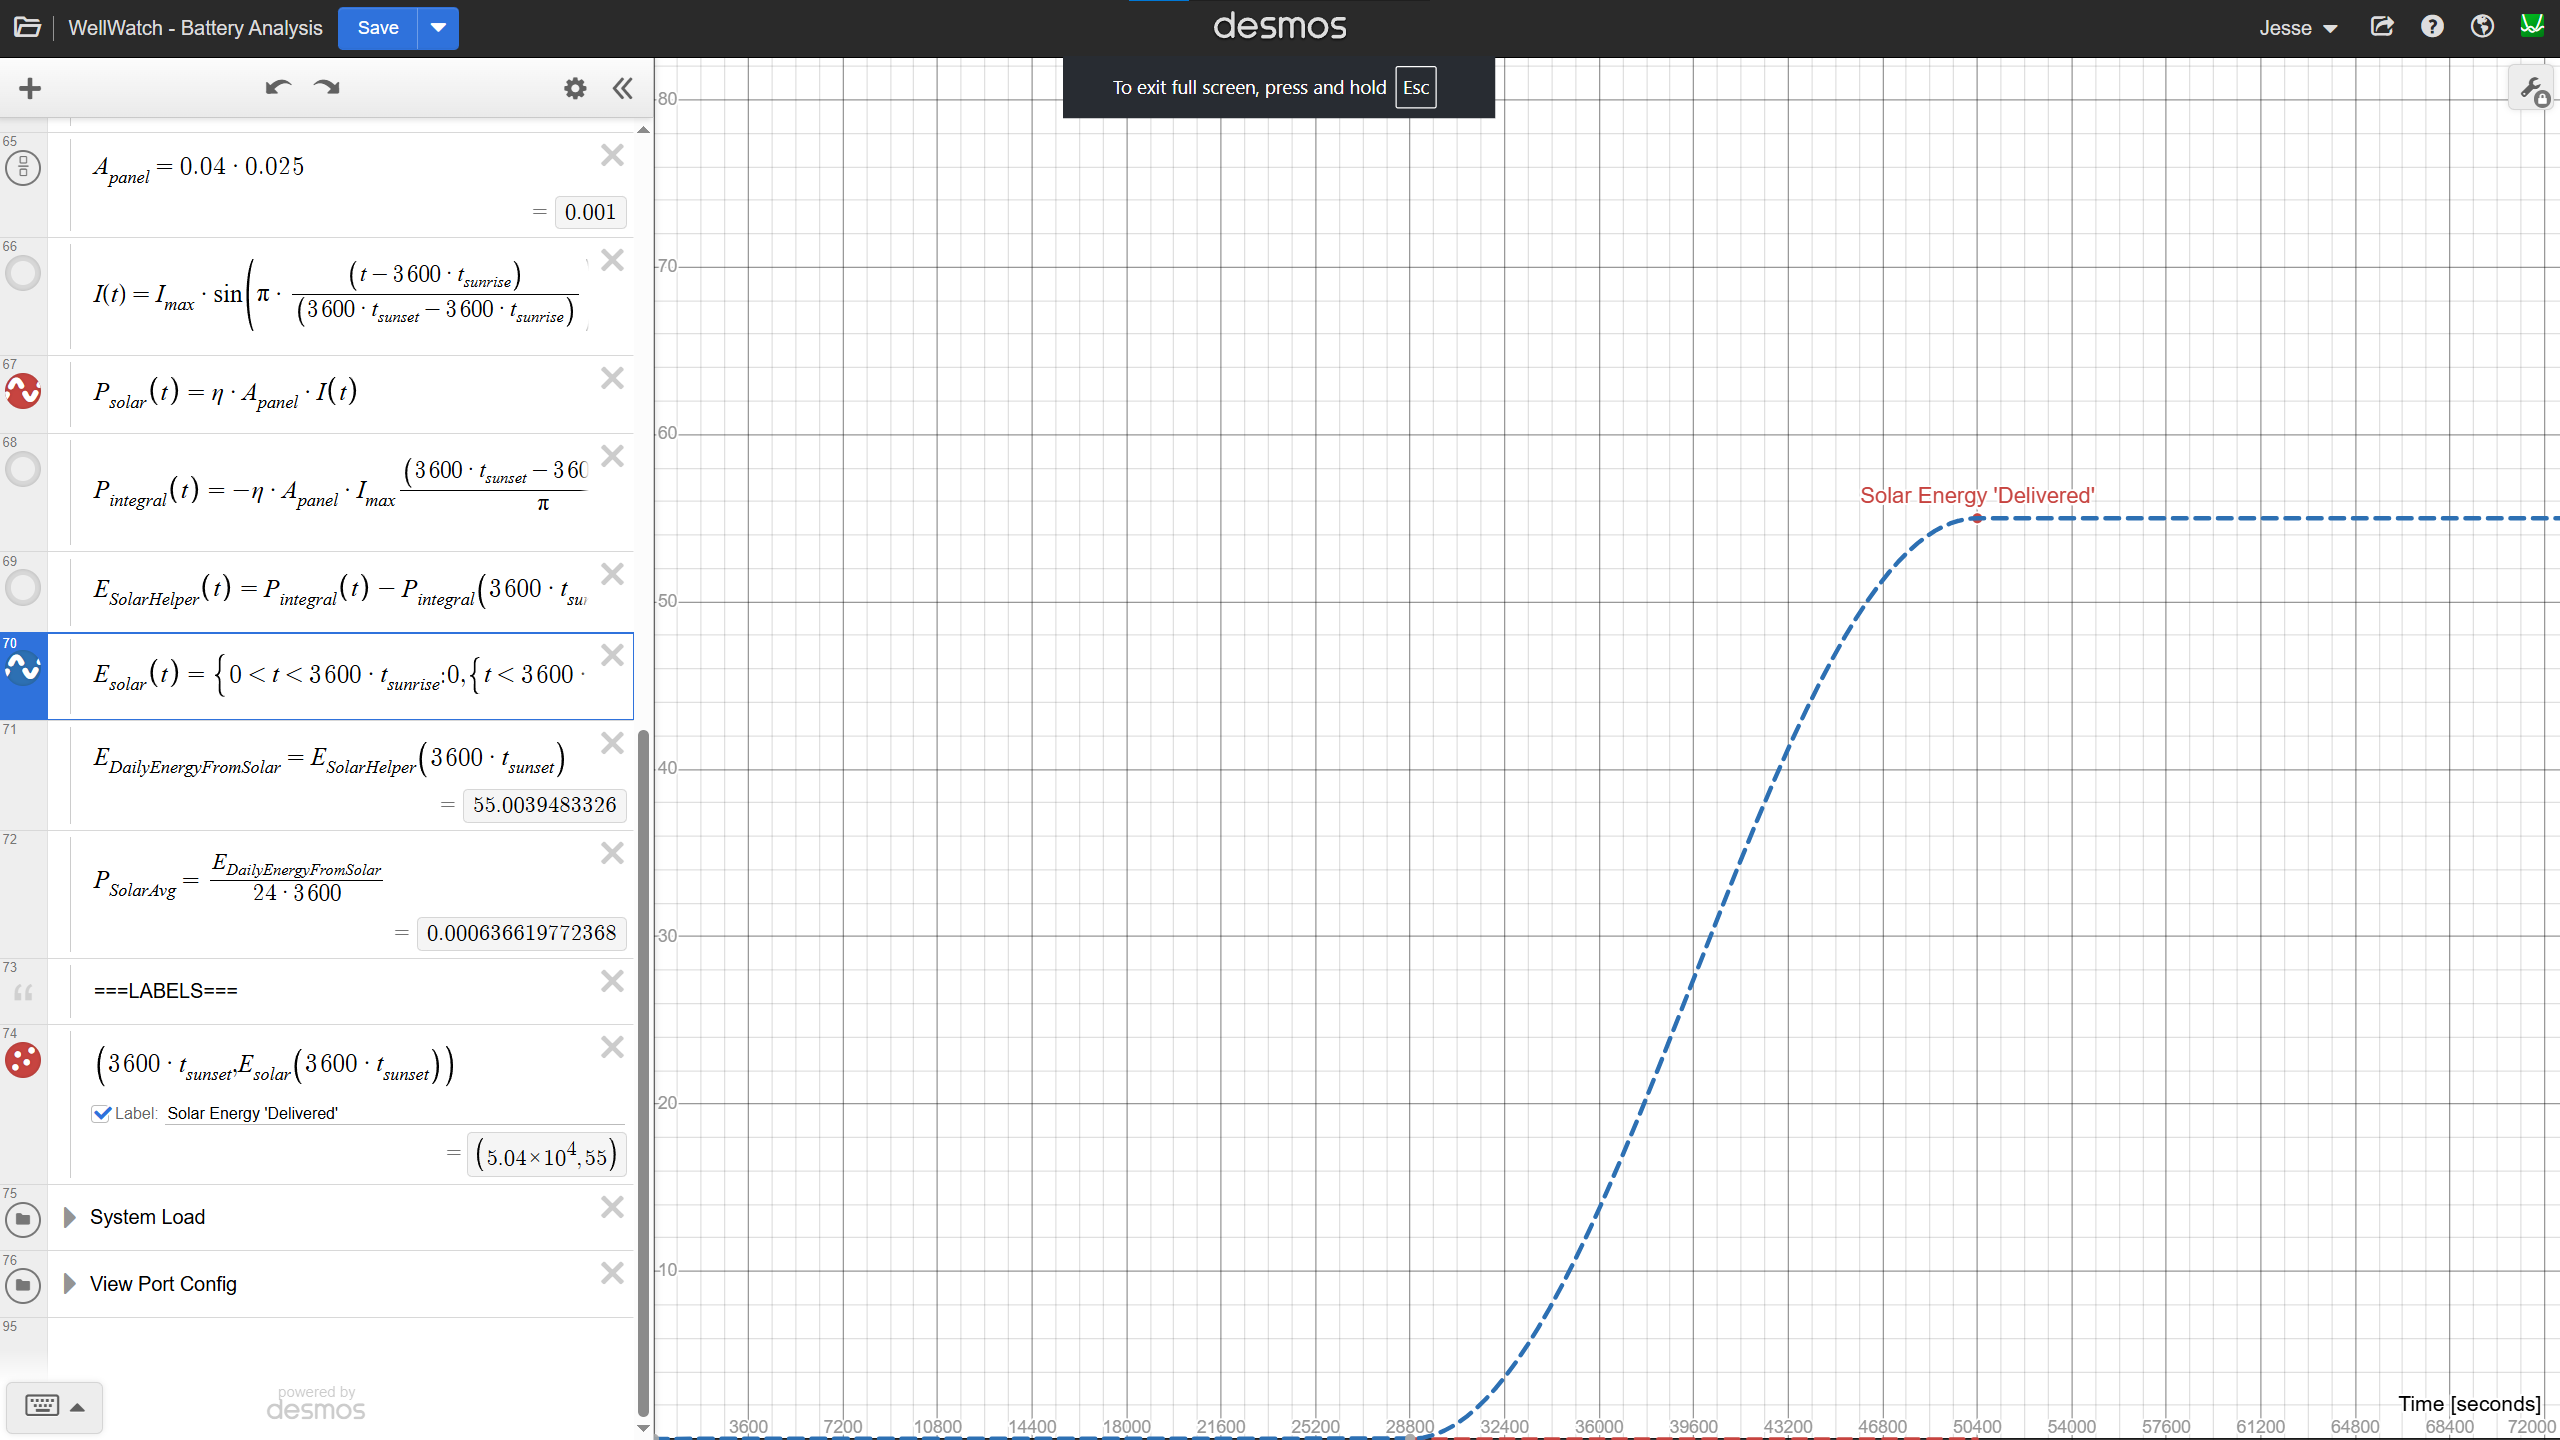
Solar Power Over Time (Energy)
The energy provided by the solar panel will be the area under the curve of P_{solar}. Desmos has an integration function, but I find it causes the system to lag badly. Doing this by “hand” I get the equations below. We have to be careful with the start and stop points of our integration, since the solar panel will (obviously!) only provide power from sunrise to sunset.
Model Assumptions
It’s important to note the approximations made by this model. Critically, I’ve ignored the efficiency of the energy harvester IC, and I’ve ignored several nuances of the solar panel such as thermal influence and MPPT (maximum power point tracking).
These assumptions are tolerable for early-stage feasibility, but would need to be revisited for the final design (or just tested in the field).
Solenoid Subsystem
Now that we’ve characterized the incoming solar power, let’s turn our attention to the main energy consumer, the solenoid subsystem.
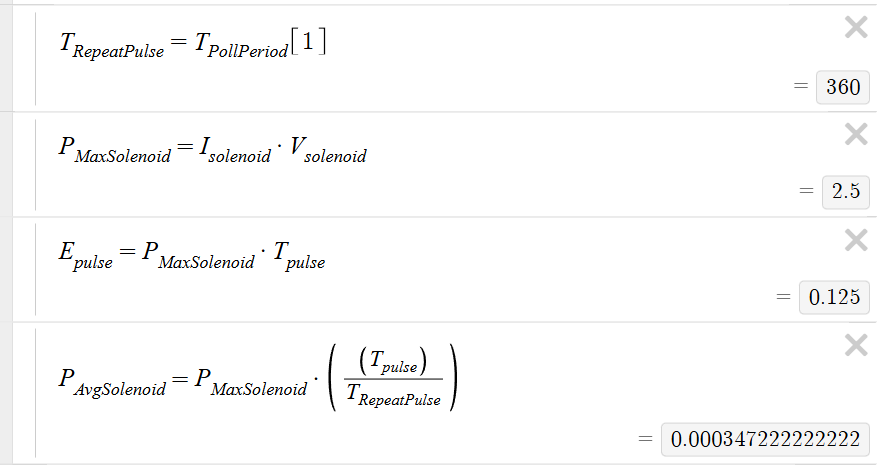
Every <to be determined> seconds, the system updates its state. During this update it sends a 50 ms pulse to either open or close the solenoid. Each time drawing 2.5 W, which equates to 0.125 J of energy.
Assumptions
Luckily modeling this system is very simple, so long as we allow ourselves a few assumptions. Assuming the energy required for a single pulse (0.125J) is insignificant compared to the total energy in the system, then we can say that the drop in energy, and more importantly voltage, from a single pulse will not appreciably affect the system.
Let’s test that assumption with some numbers…
Assuming 1F at 1.5V, a single solenoid pulse will drain the stored energy to 1J (0.5*C*V^2 - 0.125J), which will result in a drop from 1.5V to 1.41V. Increasing the capacitor to 10F, would reduce the change in voltage to 1.49V. This assumption seems reasonable so long as the effective capacitance is greater than ~10F.
The solenoid subsystem also includes a boost converter, the efficiency of this boost converter has not been incorporated into this model yet, nor has its quiescent current. For now, we will assume the impact is minor.
Average Power and Energy
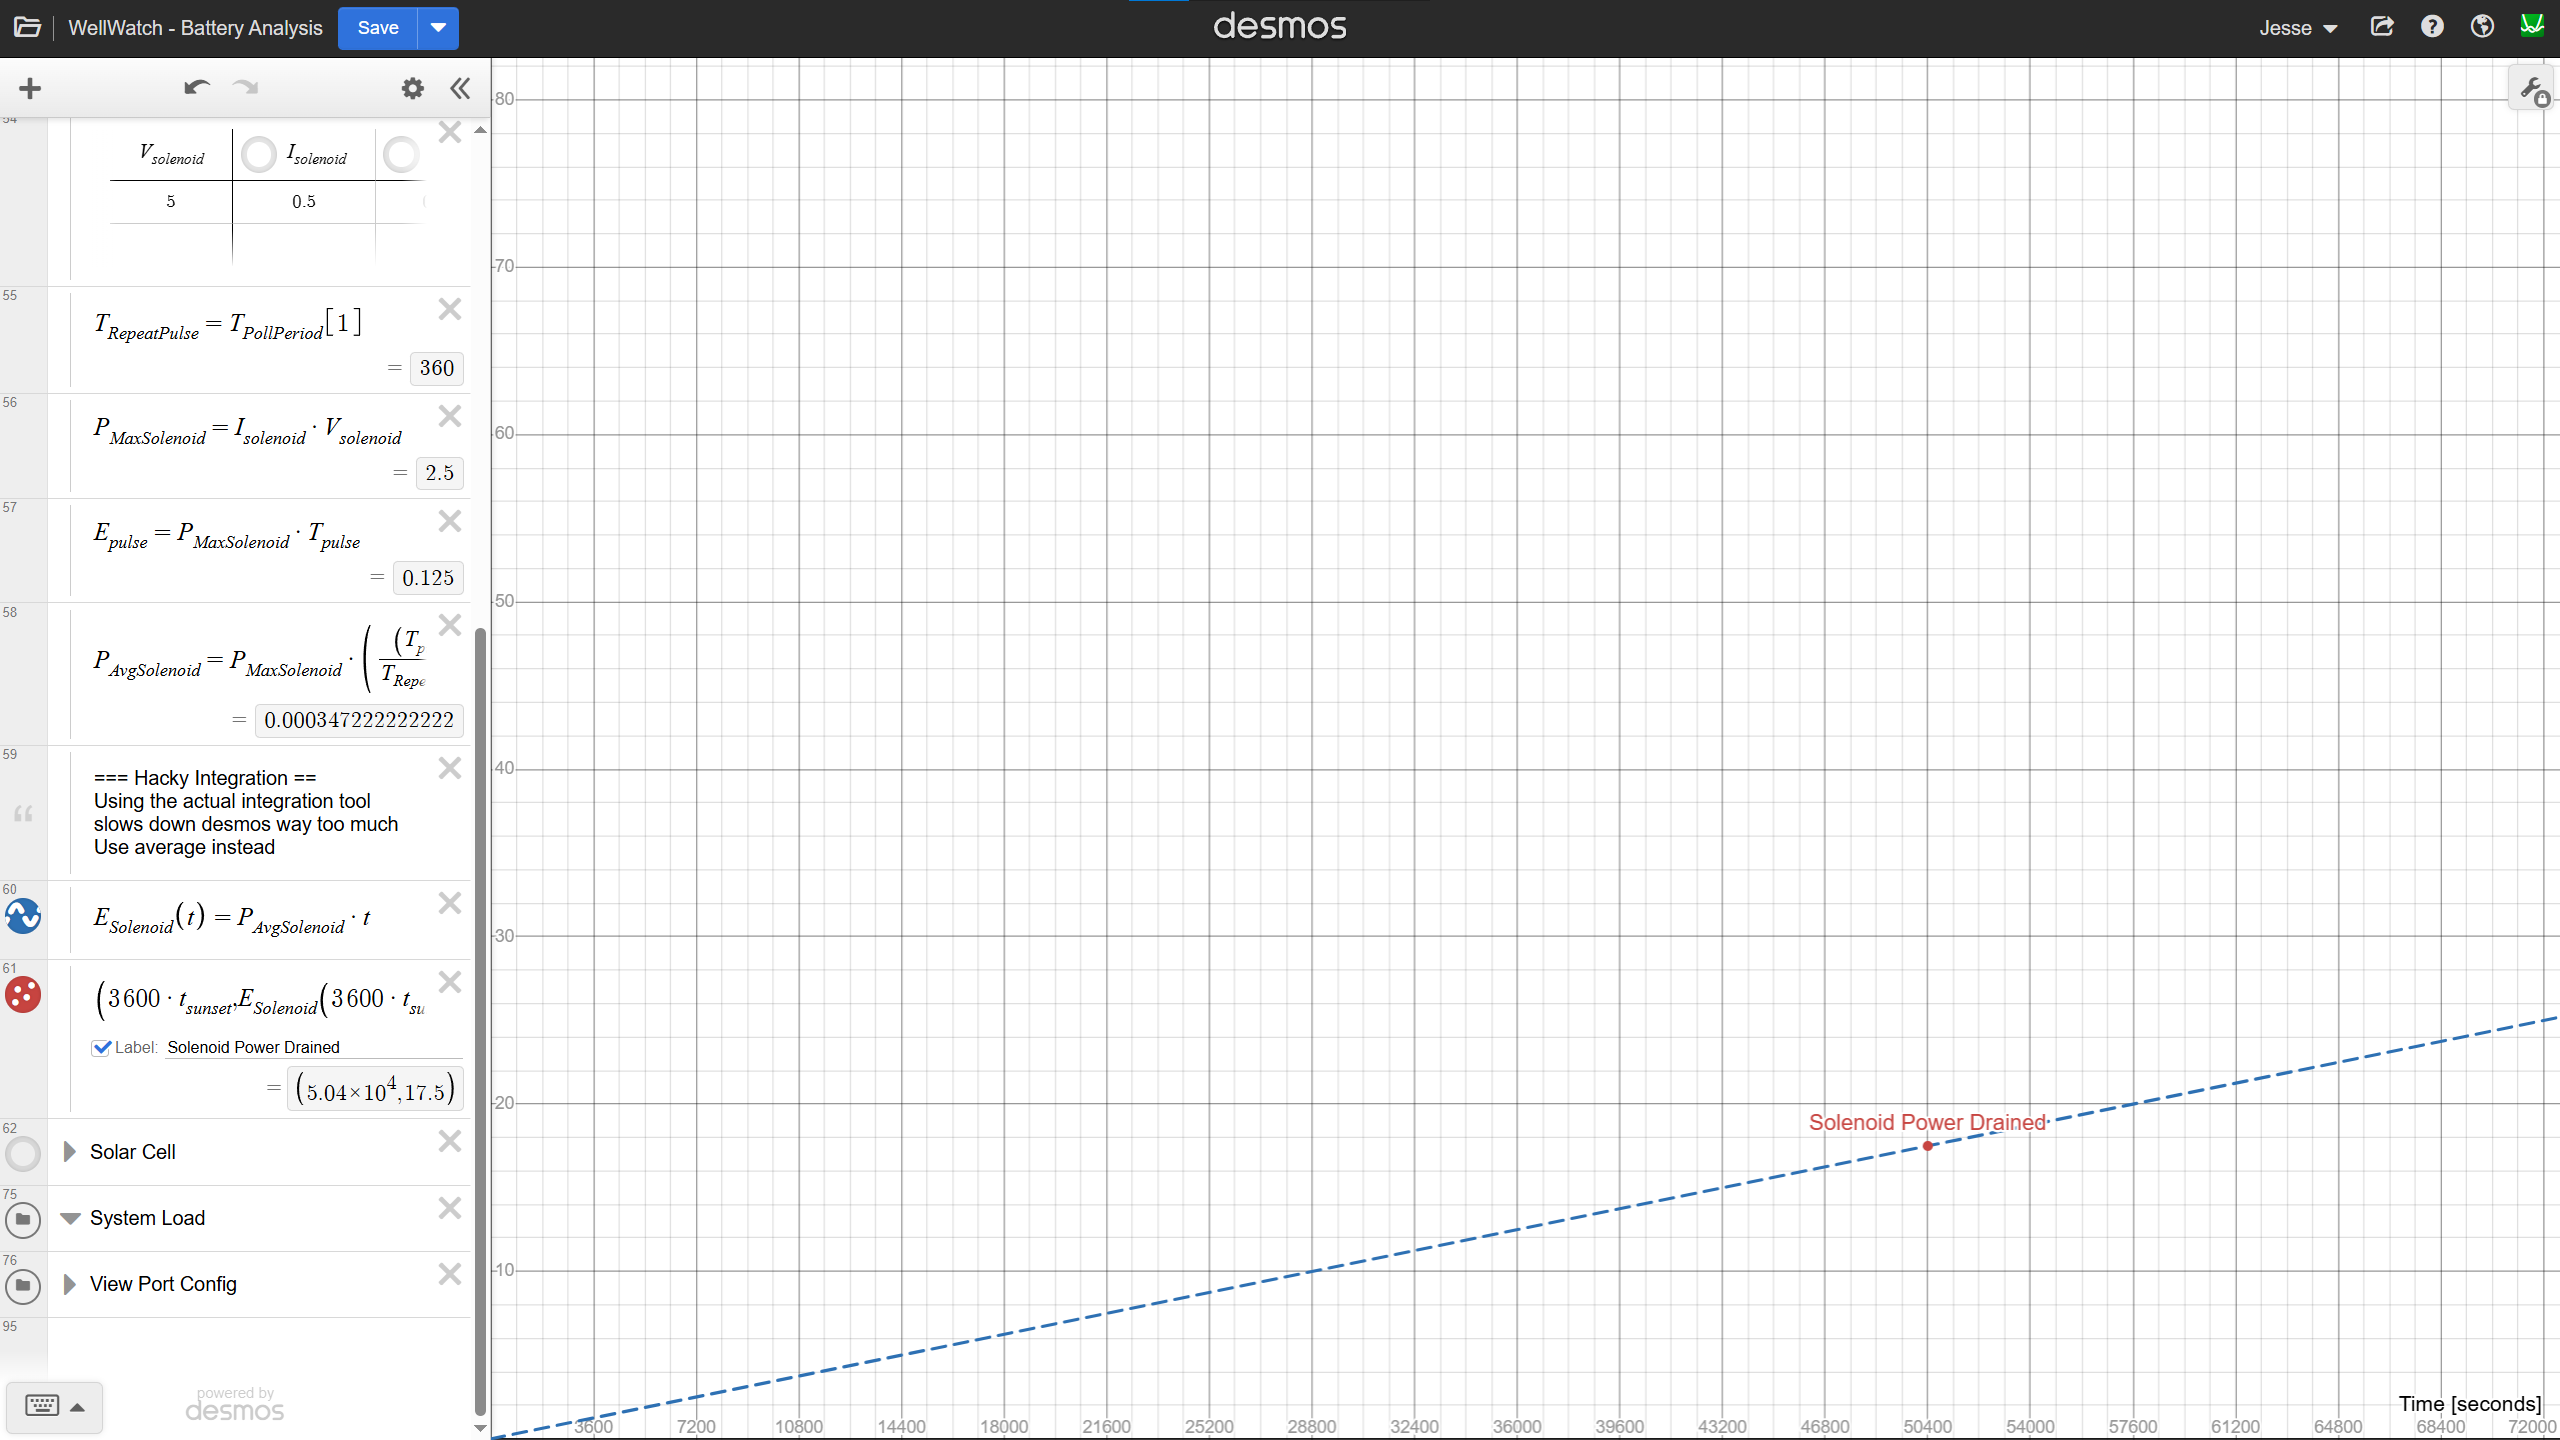
With our assumptions, we can model the average power draw of the solenoid subsystem as…
The average energy consumed from time=0, to time t is then…
E_{Solenoid}(t)=P_{AVG}*(t)
This produces a predictably uninteresting waveform shown below.
Energy Storage Subsystem
We now have the two key subsystems modeled in the graphs below. Since everything has been defined as a function of time, it’s easy to add or subtract them in the tool. We can also now calculate the energy in our battery as E(t).

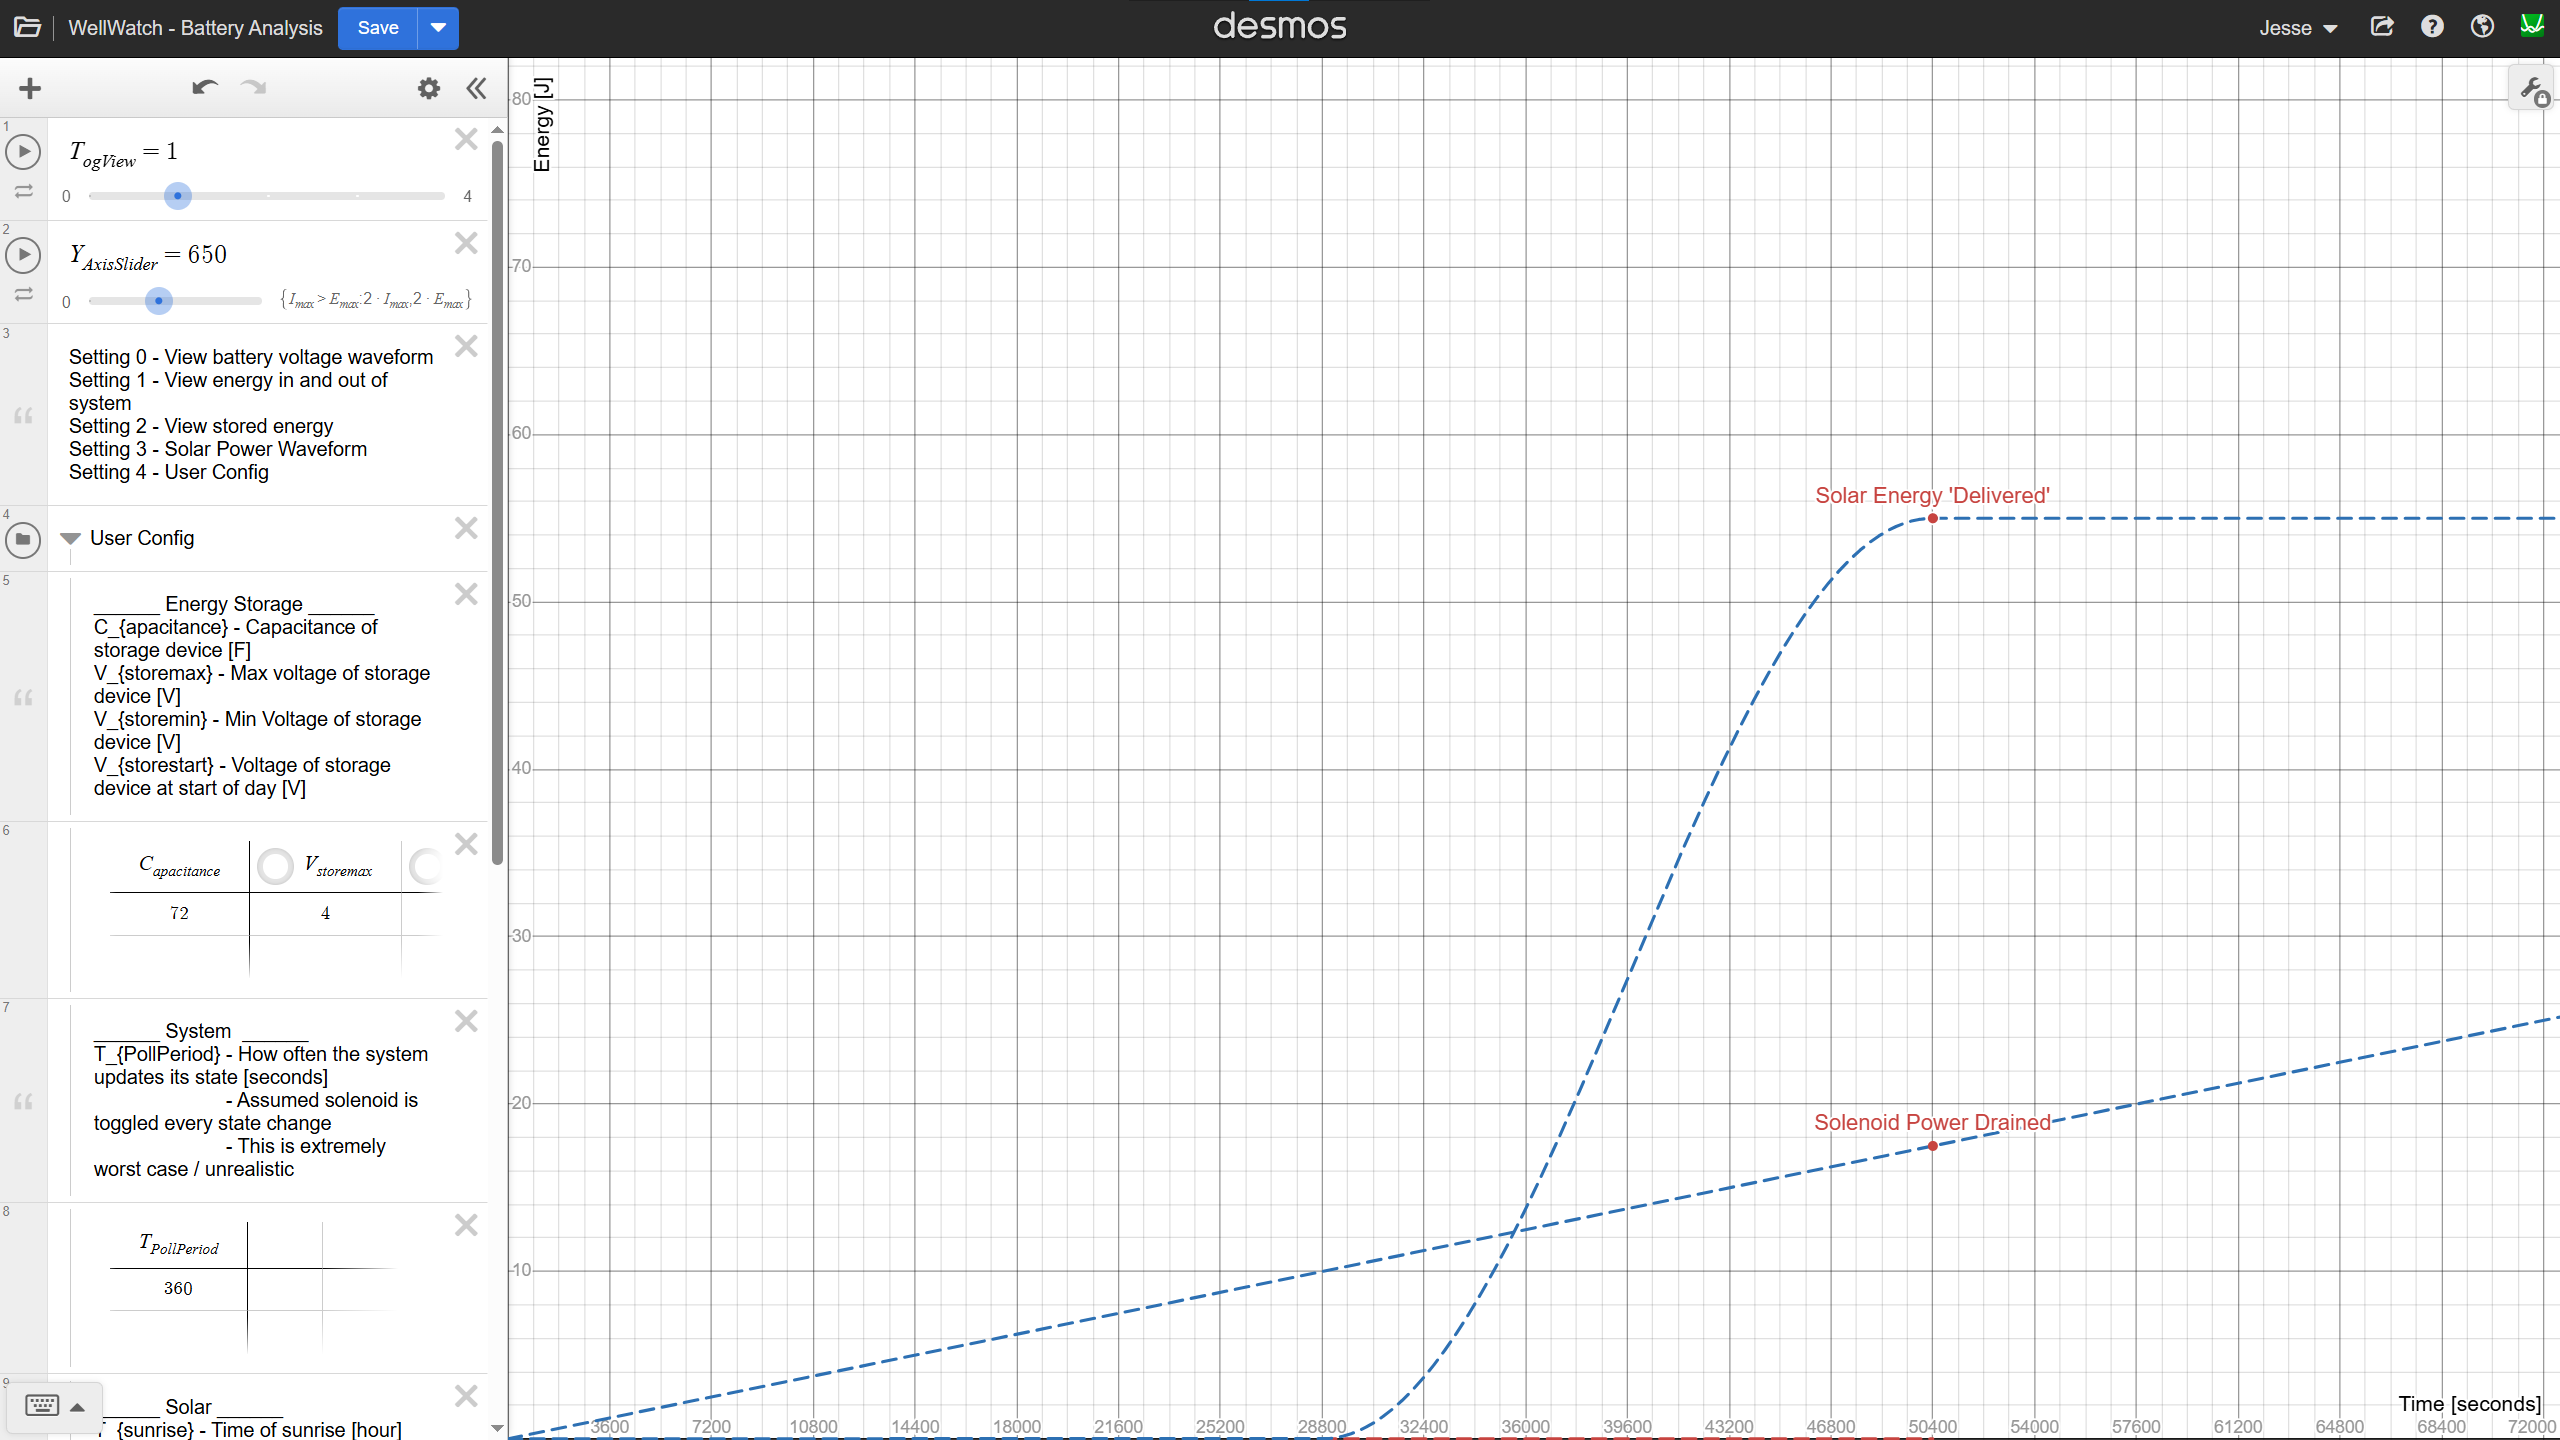
Voltage Limits and Capacity Boundaries
Of course, this model assumes an ideal world where energy can increase or decrease without bound. In reality, the energy storage system is constrained by voltage limits, both of the storage device and the circuits powered by it.
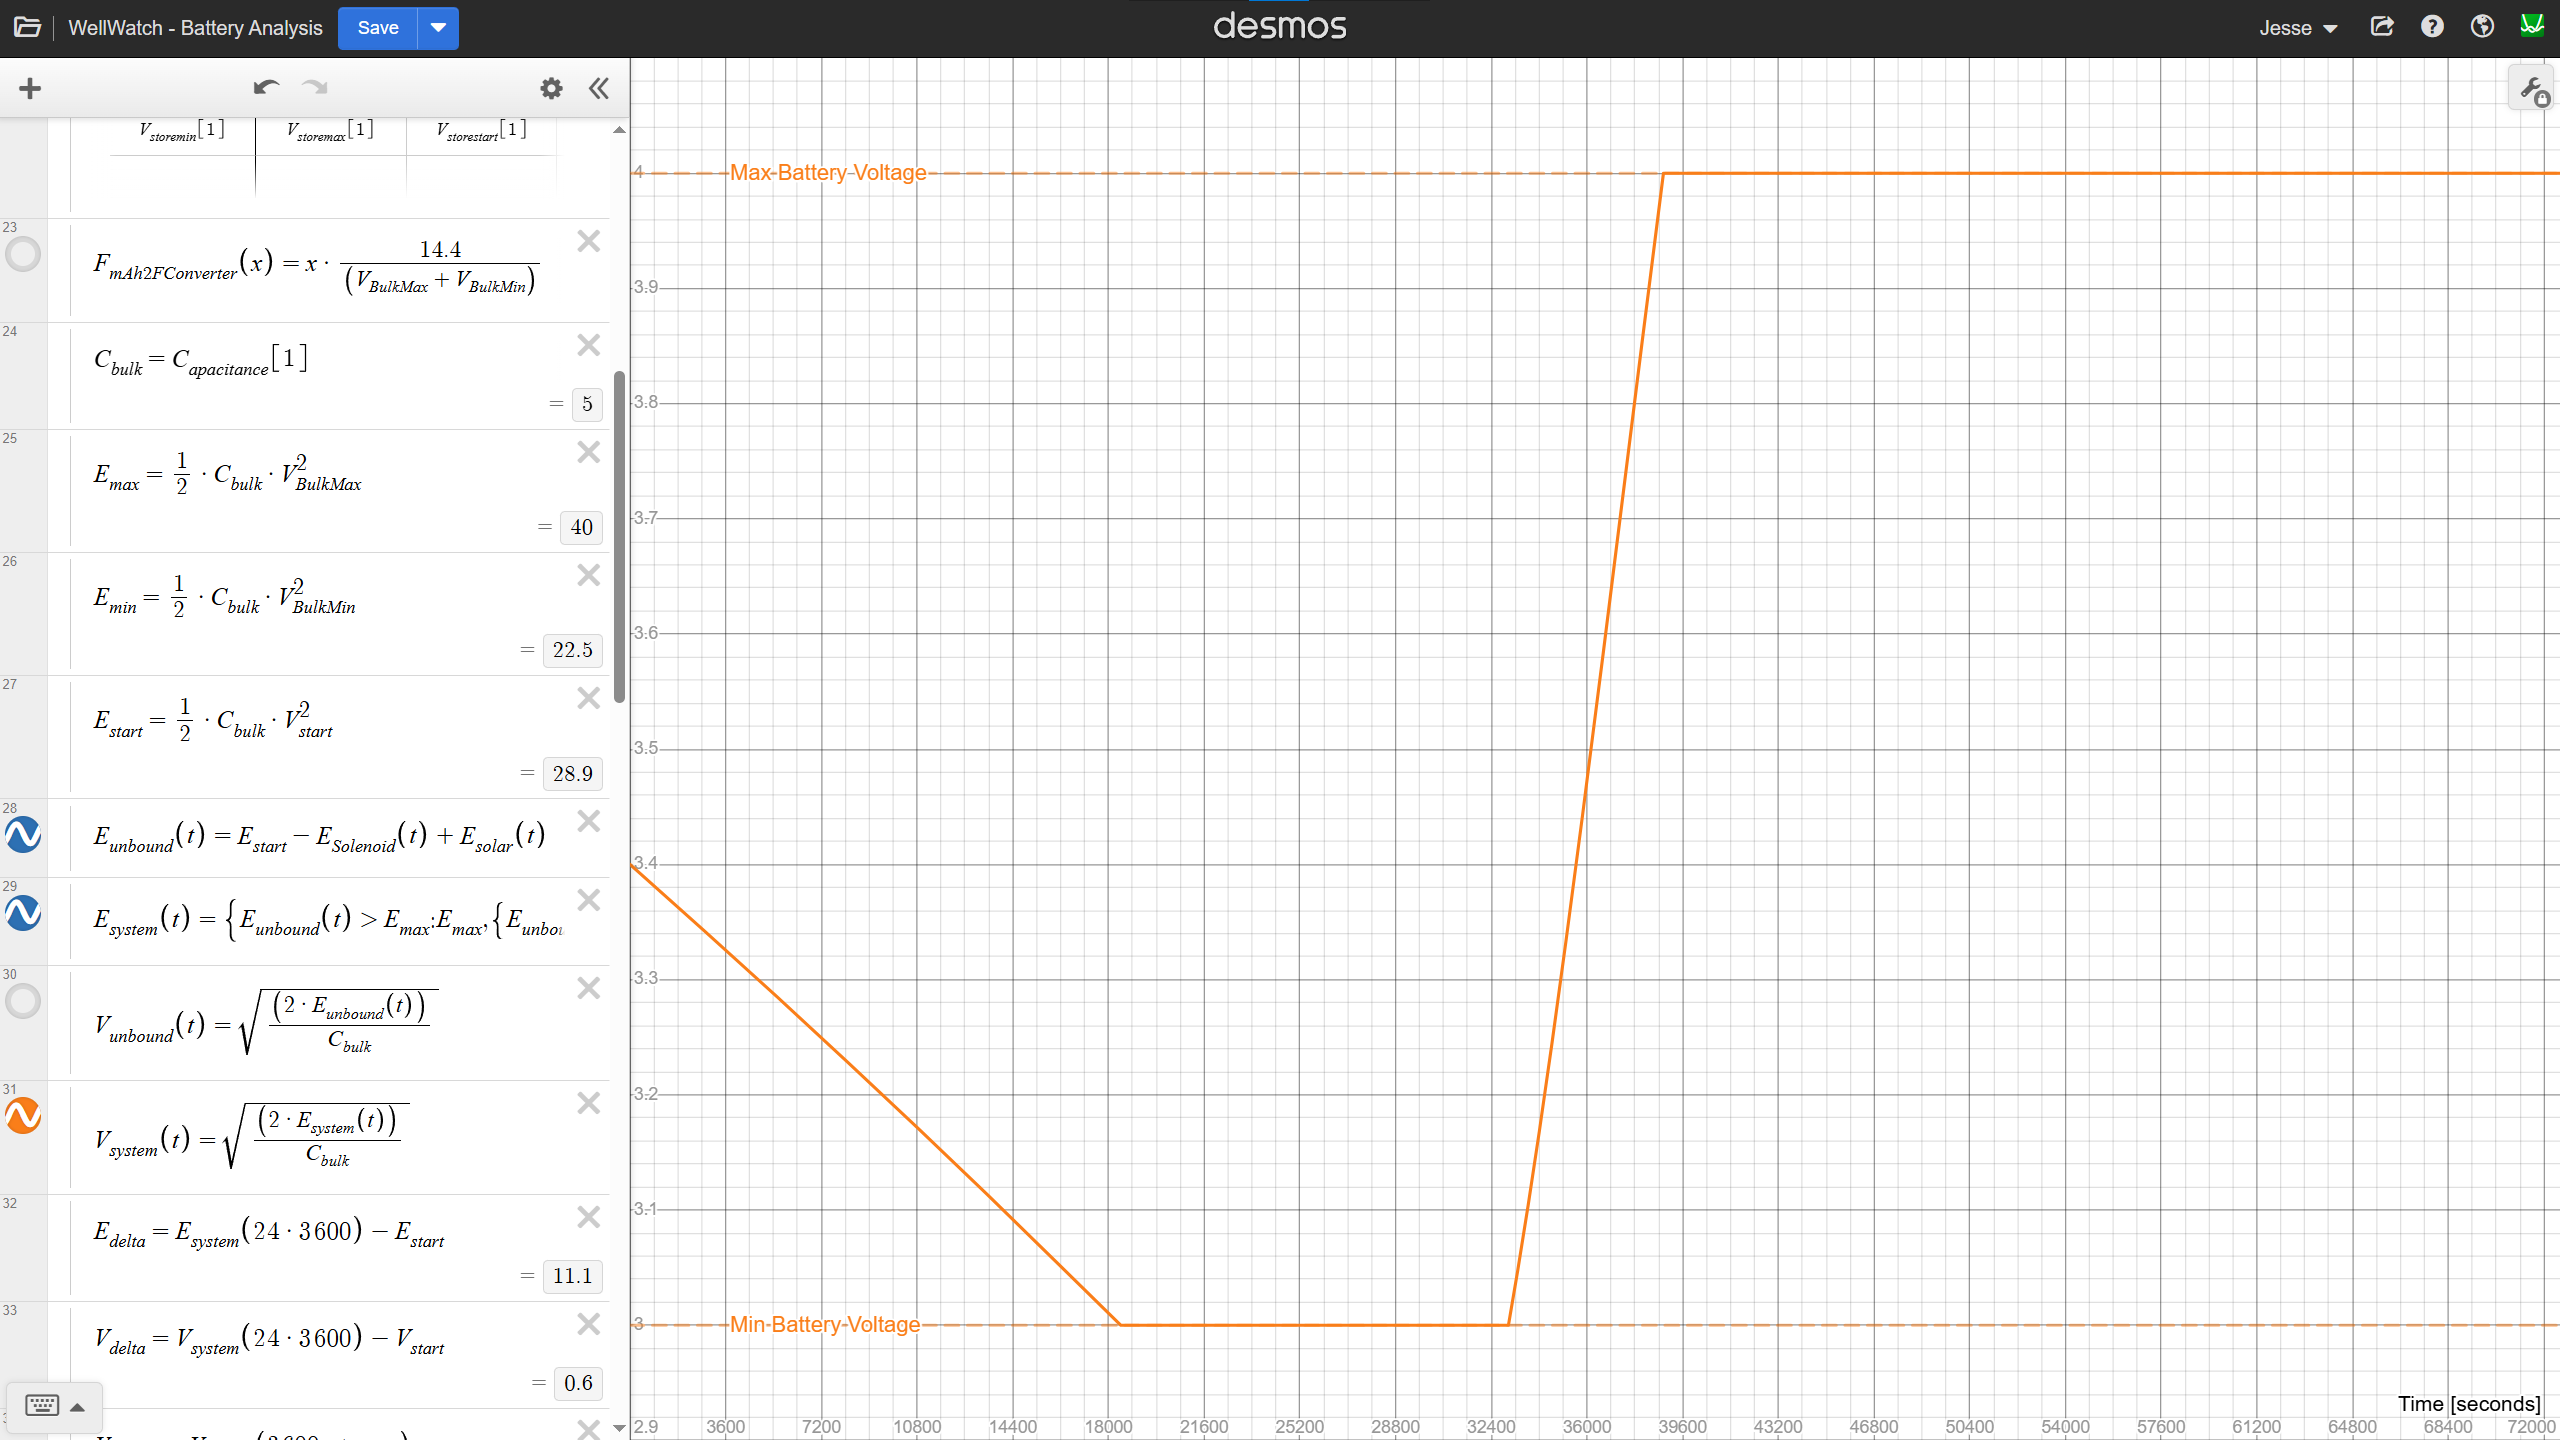
Knowing these voltage limits allows us to calculate the maximum and minimum storage potential. Plotting these limits we see the following, when using a 5 Farad capacitor for illustration.

We can then easily calculate the voltage on the battery using stored energy waveform.
A Modeling Caveat
It’s important to recognize a limitation of the Desmos model: once the energy waveform exceeds the physical bounds, all subsequent values are invalid. This is because the Desmos plots are based on unbounded energy calculations and don’t include voltage clamping. The clamping is only as a visual reminder for the user.

Excel Port and Model Validation
Later the same day, I ported the tool to excel. This made calculating energy much easier (numeric integration is simple in Excel), and allowed me to resolve the limitation mentioned above. Based on the Desmos model, I expected the following:
- Shutdown point at 11,934 s – solenoid drain with no solar input
- Start of charging at 29,798 s – solar power begins to exceed load
- Peak energy at ??? s – hard to estimate without Excel
- Start of discharge at 49,401 s – solar output falls below demand
The Excel model successfully reproduced these key transitions and also revealed two previously unclear boundaries.

Using the Model
With the model built, I ran a simulation using a 10 F Li-Ion capacitor. The key parameters were:
- Vmax: 4.2 V
- Vmin: 2.5 V
- C: 10 F
The capacitor is assumed to start halfway between its voltage limits. Solar parameters remain unchanged, as listed below.
- Sunrise: 7 AM
- Sunset: 5 PM
- Max irradiance: 800 W/m²
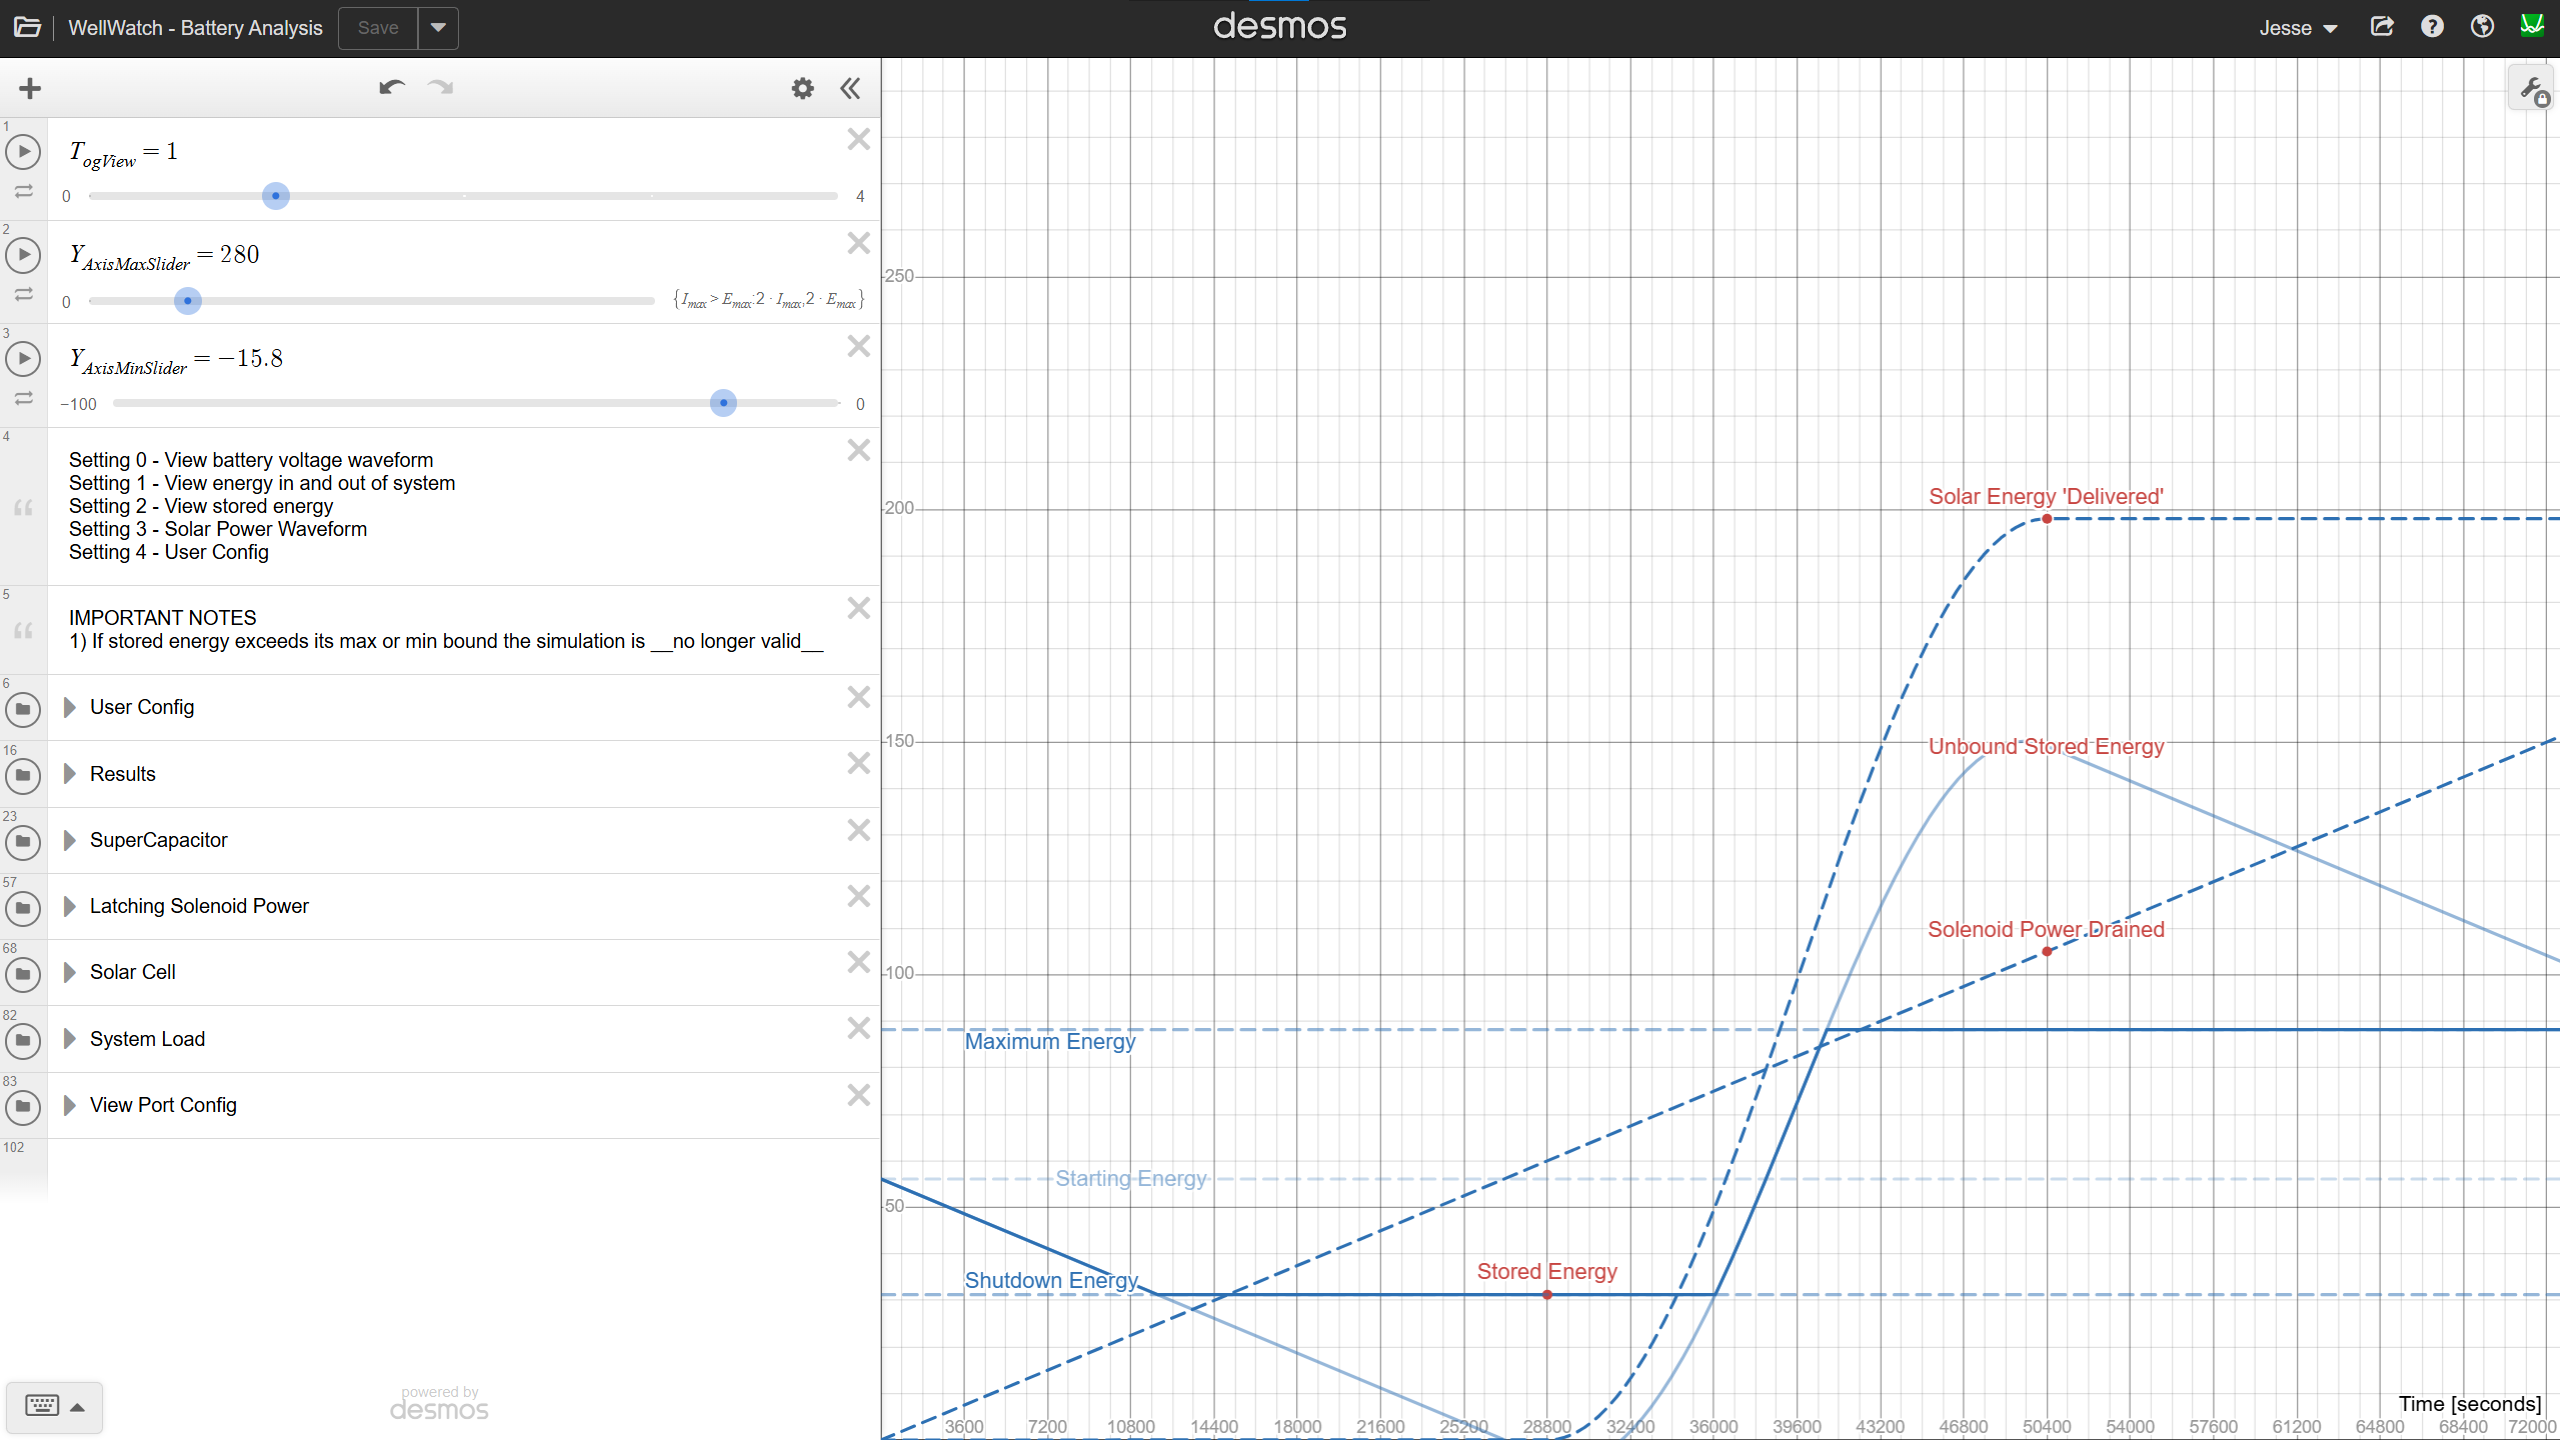
Clipping and Load Adjustment
The stored energy waveform is clearly clipped. This happens when the solenoid subsystem draws more energy than the solar panel & energy storage can provide, causing the voltage to hit its lower limit.
To fix this, I increased the system update period from once per minute to once every 3 minutes. This reduces the average power consumption of the solenoid subsystem and prevents clipping on the low end.
However, this change introduces, or more accurately highlights, a large amount of wasted energy. The curve overshoots the capacitor's maximum energy capacity. We can reduce the amount of wasted energy by either increasing the maximum voltage of our storage device, or by increasing its capacitance.
Reminder – Once the stored energy waveform exceeds its maximum or minimum, subsequent results should be considered invalid. The true waveform is shown below.

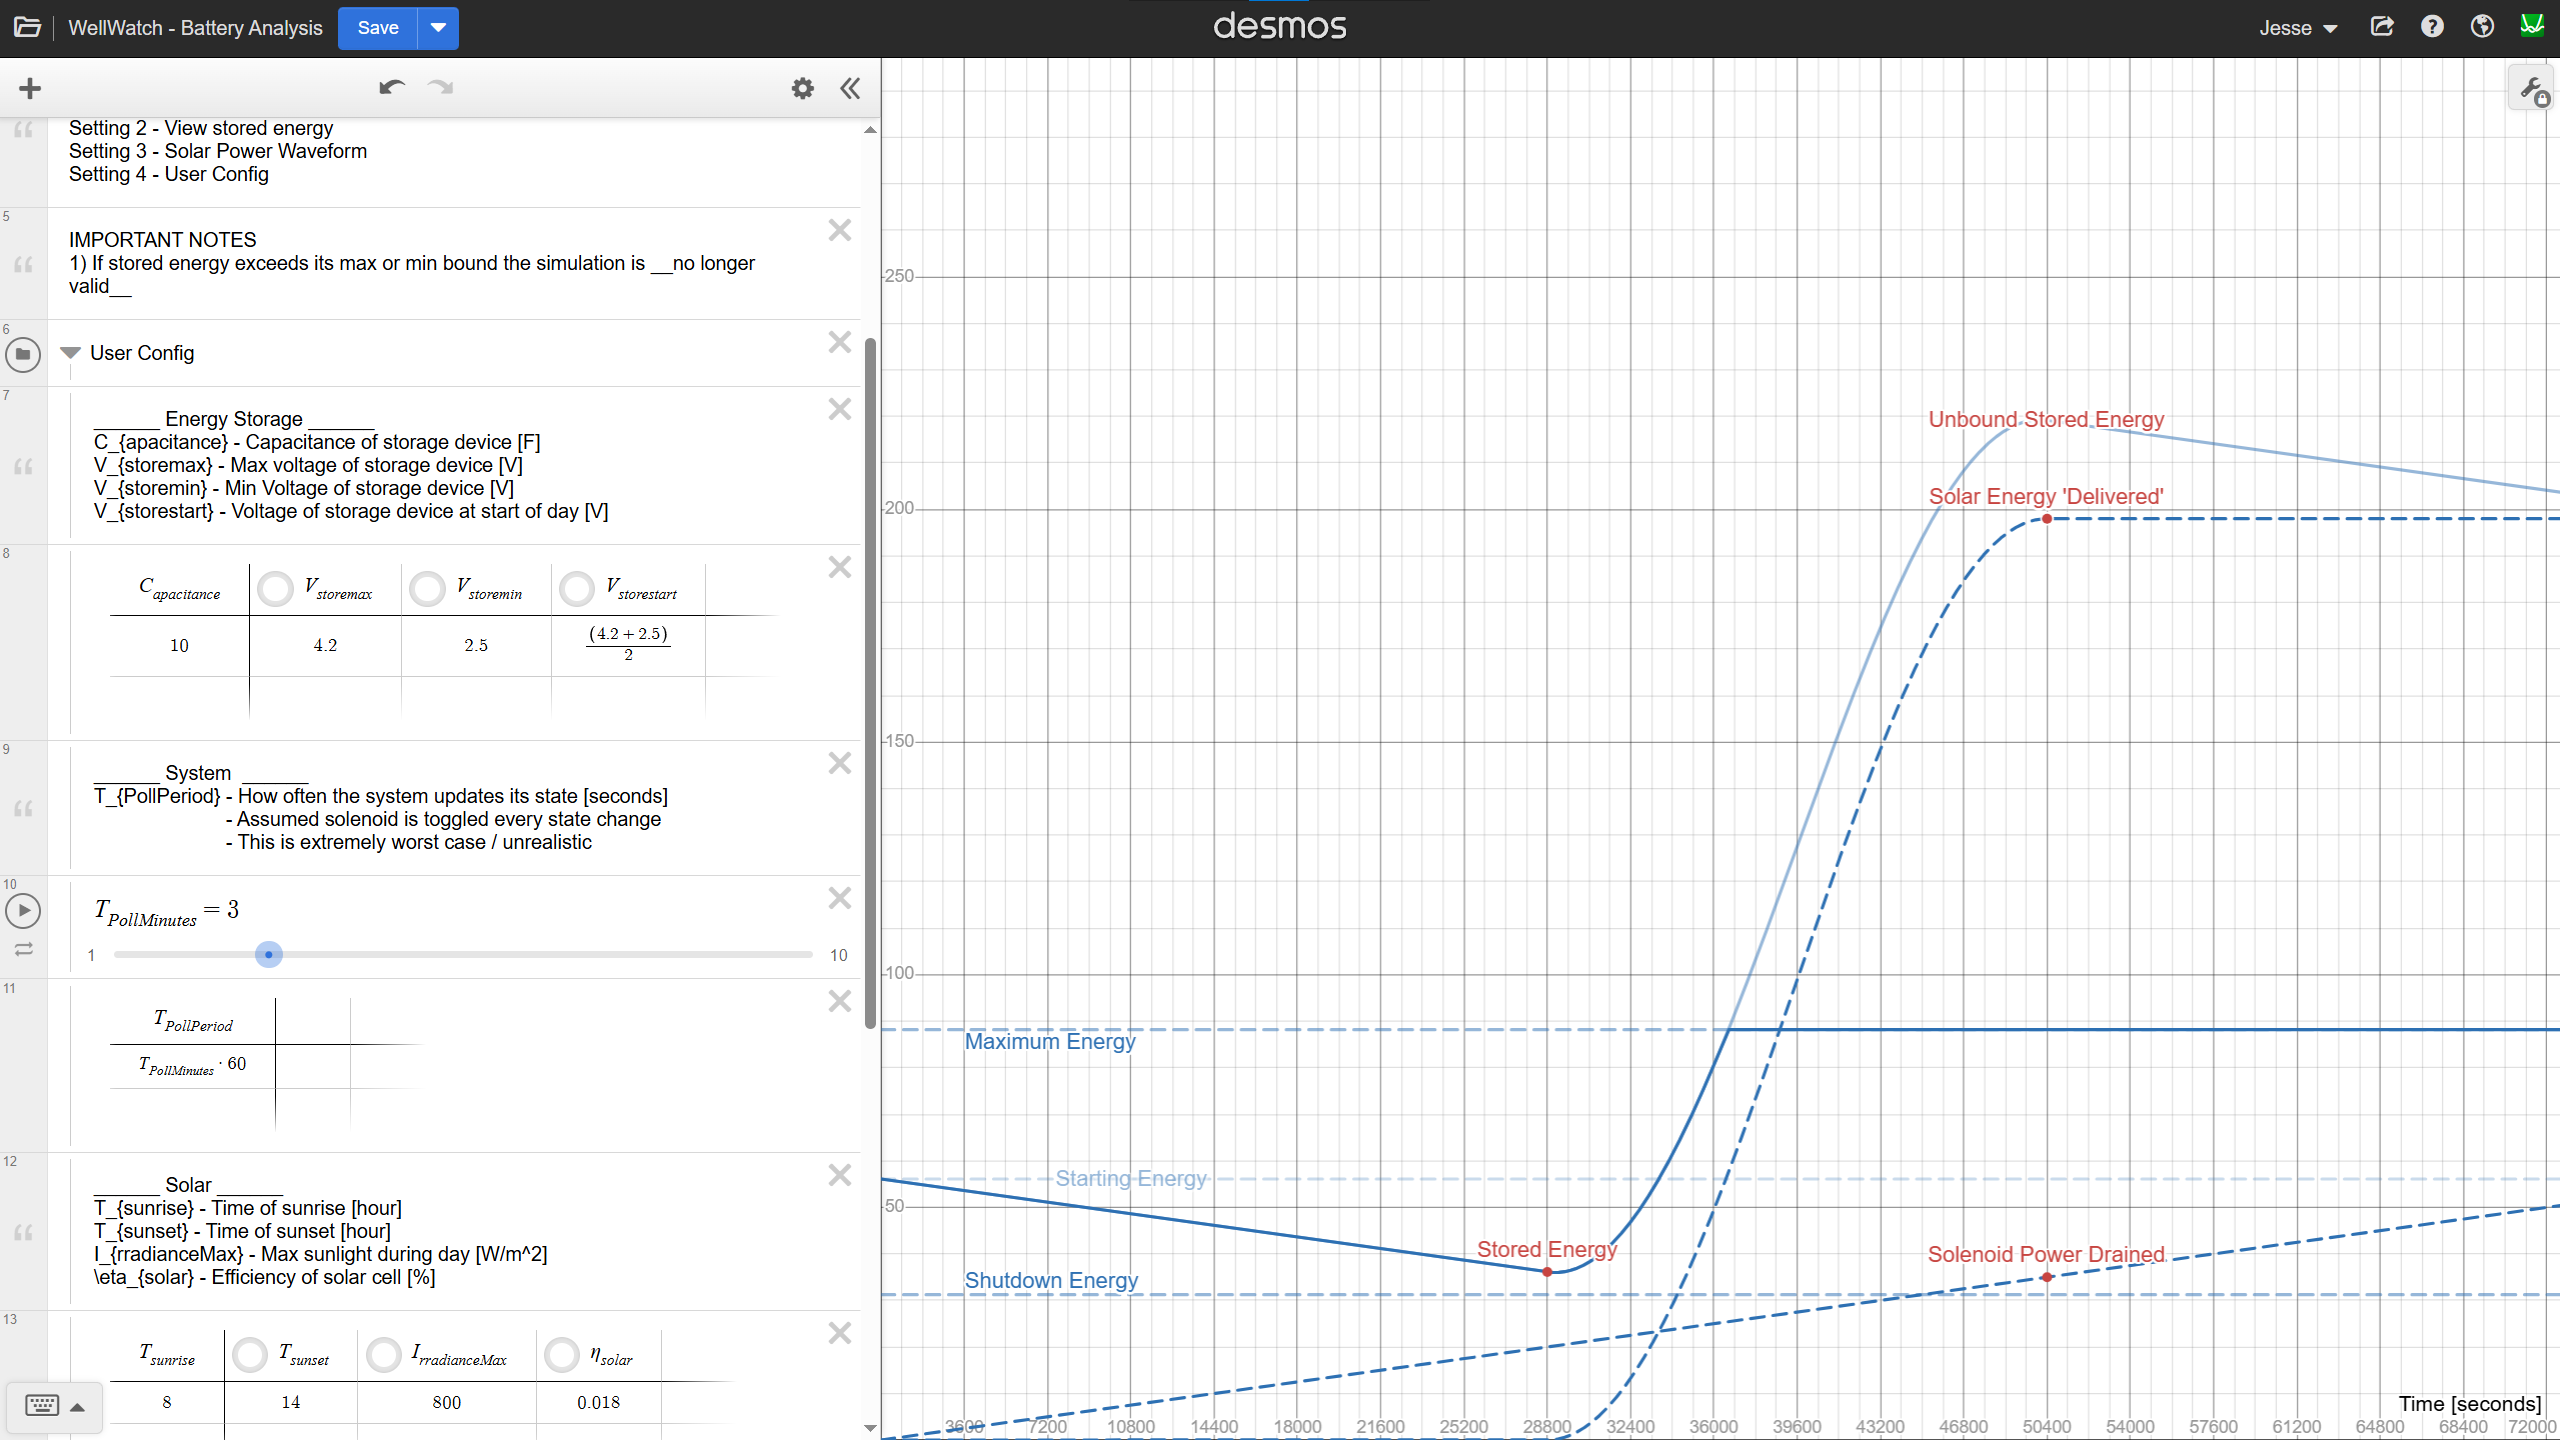
Scaling Capacitance
To eliminate clipping without wasting energy, I increased the capacitance
Since the maximum voltage is relatively fixed, we will instead increase the capacitance. At 60 F, the system can now store all excess energy during the day.
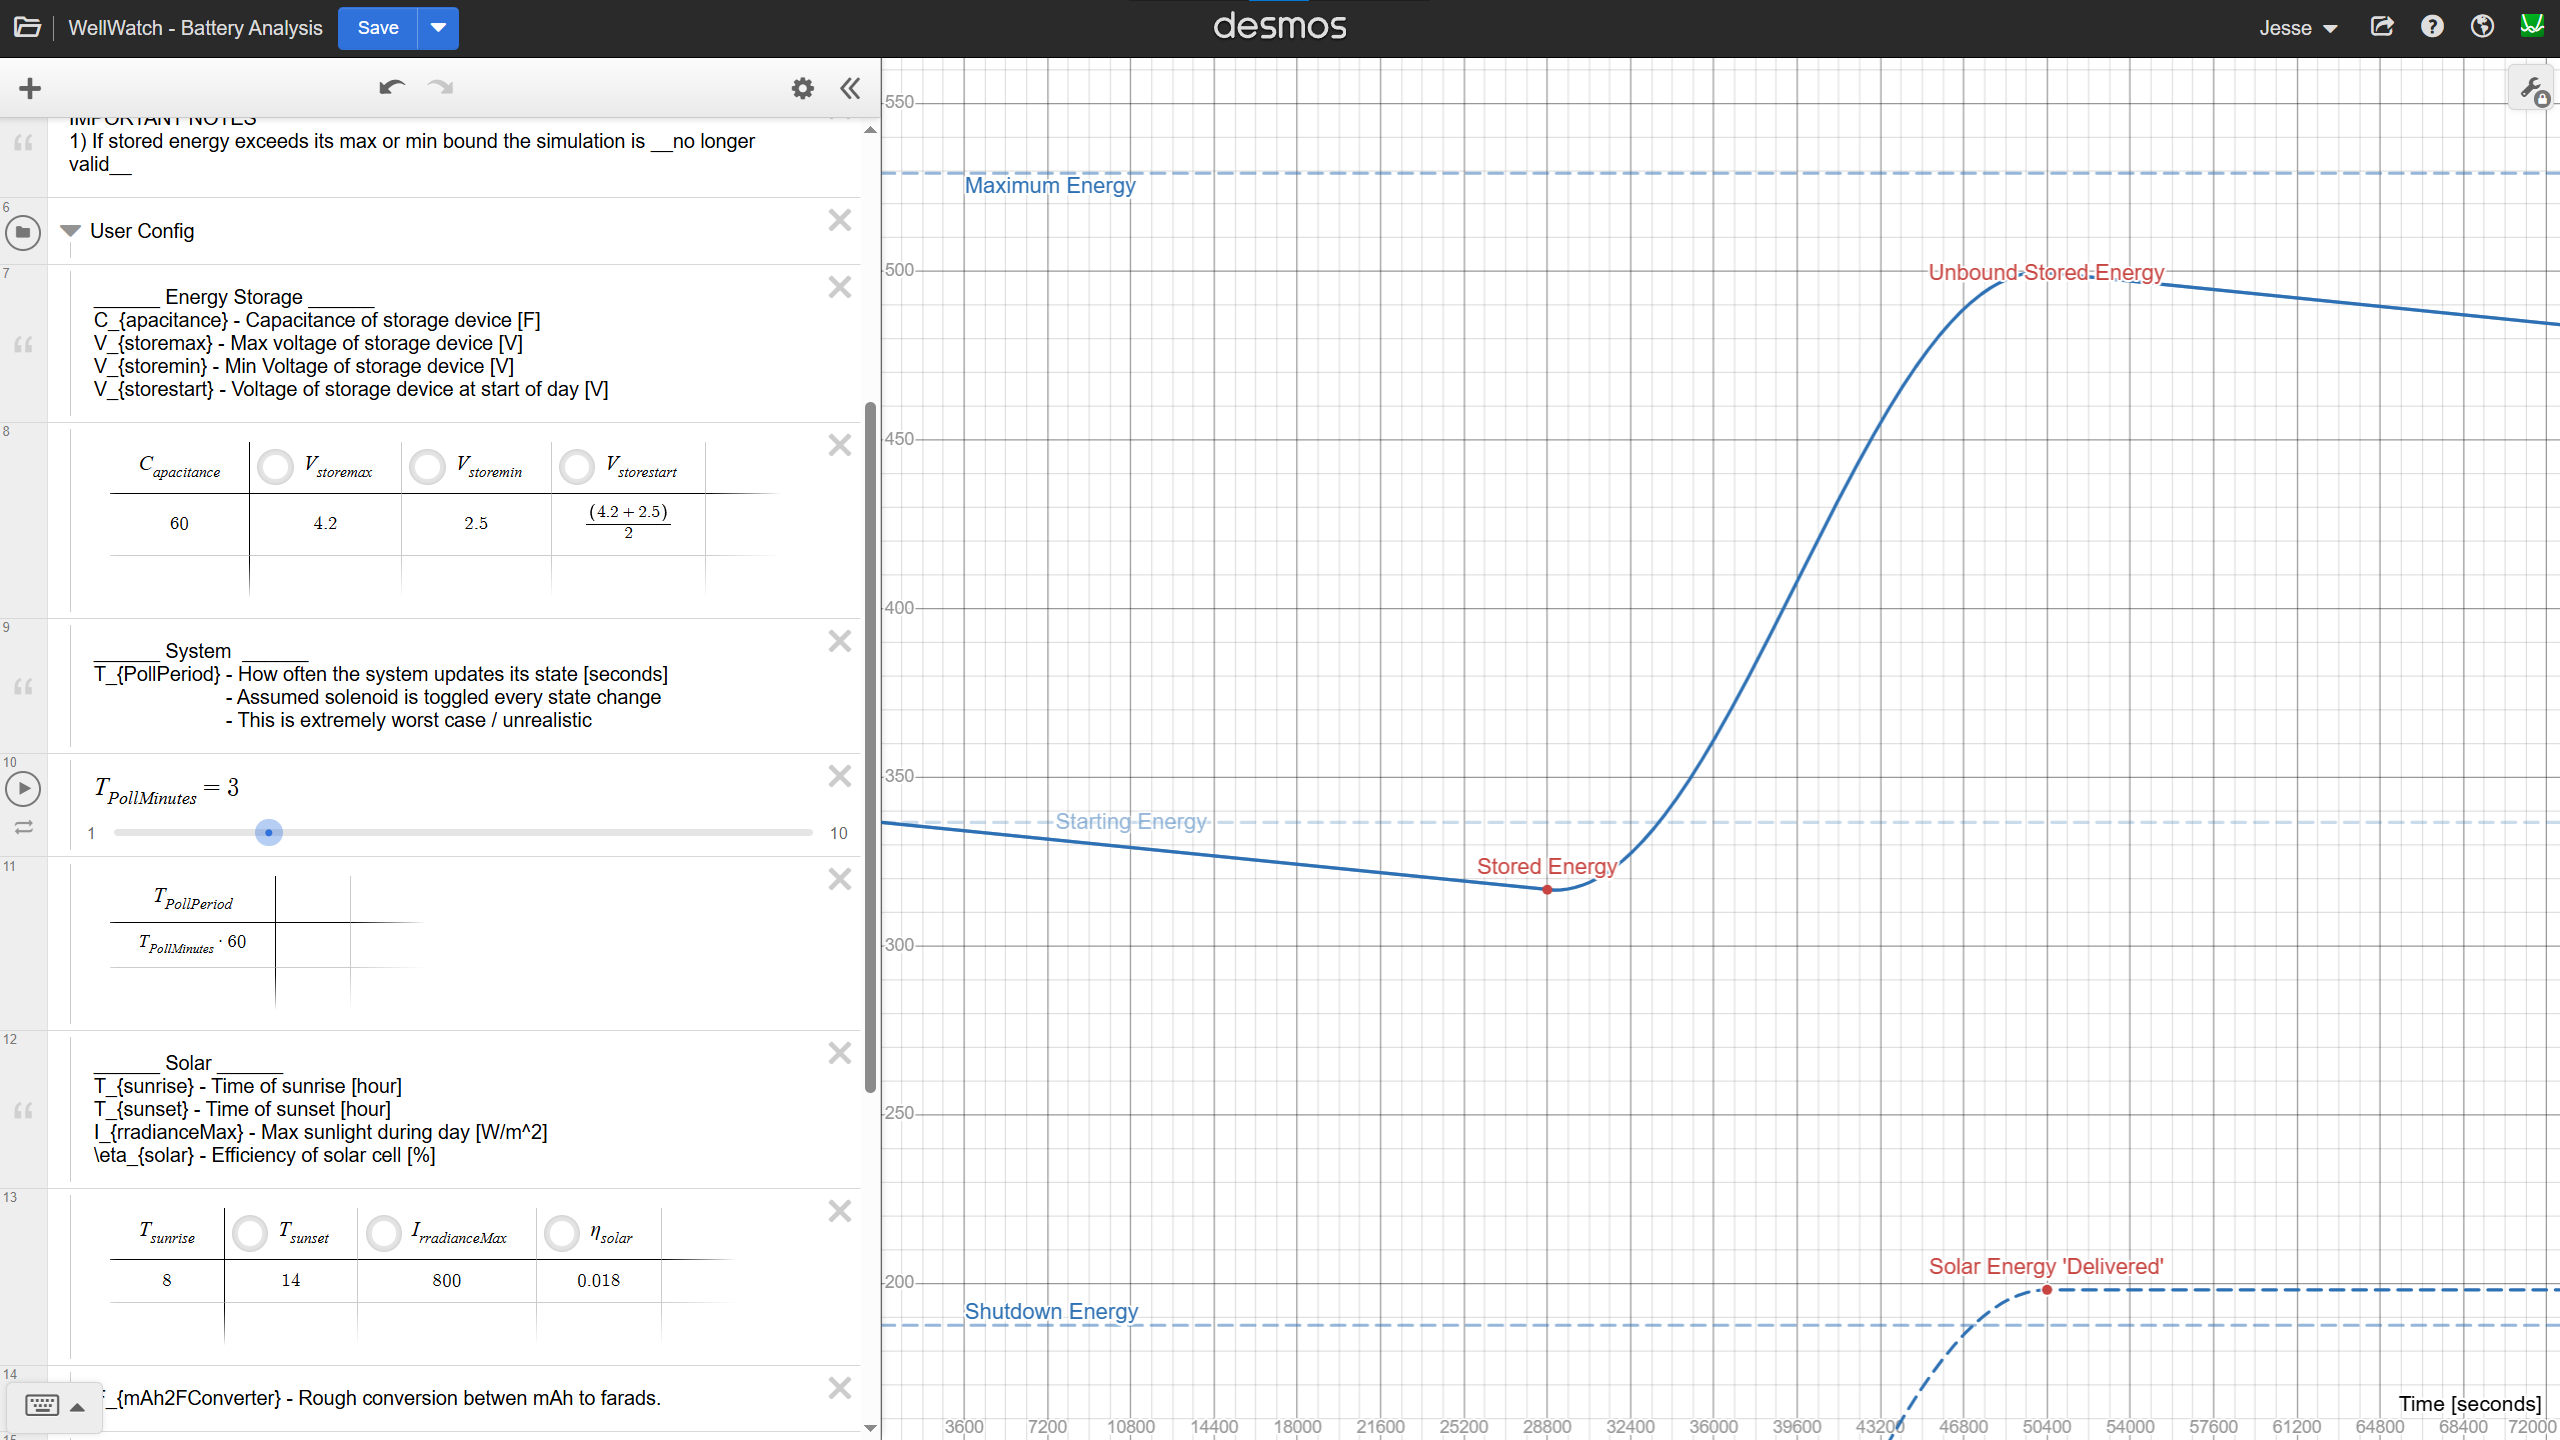
Note – Because the capacity has increased, so has the minimum, maximum and starting energy. As a result, the entire graph has shifted upwards on the y-axis.
Worst-Case Scenario
The results so far seemed promising, so it was time we stress the system. How long will the device last if it’s in a very poorly lit environment 100W/m^2 assuming 4V starting voltage. I’ll compare the result to a 400mAh battery.
- 60F Capacitor: ~8 Days
- 400mAh Battery: >100 Days
Conclusion & Future Work
Under ideal conditions, a 50 F to 100 F Li-Ion capacitor is sufficient to store most or all of the energy generated in a single sunny day. However, this is not enough to store surplus energy across multiple sunny days, and energy reserves are quickly depleted if sunlight is scarce.
Future work.
I have some follow-up actions as a result of this analysis.
- Add remaining system loads (e.g. MCU, sensors, various quiescent)
- Factor in energy harvester efficiency and boost efficiency
- Re-evaluate how many days of operation without sun are “enough”
For now, Li-Ion capacitors seem a viable option, but I’ll hold off on final judgment until the full system profile is modeled.
Discussions
Become a Hackaday.io Member
Create an account to leave a comment. Already have an account? Log In.