Meshtastic devices are incredibly powerful for creating long-range, mesh-networked telemetry solutions. However, managing and visualizing telemetry data from these devices can become challenging when you need to analyze trends or spot anomalies. This is where Telemetry Harbor and Grafana come into play. In this guide, we'll walk you through how to push telemetry data from your Meshtastic node to Telemetry Harbor and visualize it in Grafana. We’ll also explore how Telemetry Harbor’s new Harbor AI feature can help you interact with your data in a whole new way.
Why Push and View Meshtastic Data on Grafana?
Integrating Meshtastic with Telemetry Harbor and Grafana gives you powerful tools to visualize and analyze your device data in real-time. Here’s why you should consider using this setup:
- Centralized Data Collection: With Telemetry Harbor, you can centralize all your Meshtastic telemetry data. This makes it easier to manage, access, and analyze, especially when dealing with large deployments.
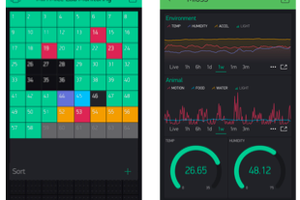
- Real-Time Insights: Grafana provides real-time dashboards that enable you to monitor device health, sensor data, and network performance at a glance.
- Customizable Dashboards: Grafana allows you to create tailored dashboards to visualize telemetry data. You can track individual device metrics, analyze trends, and create heatmaps or interactive maps to visualize location data.
Getting Started with Telemetry Harbor
Let’s walk through how to get started and push your first data point to Telemetry Harbor. We’ll follow the official documentation, and you can always check the latest guide here: Getting Started Guide.
Step 1: Create Your Account
- Go to the Sign Up page.
- Fill in your details and create your account.
- Check your inbox for a verification email.
- Click the verification link to activate your account.
- After activation, log in to your account.
- Now, head to the Harbor Page.
Step 2: Set Up Your Harbor
- In the top right corner, click on Create Harbor.
- Give your harbor a name.
- Choose the harbor type. For now, select the General type (custom types like GPS or temperature data will be added soon).
- Choose your Harbor Specifications. If you want to use the free tier, select Free.
- Click Create Harbor to finish setting up your harbor.
- After creating your harbor, the harbor list will update, and you’ll see your new harbor listed.
- Click View Details to access essential information like the API Endpoint, API Batch Endpoint, API Key, Grafana Endpoint, Grafana Username, and Grafana Password.
Step 3: Get Your API Key and Endpoint
- Find the API Batch Endpoint and API Key.
- Copy the API Key and API Batch Endpoint. Keep these handy for the next step.
Step 4: Push Your First Data Point
To push data from your Meshtastic node, follow these steps:
- Clone the Meshtastic Integration Repository: Clone/Download the repository:
https://github.com/TelemetryHarbor/harbor-meshtastic - Install the Required Dependencies: Install the dependencies by running:
pip install -r requirements.txt - Run the Application: Run the app using
python app.py.
After running the application, ensure that:
- Put your API Key and API Batch Endpoint we copied ealier.
- Select the COM Port for your Meshtastic device. Ensure your device is connected and the correct port is selected.
- Click Start to begin pushing data.
After starting the application, check the logs to confirm data is being sent successfully. The logs should display messages like this:
Data for node ... successfully sent to Telemetry Harbor
💡
This Python code is a work in progress, and any pull requests (PRs) are welcomed.
Step 5: View Your Data
- Go back to the Harbor Details page.
- Copy the Grafana Password and open the Grafana Endpoint.
- Log in using your Grafana Username (this will be the same as your Telemetry Harbor email) and the ...
 Adrelien
 Khalilone62
 Mrigank Pawagi
 George Sun
 Lex Kravitz