 Freeday82
How i've done it
First steps (translated)
The first prompt was pretty simple:
I want to display my blood sugar levels on an ESP32 WROOM. These are stored as API data on Nightscout. Should be accessed every 5 minutes via WLAN
You can find them at https://nghtsct--XXXXXXXXX.code.run/api/v1/entries
Can you write me the code for esp32?
WLAN data is:
SSID: XXXXX
Password: XXXXXX
This gave me my first code to start from:
#include <WiFi.h>
#include <HTTPClient.h>
#include <ArduinoJson.h>

// WLAN-Daten
const char* ssid = "XXXXXX";
const char* password = "XXXXXX";

// Nightscout-API-URL mit Parameter, um nur den neuesten Eintrag abzurufen
const char* apiUrl = "https://nghtsct--XXXYYYZZZ.code.run/api/v1/entries.json?count=1";

// Intervall für das Abrufen der Daten (in Millisekunden)
const unsigned long fetchInterval = 5 * 60 * 1000; // 5 Minuten
unsigned long lastFetchTime = 0;

void setup() {
  // Serial Monitor starten
  Serial.begin(115200);
  delay(100);

  // WLAN verbinden
  Serial.println("Verbinden mit WLAN...");
  WiFi.begin(ssid, password);

  while (WiFi.status() != WL_CONNECTED) {
    delay(500);
    Serial.print(".");
  }

  Serial.println("\nWLAN verbunden!");
  Serial.print("IP-Adresse: ");
  Serial.println(WiFi.localIP());
}

void loop() {
  unsigned long currentTime = millis();

  // Prüfen, ob das Intervall abgelaufen ist
  if (currentTime - lastFetchTime >= fetchInterval) {
    fetchBloodSugarData();
    lastFetchTime = currentTime;
  }
}

void fetchBloodSugarData() {
  if (WiFi.status() == WL_CONNECTED) {
    HTTPClient http;

    Serial.println("\nVerbinde mit der API...");
    http.begin(apiUrl);

    // GET-Anfrage senden
    int httpResponseCode = http.GET();

    if (httpResponseCode == HTTP_CODE_OK) {
      // Antwort lesen
      String response = http.getString();
      Serial.println("API-Antwort erhalten, Blutzuckerwert extrahieren...");

      // JSON-Dokument parsen
      DynamicJsonDocument doc(1024);
      DeserializationError error = deserializeJson(doc, response);

      if (!error) {
        // Annahme: Die Antwort ist ein Array mit mindestens einem Eintrag
        if (doc.size() > 0) {
          float sgv = doc[0]["sgv"].as<float>();
          Serial.print("Aktueller Blutzuckerwert: ");
          Serial.println(sgv);
        } else {
          Serial.println("Keine Einträge gefunden.");
        }
      } else {
        Serial.print("Fehler beim Parsen der JSON-Antwort: ");
        Serial.println(error.c_str());
      }
    } else {
      Serial.print("Fehler beim Abrufen der Daten. HTTP Response Code: ");
      Serial.println(httpResponseCode);
    }

    // Verbindung schließen
    http.end();
  } else {
    Serial.println("WLAN-Verbindung verloren!");
  }
}
I then copied the code into Arduino Studio & asked to show the output in Serial Monitor & to update to show WLAN connection status and the API data in Serial Monitor
Then, it's all a matter of personal taste. I got back the data shown in the serial monitor screenshot picture and asked to convert units from mg/dl (used mainly in the US) to mmol/l (used by me :p).
Fine Tuning
From there it was a matter of asking the right questions & giving instructions to the GPT.
Here's some examples:
"Show me the actual value, centered and large" and then iteration after iteration:
Make the value large and the unit smaller, add distance from the borders to avoid cutting text off by the rounded display corners, add a trend arrow using the API "trend" data that is delivered with the values, make the arrow twice as large, use colors over and under specific values...
Here's an API sample, changed to anonymize:
| _id | "67a7fe613703f575bxxxx" |
| sgv | 132 |
| date | 1739062860372 |
| dateString | "2025-02-09T01:01:00.372Z" |
| trend | 4 |
| direction | "Flat" |
| device | "share2" |
| type | "sgv" |
| utcOffset | 0 |
| sysTime | "2025-02-09T01:01:00.372Z" |
| mills | 1739062860372 |
The most fascinating part
For me, the most fascinating thing was the bottom half which shows the last 10 values as a trend diagram. It was SO spectacularly easy to "program" and was done in minutes:
Prompt:
The API contains the last 10 values. Can these be displayed graphically in the...Read more »
 tom Meyers
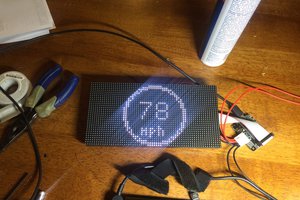
 Neal
Neal
 Jerry Isdale
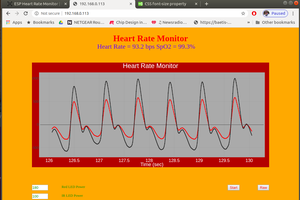
 markwarren.ee