 Tony Francis
Have you ever wondered how scientists analyze the chemical composition of materials without destroying them? One powerful technique is Fourier Transform Infrared (FTIR) Spectroscopy, and at its heart lies a fascinating principle: wave interference.
Let's break down how simple sine waves, when combined, can lead us to understand the complex signals measured by an FTIR spectrometer.
The Dance of Simple Waves: Interference Basics
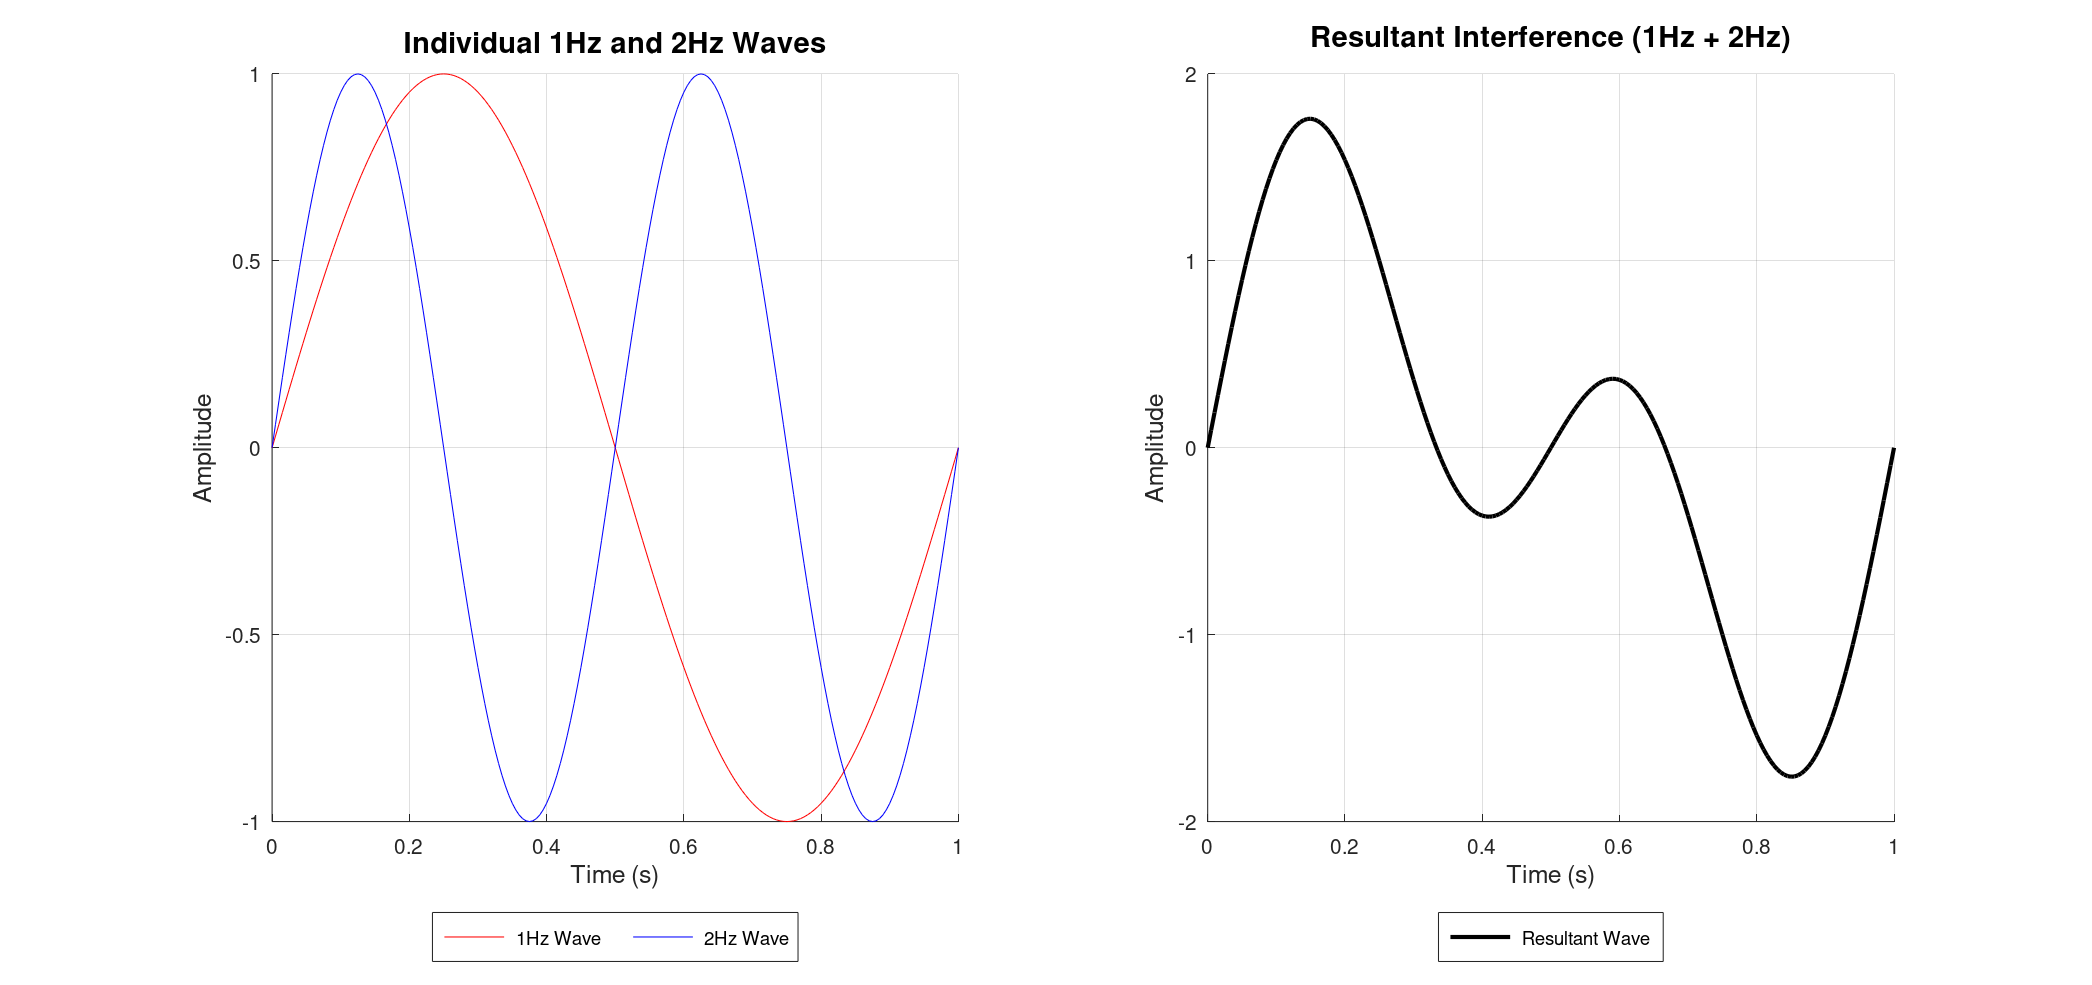
Imagine two simple sine waves, one at 1 Hz and another at 2 Hz. When these waves travel through the same space, they interact, or "interfere." This interference is simply the sum of their amplitudes at every point in time.
If you were to plot these individual waves and then their sum, you'd see how their peaks and troughs align (constructive interference) or cancel out (destructive interference), creating a new, more complex waveform.
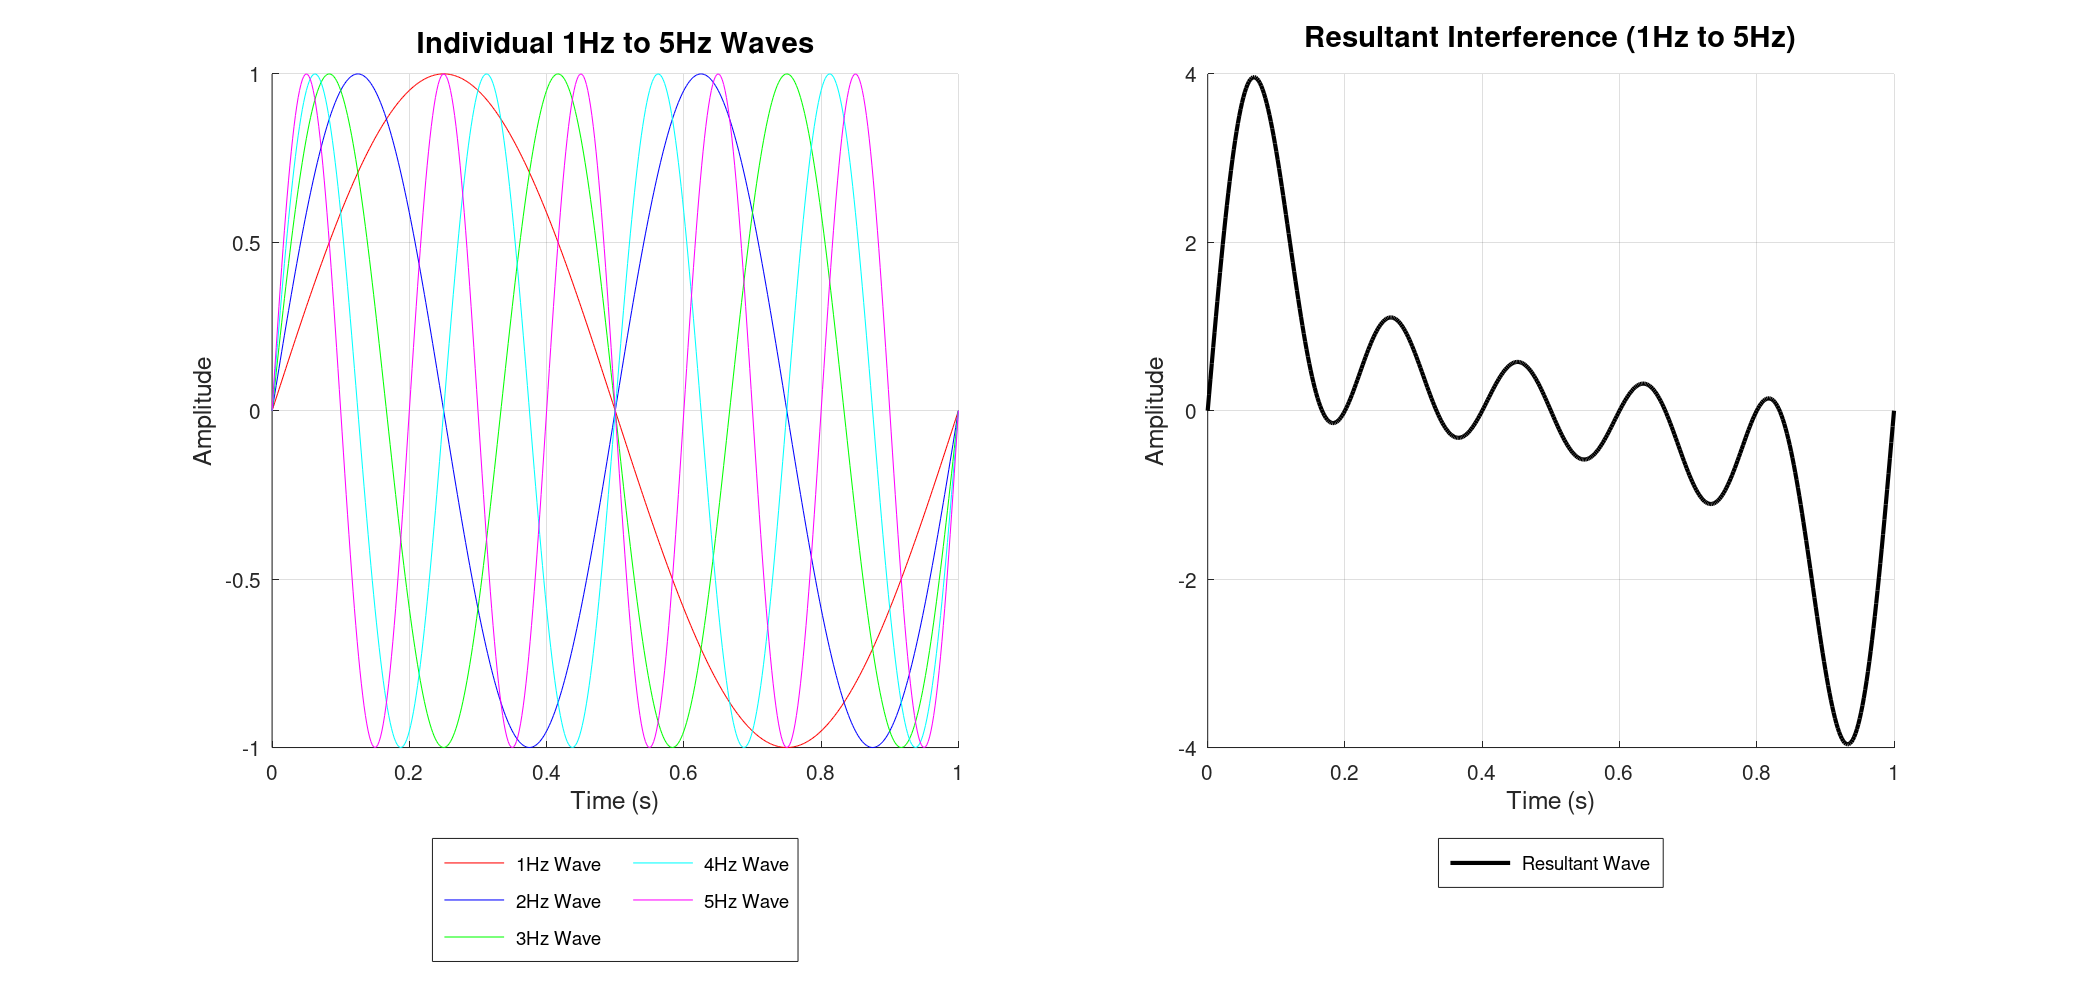
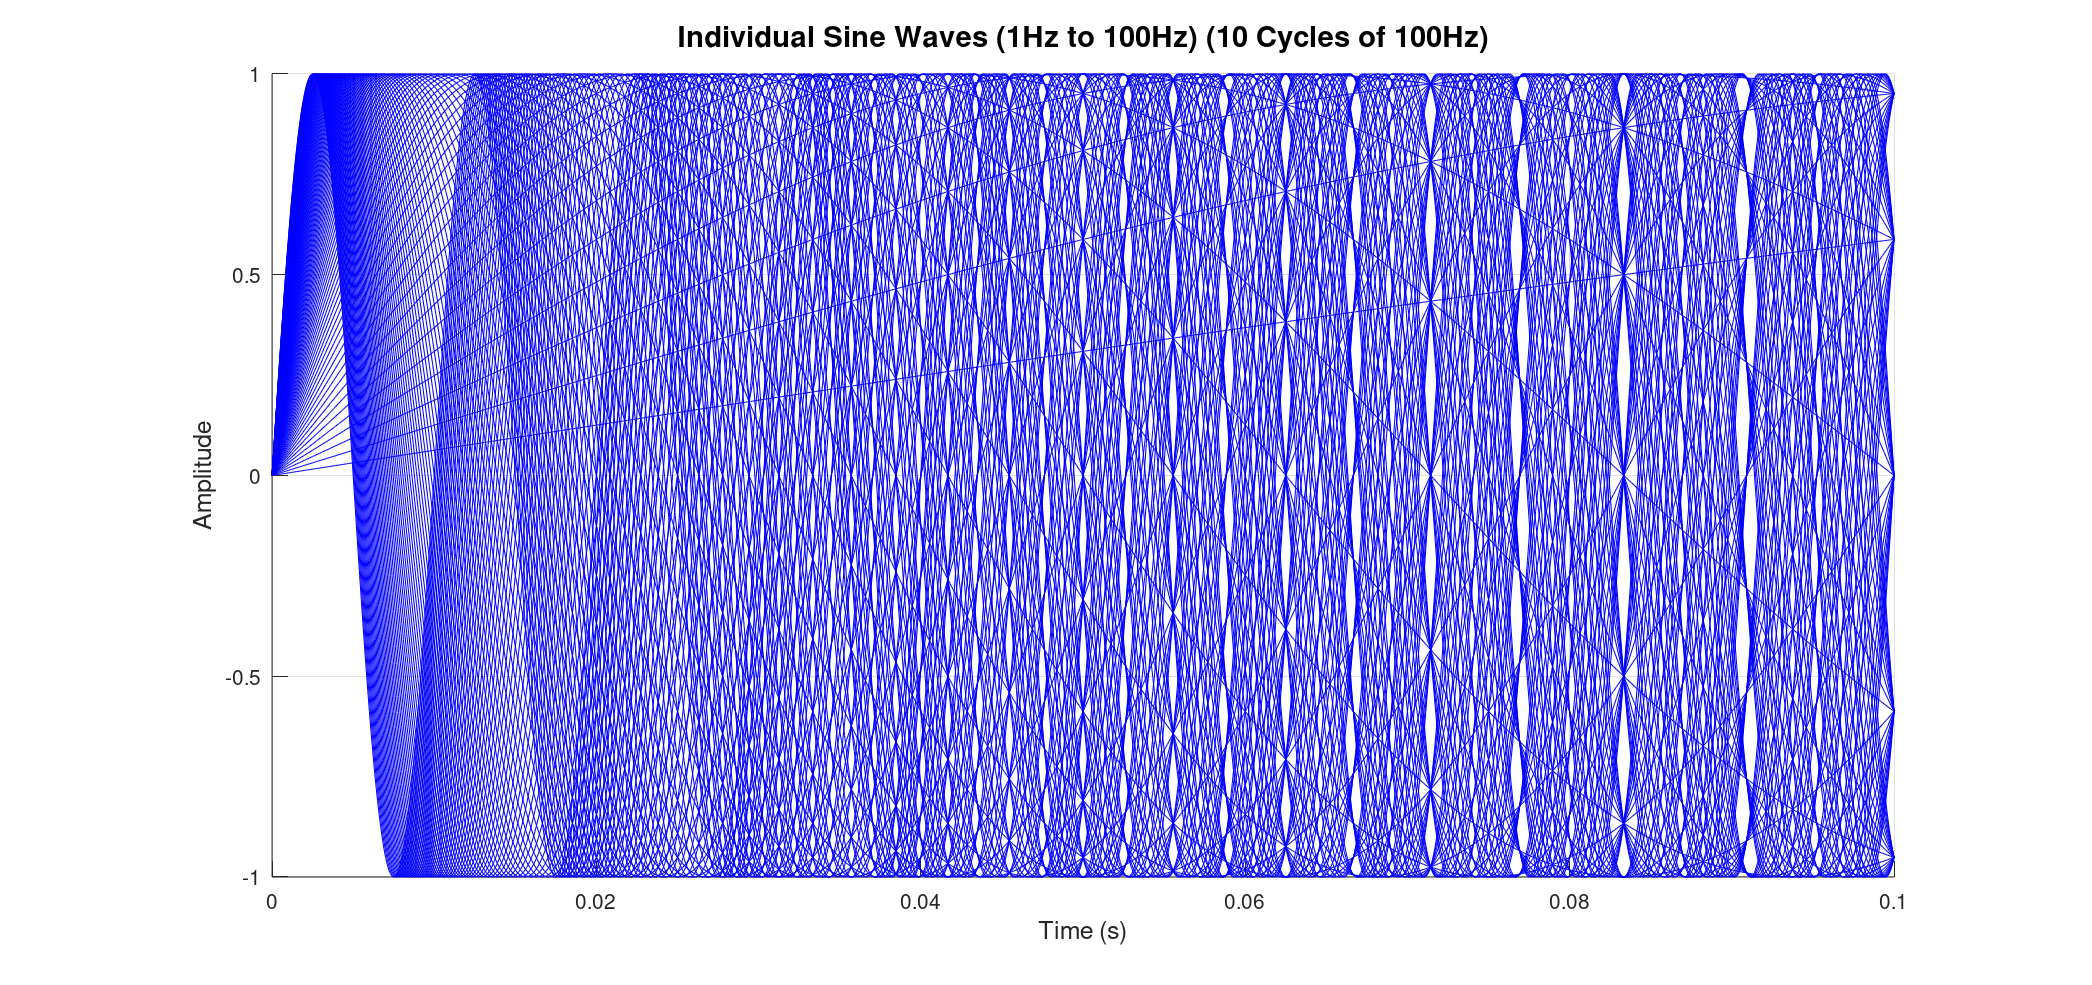
As we add more and more sine waves – say, from 1 Hz up to 5 Hz and even 1 Hz to 100 Hz – the resultant waveform becomes progressively more intricate. Each additional frequency contributes its unique oscillation, making the combined signal look less like a simple wave and more like a chaotic squiggle.
Building Complexity: From Many Waves to a "Fingerprint"
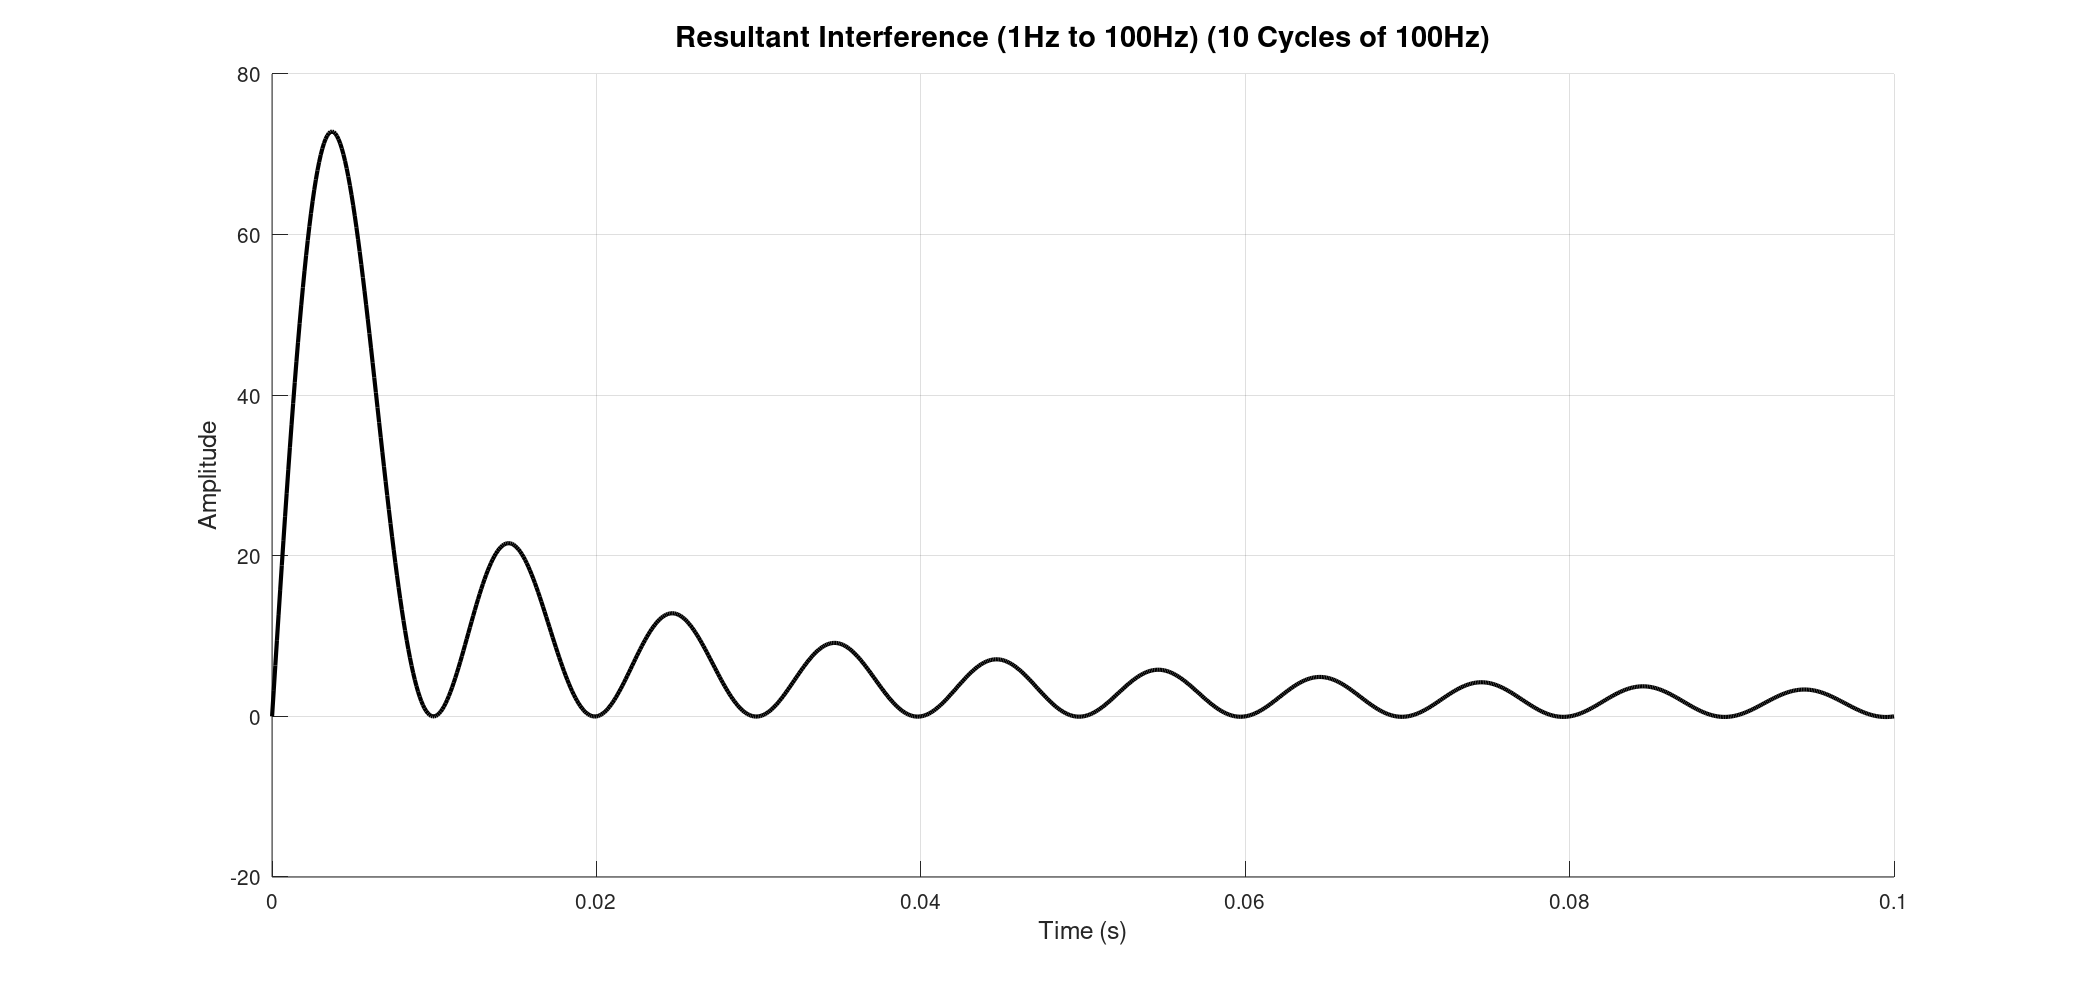
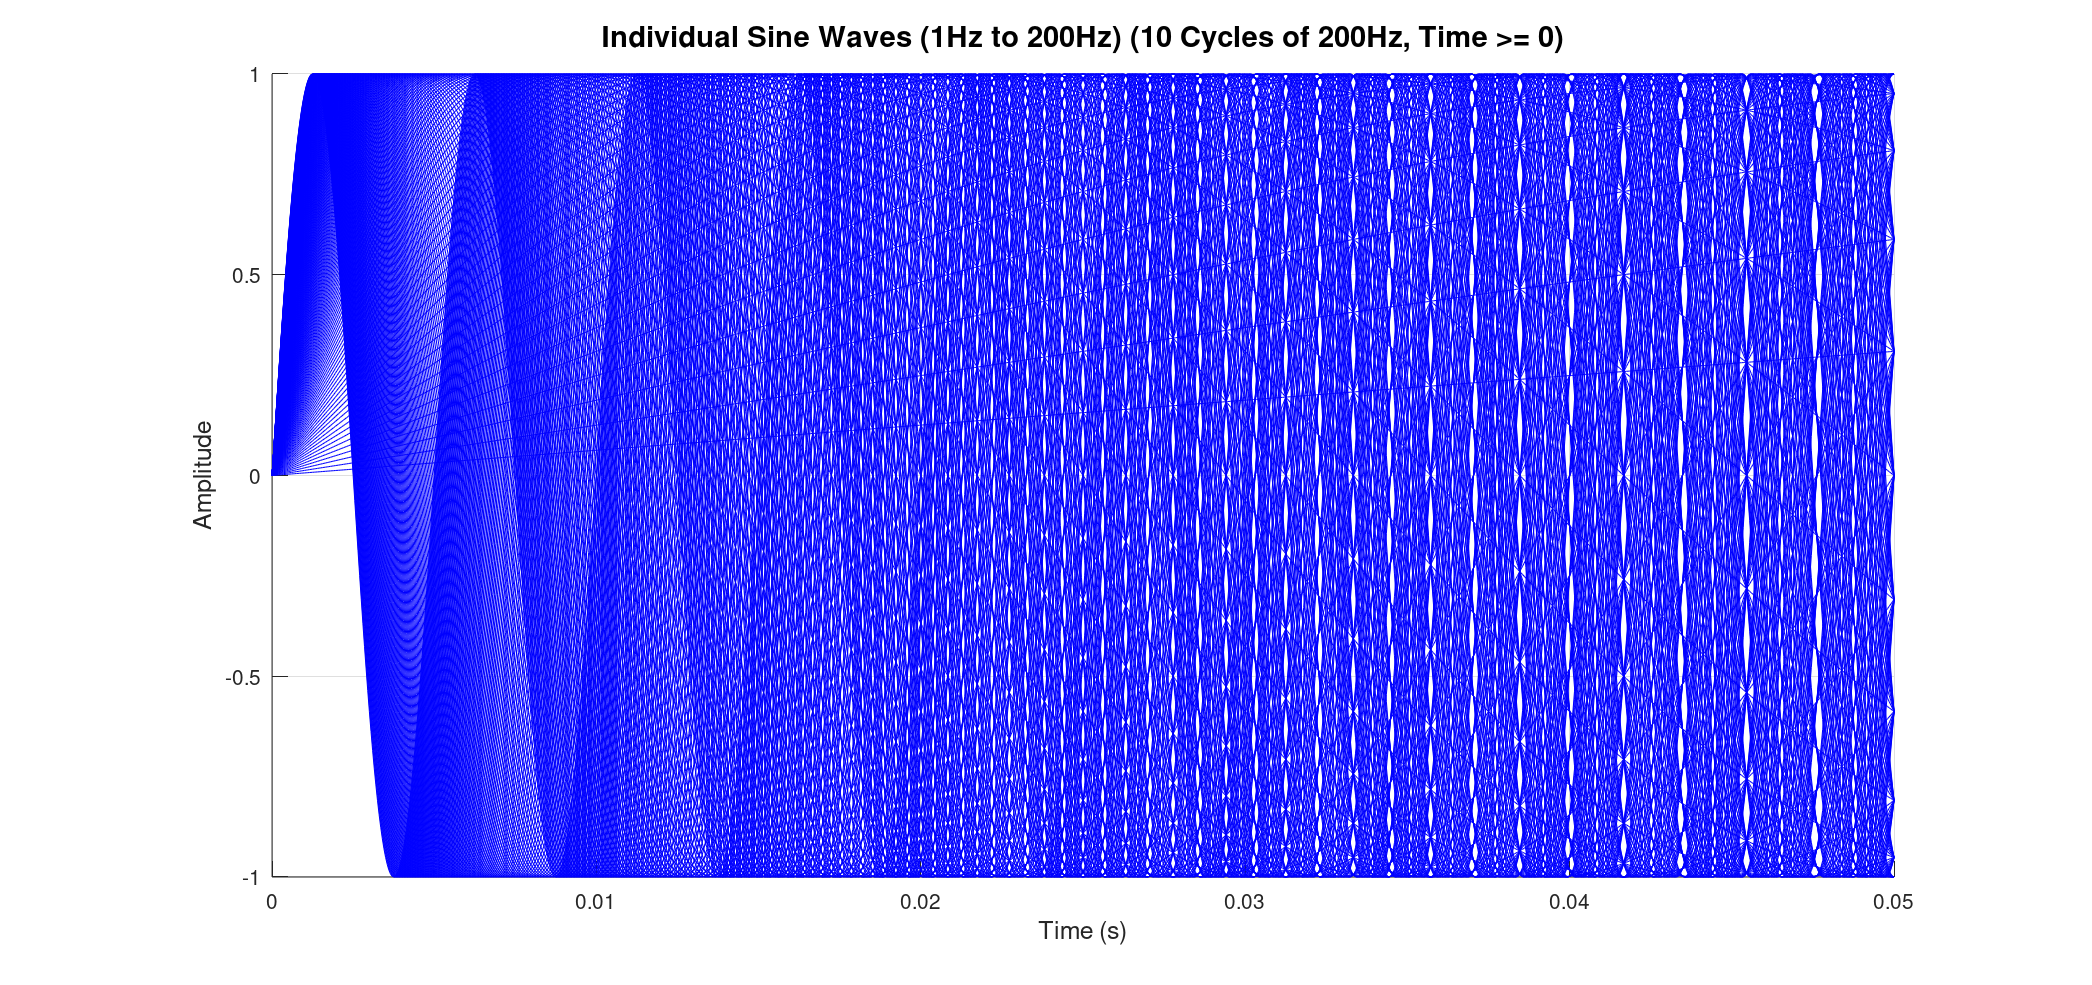
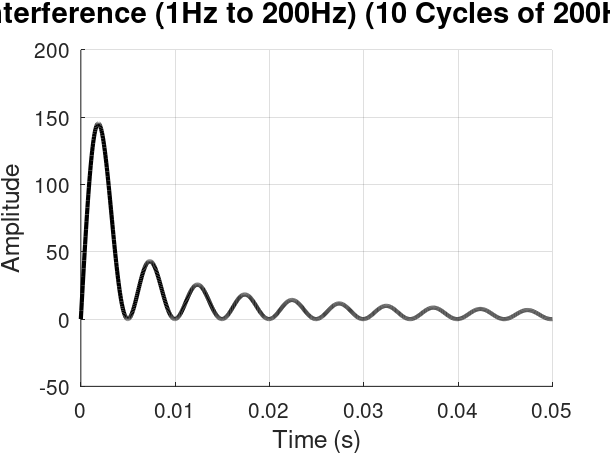
Consider summing a vast number of sine waves, from 1 Hz all the way up to 200 Hz, each at 1 Hz intervals. When we plot all these individual waves, they appear as a dense, almost solid band of blue lines, showcasing the sheer volume of oscillations contributing to the final signal. The resultant sum, while still a single black line, is now incredibly complex, reflecting the combined energy of all those frequencies.
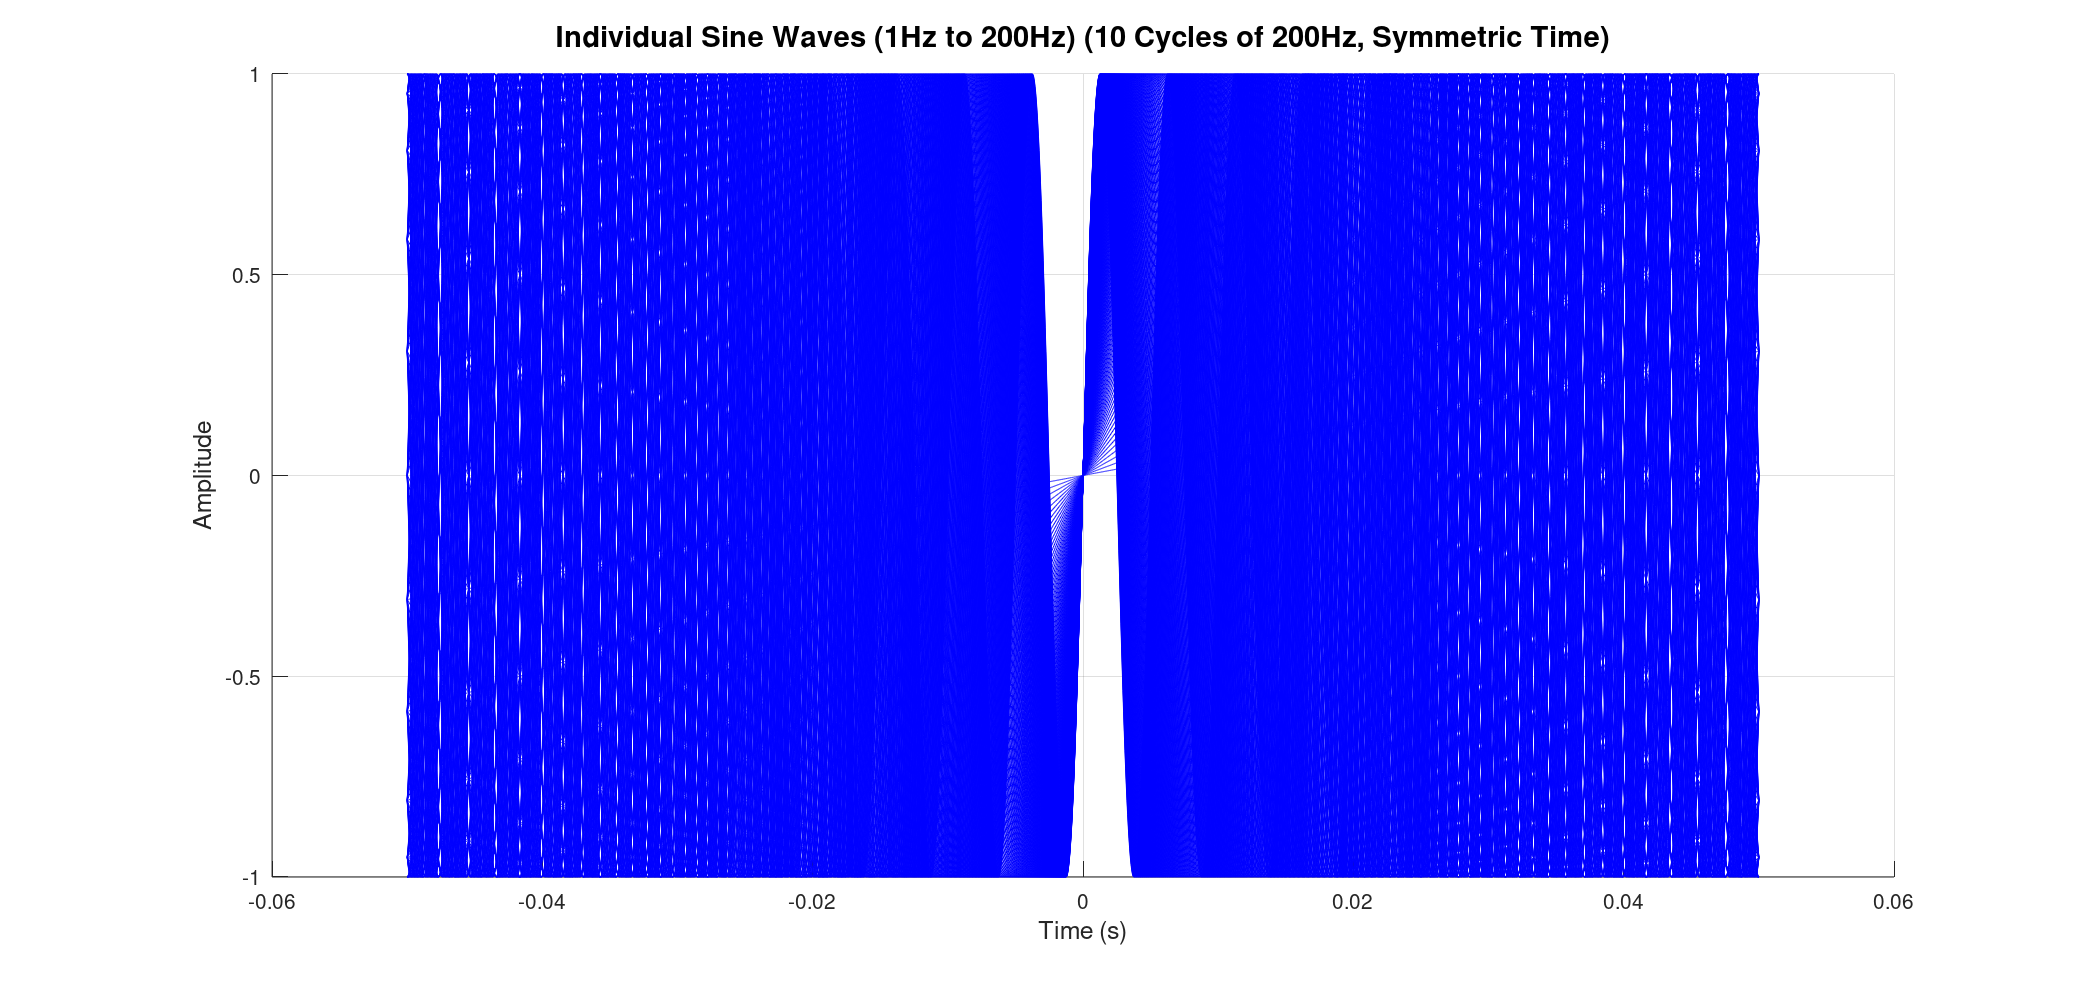
Previously, we might have plotted these waves starting from time zero and extending for a certain duration. However, for FTIR, a symmetric time base is essential. This means our time axis extends from a negative value, passes through zero, and continues to a positive value (e.g., from -0.05 seconds to +0.05 seconds for our 1-200Hz example, based on 10 cycles of the 200Hz wave).
Why symmetric? This directly relates to the core of an FTIR spectrometer: the Michelson interferometer. In this device, a beam of light is split, travels different path lengths, and then recombines. The "time" axis in our plots is analogous to the optical path difference (OPD) between the two arms of the interferometer.
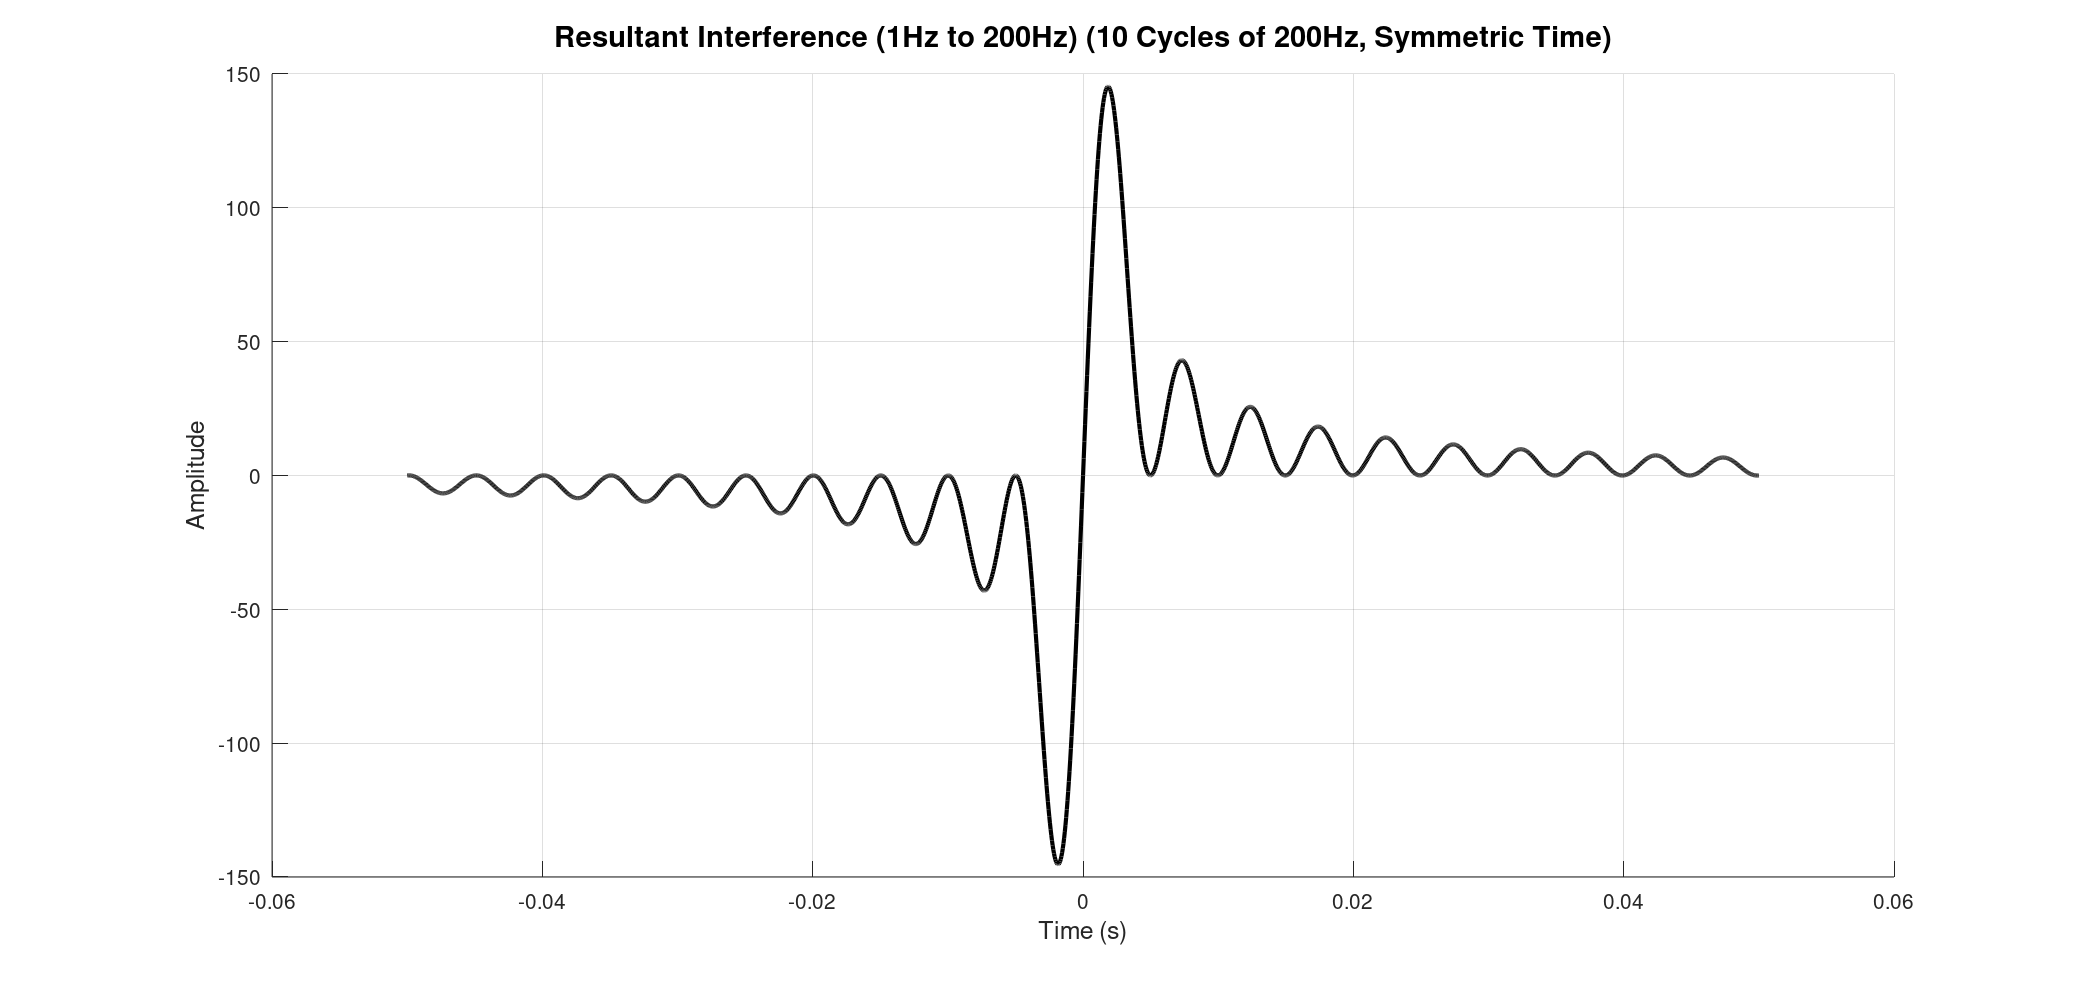
Zero Path Difference (ZPD). At this point, all the individual waves, regardless of their frequency, are perfectly in phase and constructively interfere. This creates a very strong, central peak in the resultant interference signal. As the optical path difference moves away from zero (either positively or negatively), the waves start to fall out of phase, leading to destructive interference and a rapid decrease in the signal's intensity. This unique signal, with its prominent central peak and decaying oscillations, is what we call an interferogram
From Interferogram to Spectrum: The Power of Fourier Transform
The magic of FTIR lies in its ability to convert this complex interferogram into a chemically meaningful spectrum. This transformation is achieved using a mathematical tool called the Fourier Transform (FT).
Imagine our interferogram, , as a function of the optical path difference, δ. This interferogram is essentially the sum of many individual cosine waves, each corresponding to a specific frequency of light that passed through the sample. A simplified representation could be:
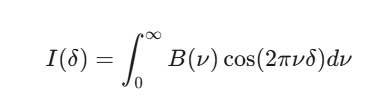
Where:
- is the intensity of the interferogram at a given optical path difference δ.
- B(ν) is the spectral intensity at wavenumber ν (which is directly related to frequency).
- cos(2πνδ) represents the individual cosine waves that sum up.
To get the spectrum, B(ν), from the interferogram, I(δ), we perform the inverse Fourier Transform:
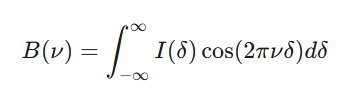
In practice, a fast Fourier transform (FFT) algorithm is used by the spectrometer's computer to perform this calculation. The result is a plot of intensity (or absorbance/transmittance) versus wavenumber (or frequency), which is the characteristic spectrum of your sample. This spectrum acts like a unique "fingerprint," allowing scientists to identify and quantify the chemical components present in a material.
By understanding how simple waves combine and how the time base in our plots mirrors the optical path difference in an interferometer, we can grasp the fundamental principles that make FTIR spectroscopy such a powerful analytical technique.
Discussions
Become a Hackaday.io Member
Create an account to leave a comment. Already have an account? Log In.