 Tony Francis
In our last post, we explored how simple sine waves can combine to create complex interference patterns, and we briefly touched upon the magic of the Inverse Fast Fourier Transform (IFFT) to reconstruct a signal from its frequency components. Today, we're flipping the script! We'll dive deeper into the Fast Fourier Transform (FFT) to see how it allows us to dissect a complex interference signal and reveal its constituent frequencies and their individual strengths. Think of it as a powerful lens that transforms a jumbled waveform into a clear "fingerprint" of its underlying vibrations.
Part 1: The Symphony of Uniform Amplitudes 🎶
Let's start with a foundational example. Imagine we have ten pure sine waves, ranging in frequency from 1 Hz to 10 Hz. Crucially, each of these waves has the exact same amplitude (intensity).
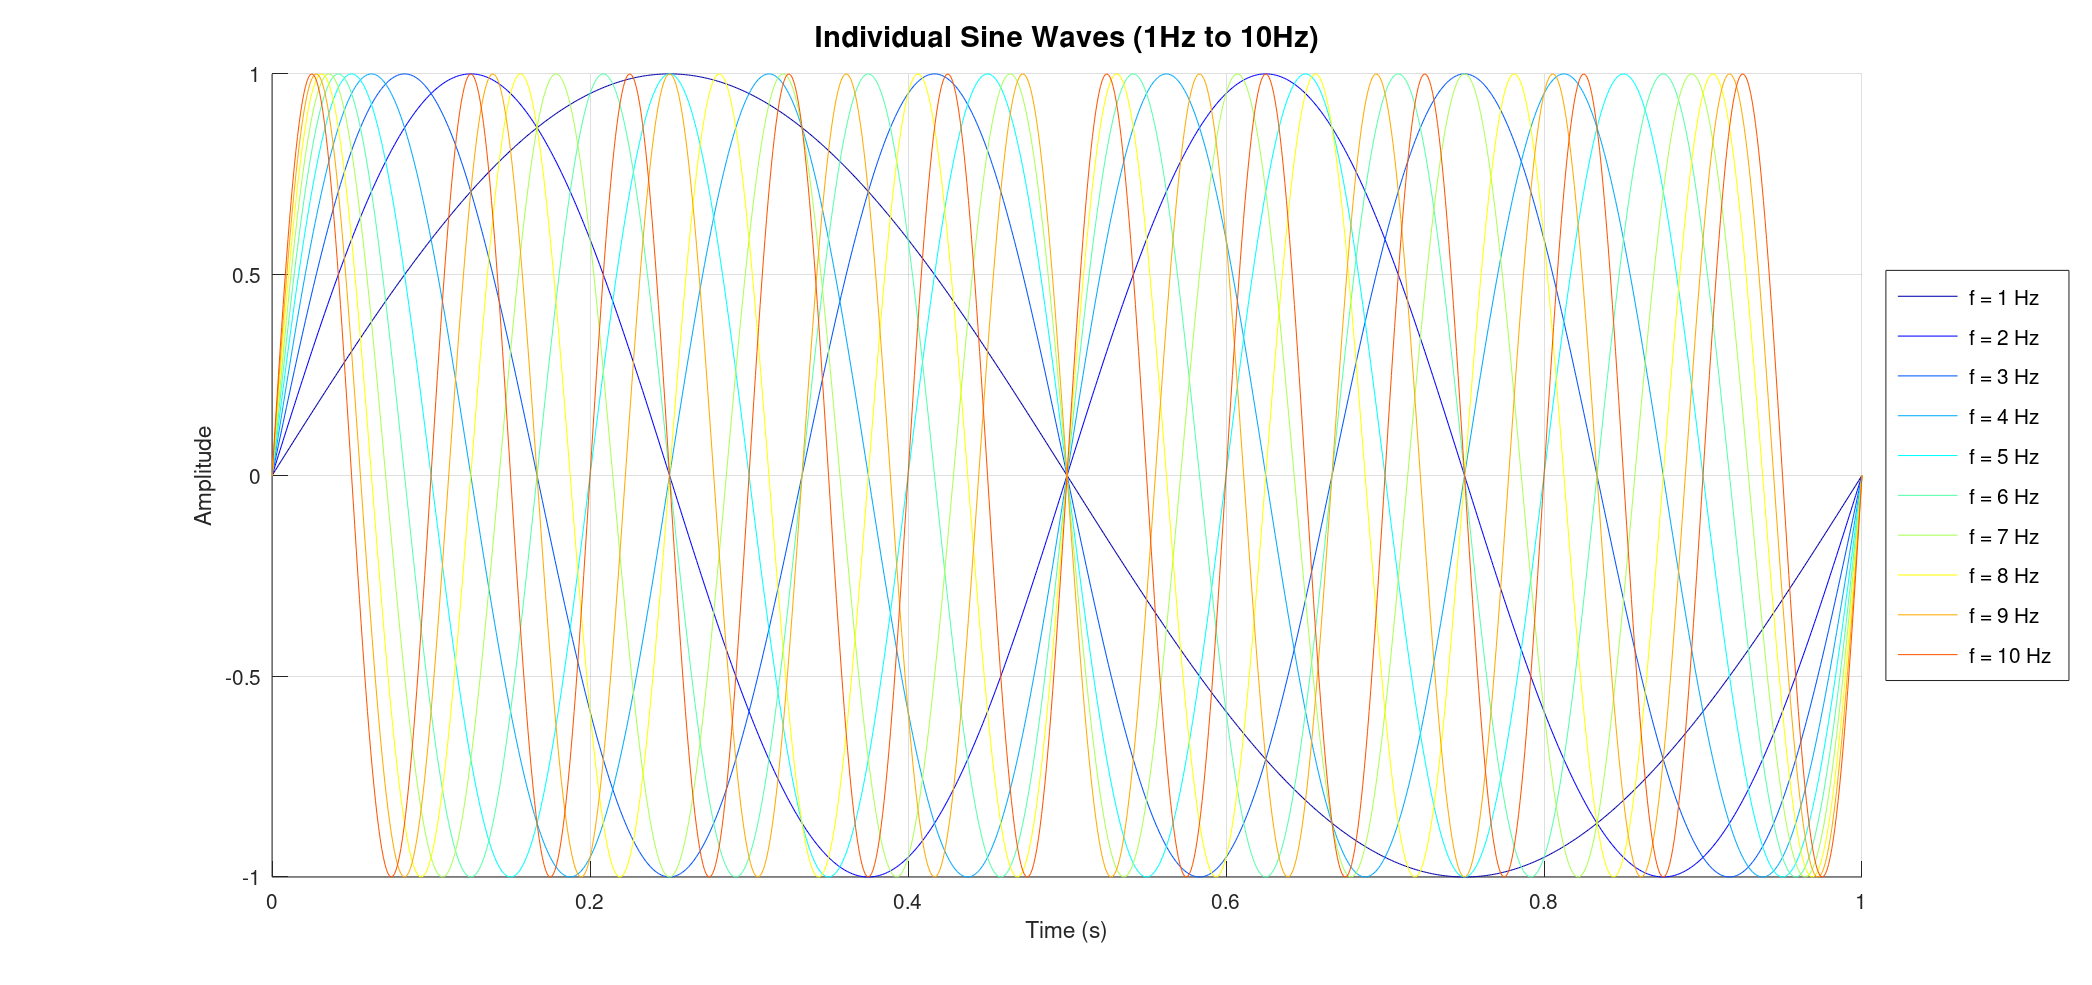
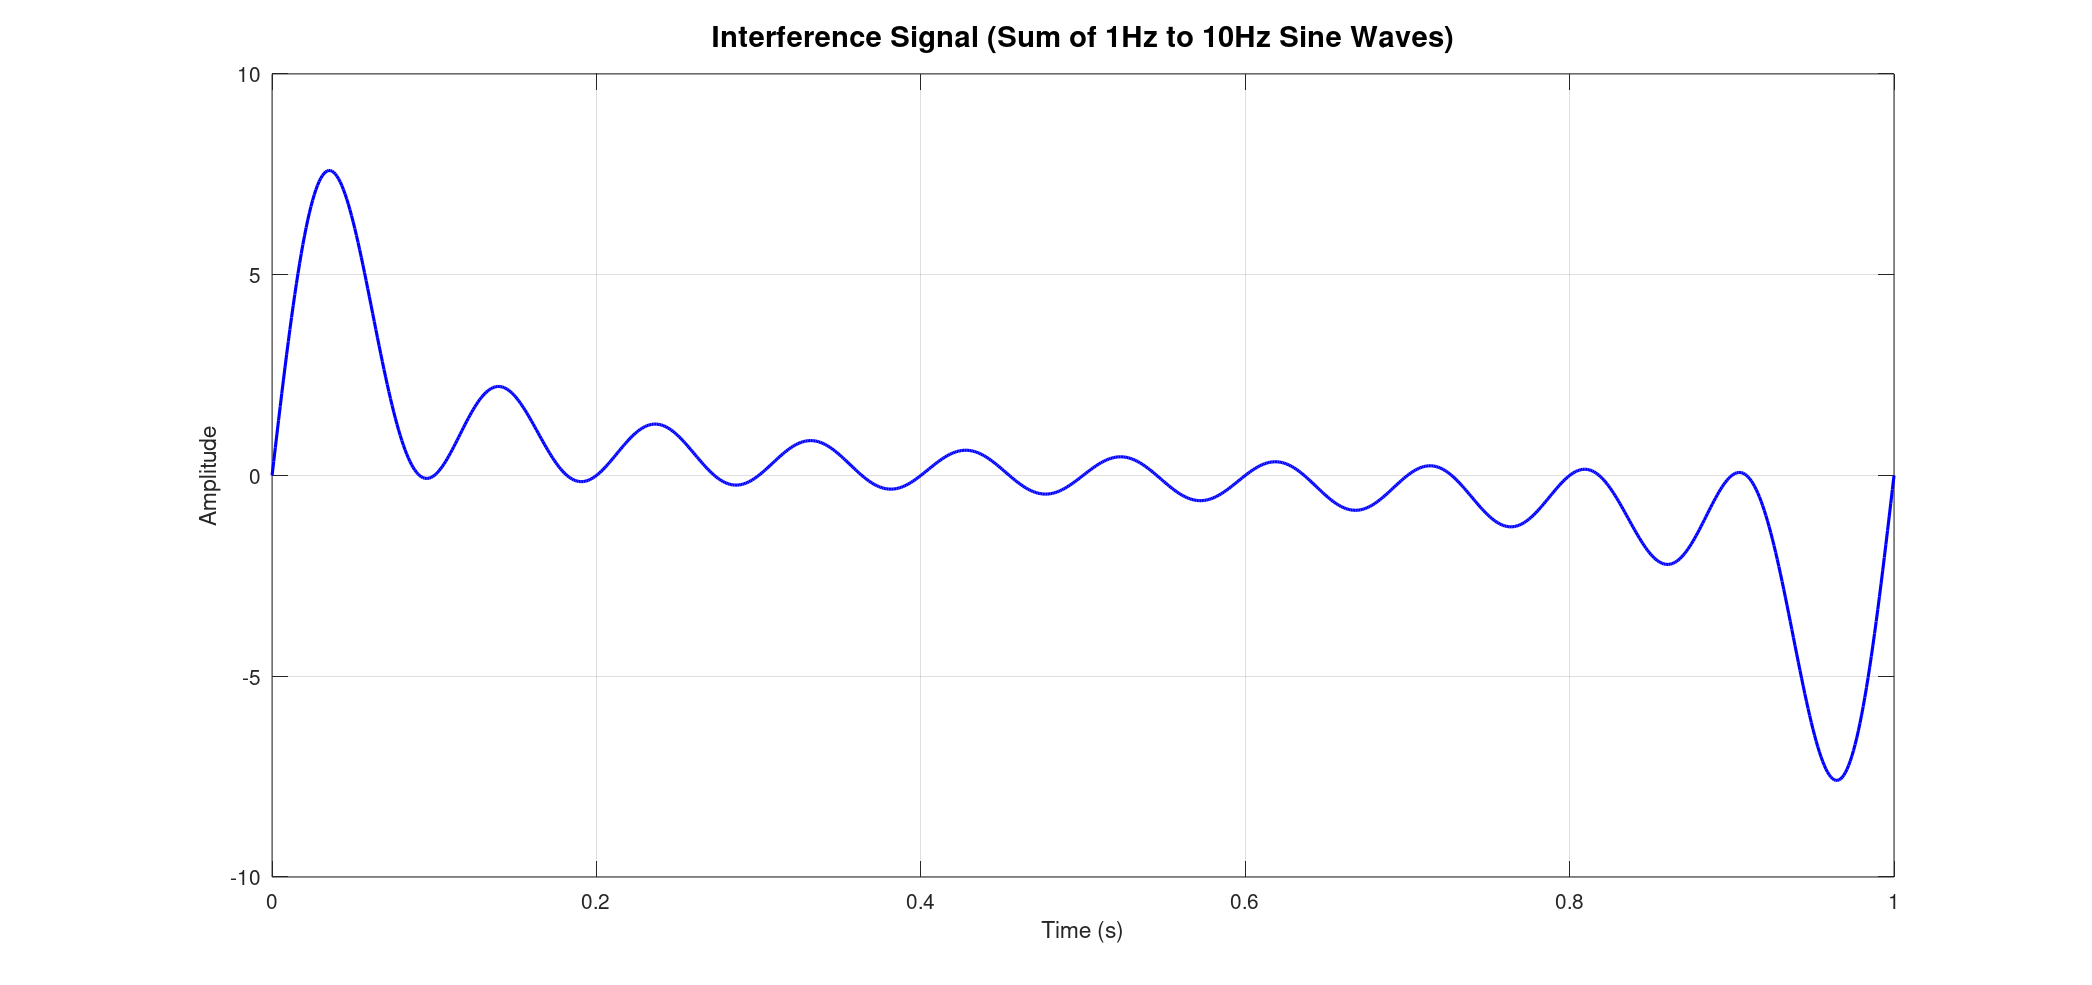
When these ten waves combine, they create a fascinating, yet seemingly chaotic, interference pattern. This resulting signal is the sum of all individual waves, oscillating in a complex dance.
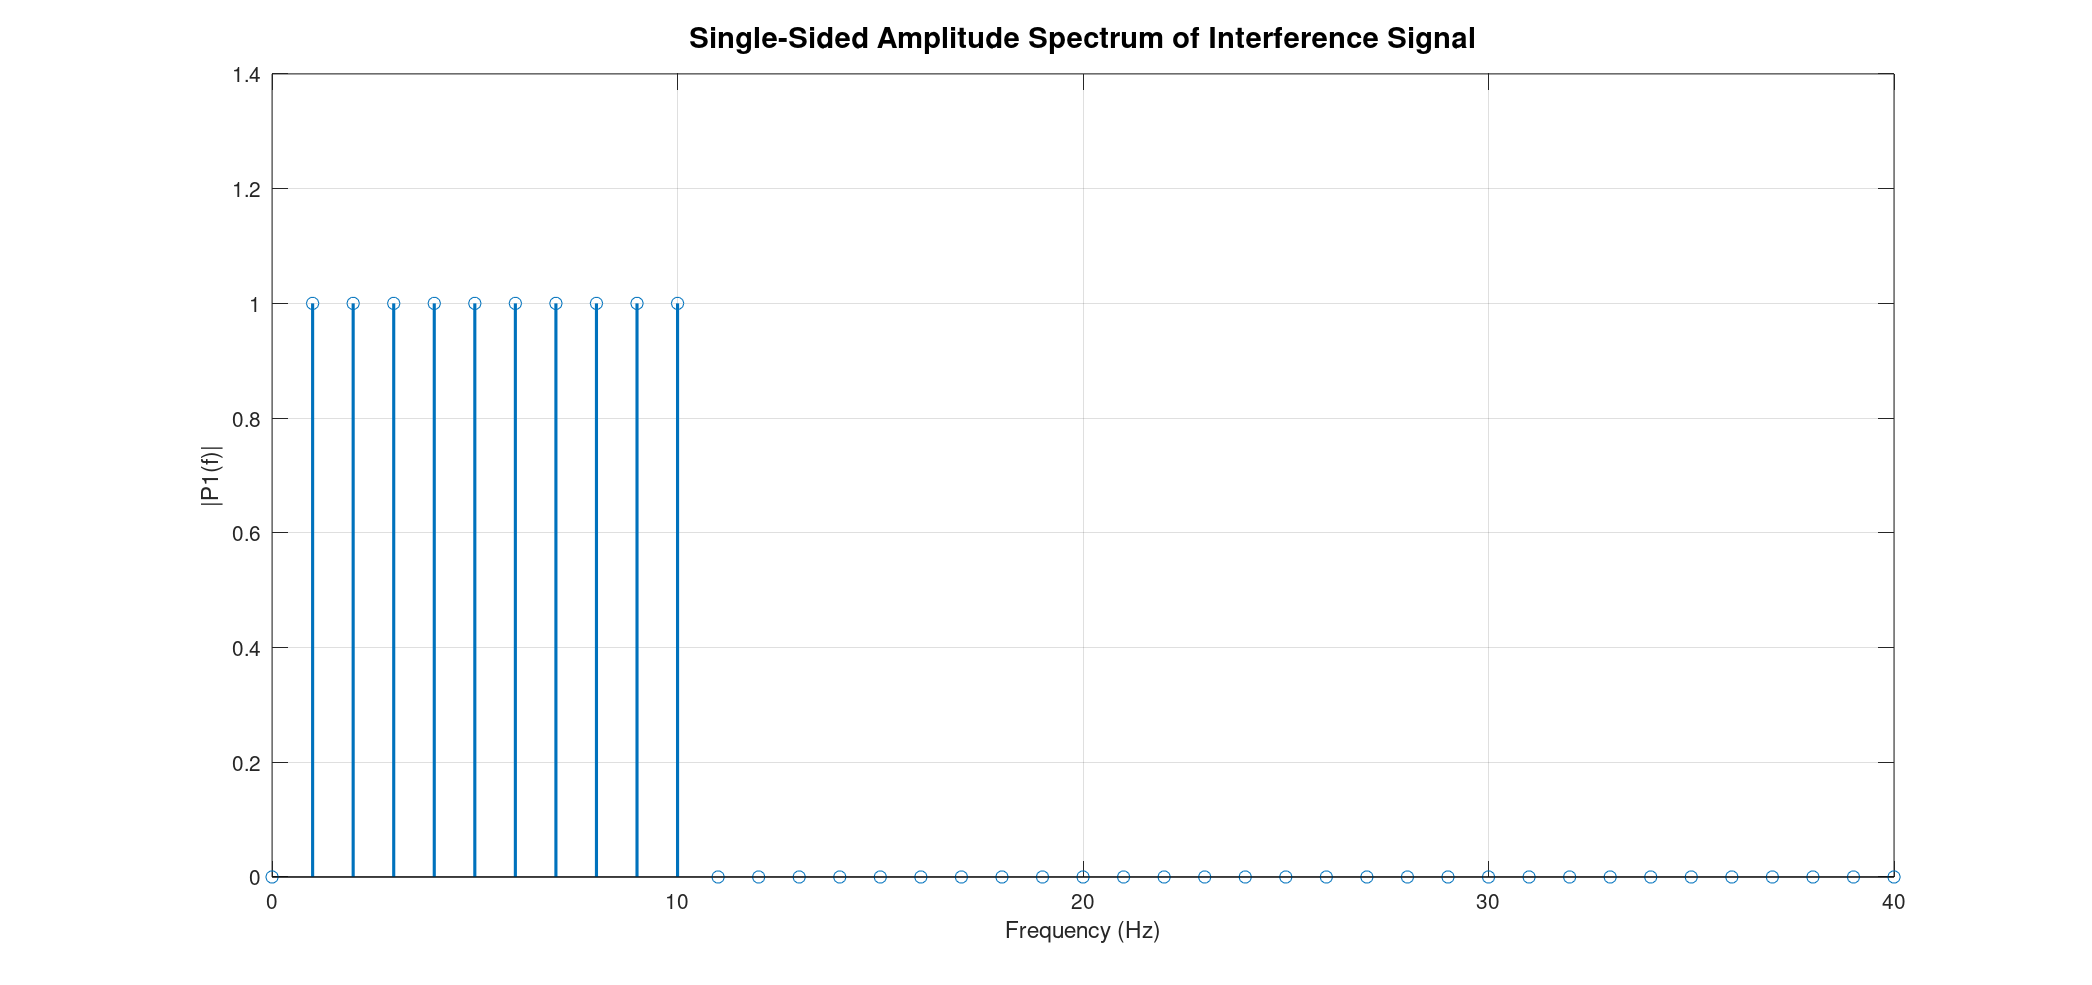
Now, for the big reveal! When we apply the FFT to this interference signal, the results are remarkably clear. The FFT transforms the signal from the time domain (how amplitude changes over time) to the frequency domain (what frequencies are present and how strong they are). What we see is a series of 10 distinct vertical lines at precisely 1 Hz, 2 Hz, 3 Hz, and so on, up to 10 Hz. The height of each line directly corresponds to the amplitude of that specific sine wave in the original signal. Since all our initial sine waves had uniform amplitudes, all these lines in the FFT plot will have the same height, beautifully demonstrating their equal contribution to the interference.
Part 2: Decoding Variable Intensities with FFT
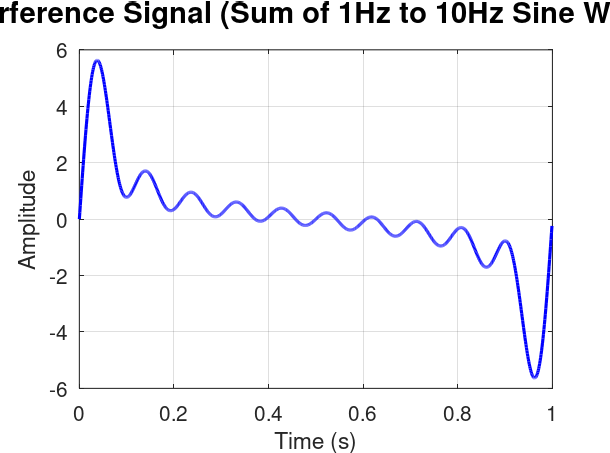
The real power of FFT shines when the individual components of our signal aren't so uniform. What if each of our 1 Hz to 10 Hz sine waves had a different amplitude? For instance, the 1 Hz wave might be very strong, while the 10 Hz wave is much weaker.
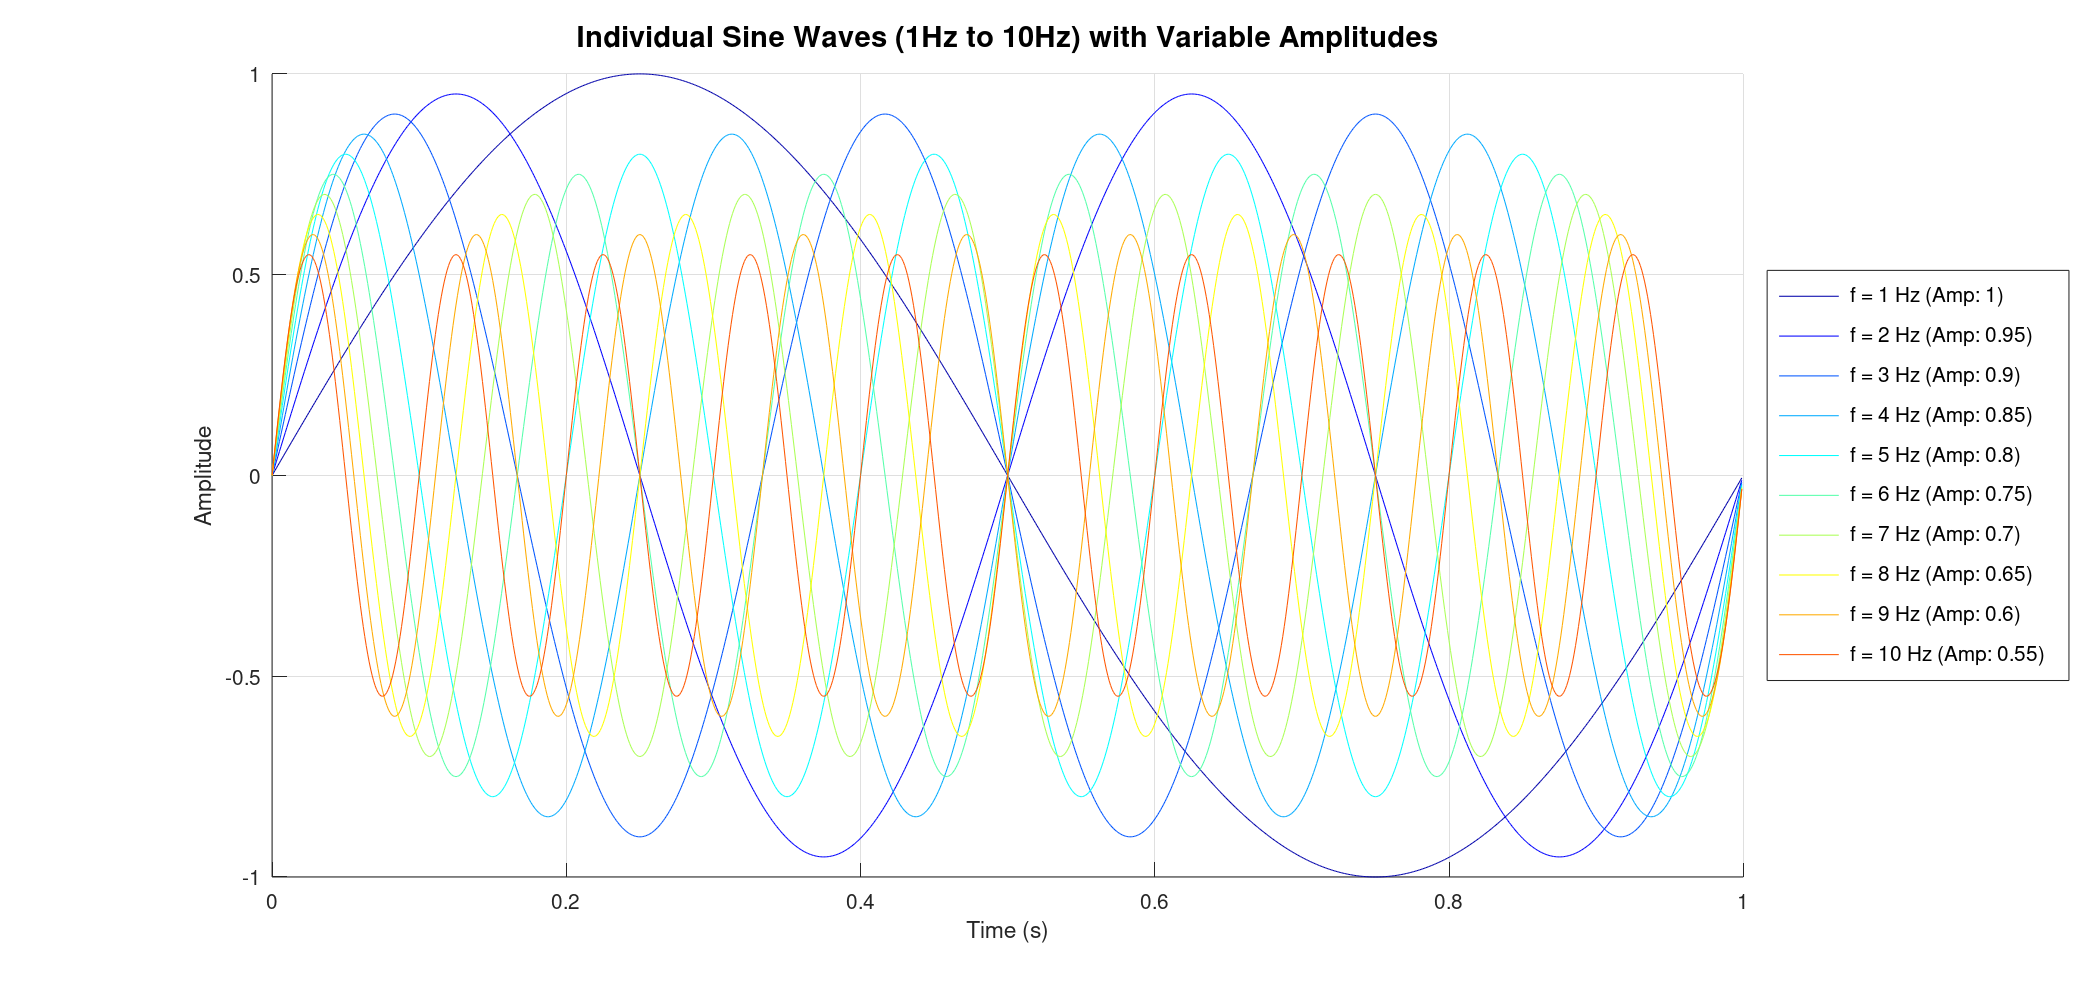
When these variable-amplitude waves interfere, the resulting signal still looks complex, but its shape is now influenced more heavily by the stronger frequency components.
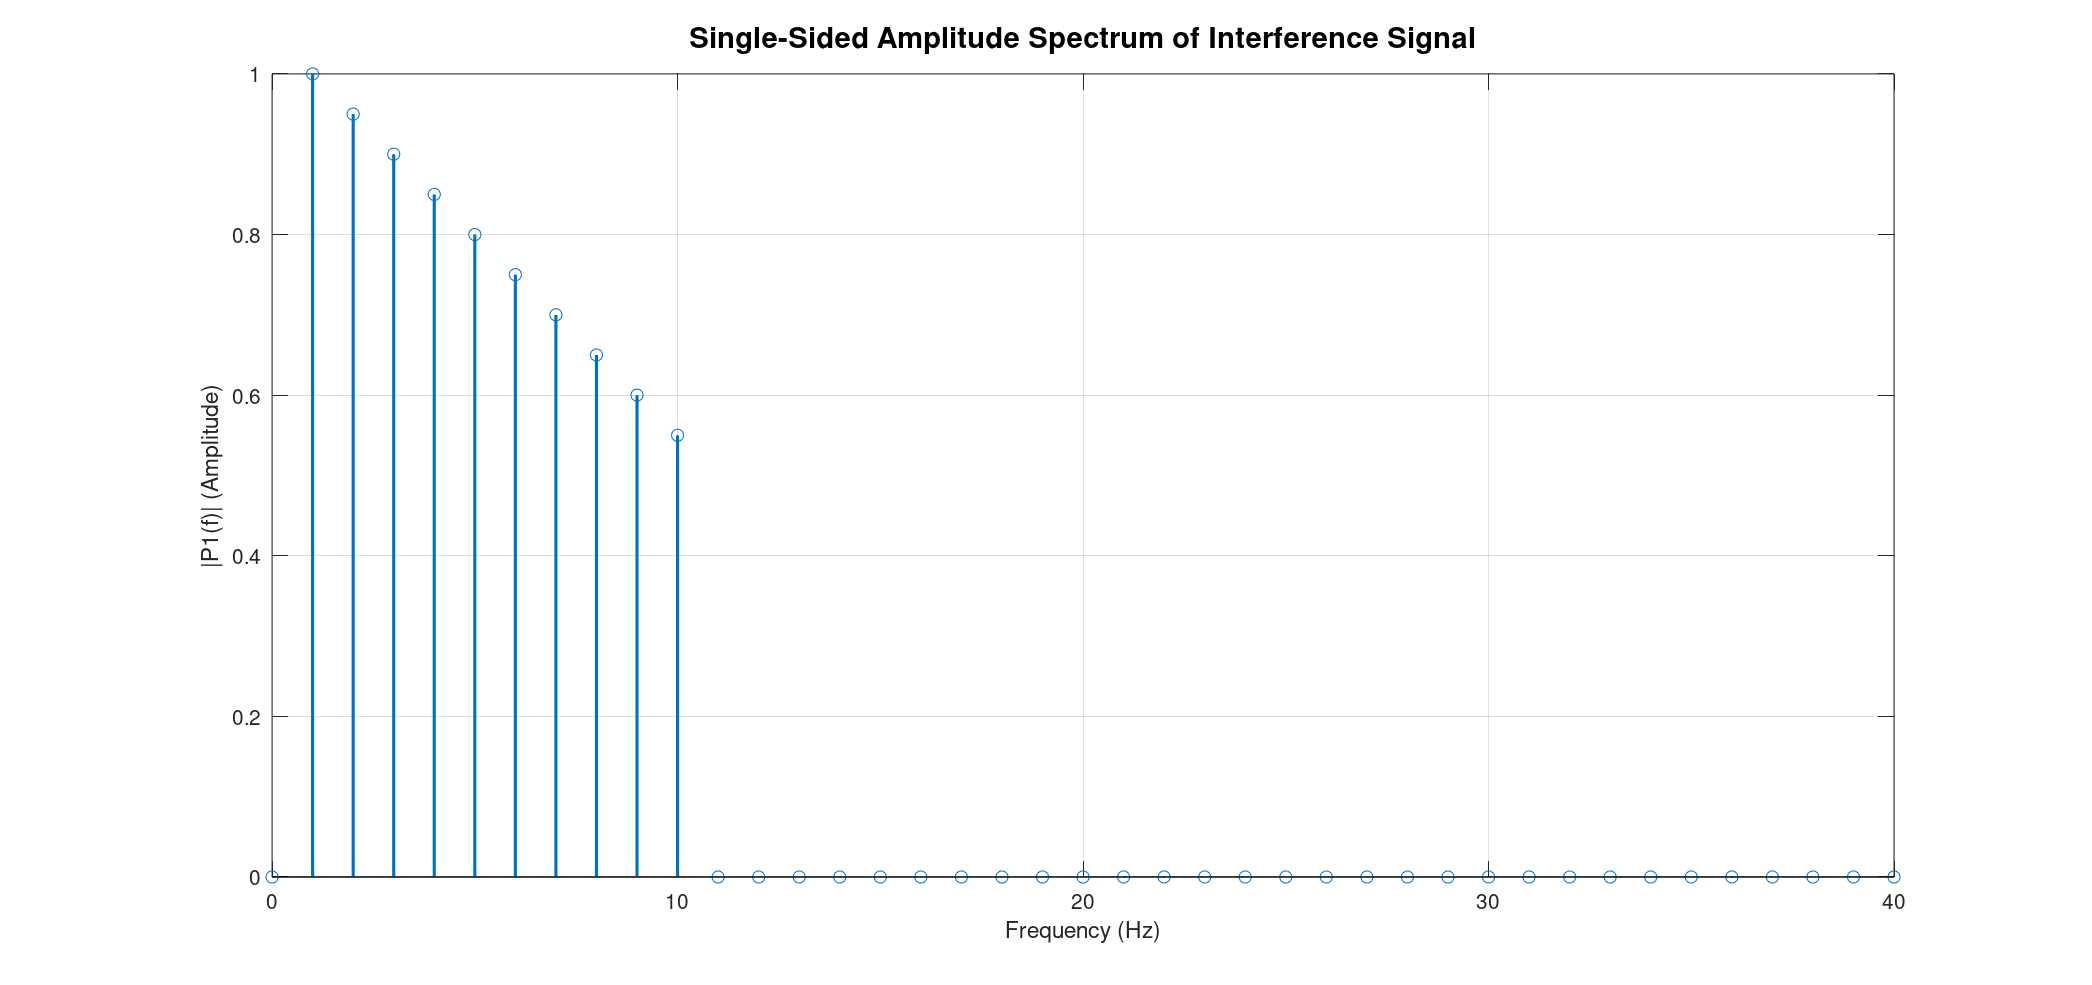
Applying the FFT to this new interference signal is where it gets truly exciting! Just like before, we'll see distinct lines at each frequency (1 Hz to 10 Hz). However, this time, the height of each line will vary, directly reflecting the unique amplitude of each sine wave in the original mix. This is incredibly powerful! In applications like spectroscopy, this varying amplitude in the frequency domain is analogous to absorbance levels, where the intensity of a peak tells us how much of a particular substance is present or how strongly it interacts at that specific frequency. The FFT allows us to quantify these "absorbance levels" without needing to isolate each individual wave.
The Fast Fourier Transform is an indispensable tool in signal processing, allowing us to decompose complex time-domain signals into their fundamental frequency components. Whether the amplitudes are uniform or varying, the FFT provides a clear and quantitative representation of the spectrum, making it invaluable for everything from audio analysis to scientific measurements where understanding "absorbance" or signal strength at specific frequencies is key.
This principle is at the heart of techniques like Fourier-Transform Infrared (FTIR) Spectroscopy. In FTIR, an interferometer creates an interferogram (much like our interference signal), which is a time-domain representation of how a sample absorbs different infrared wavelengths. The raw interferogram is then fed into an FFT algorithm, which transforms it into an infrared spectrum. This spectrum reveals distinct peaks at specific infrared frequencies, and the intensity (or "absorbance") of these peaks directly corresponds to the unique vibrational modes of the molecules within the sample, allowing for precise chemical identification and quantification. Our simple sine wave example beautifully illustrates the fundamental mathematical operation that underpins this powerful analytical technique.
Discussions
Become a Hackaday.io Member
Create an account to leave a comment. Already have an account? Log In.