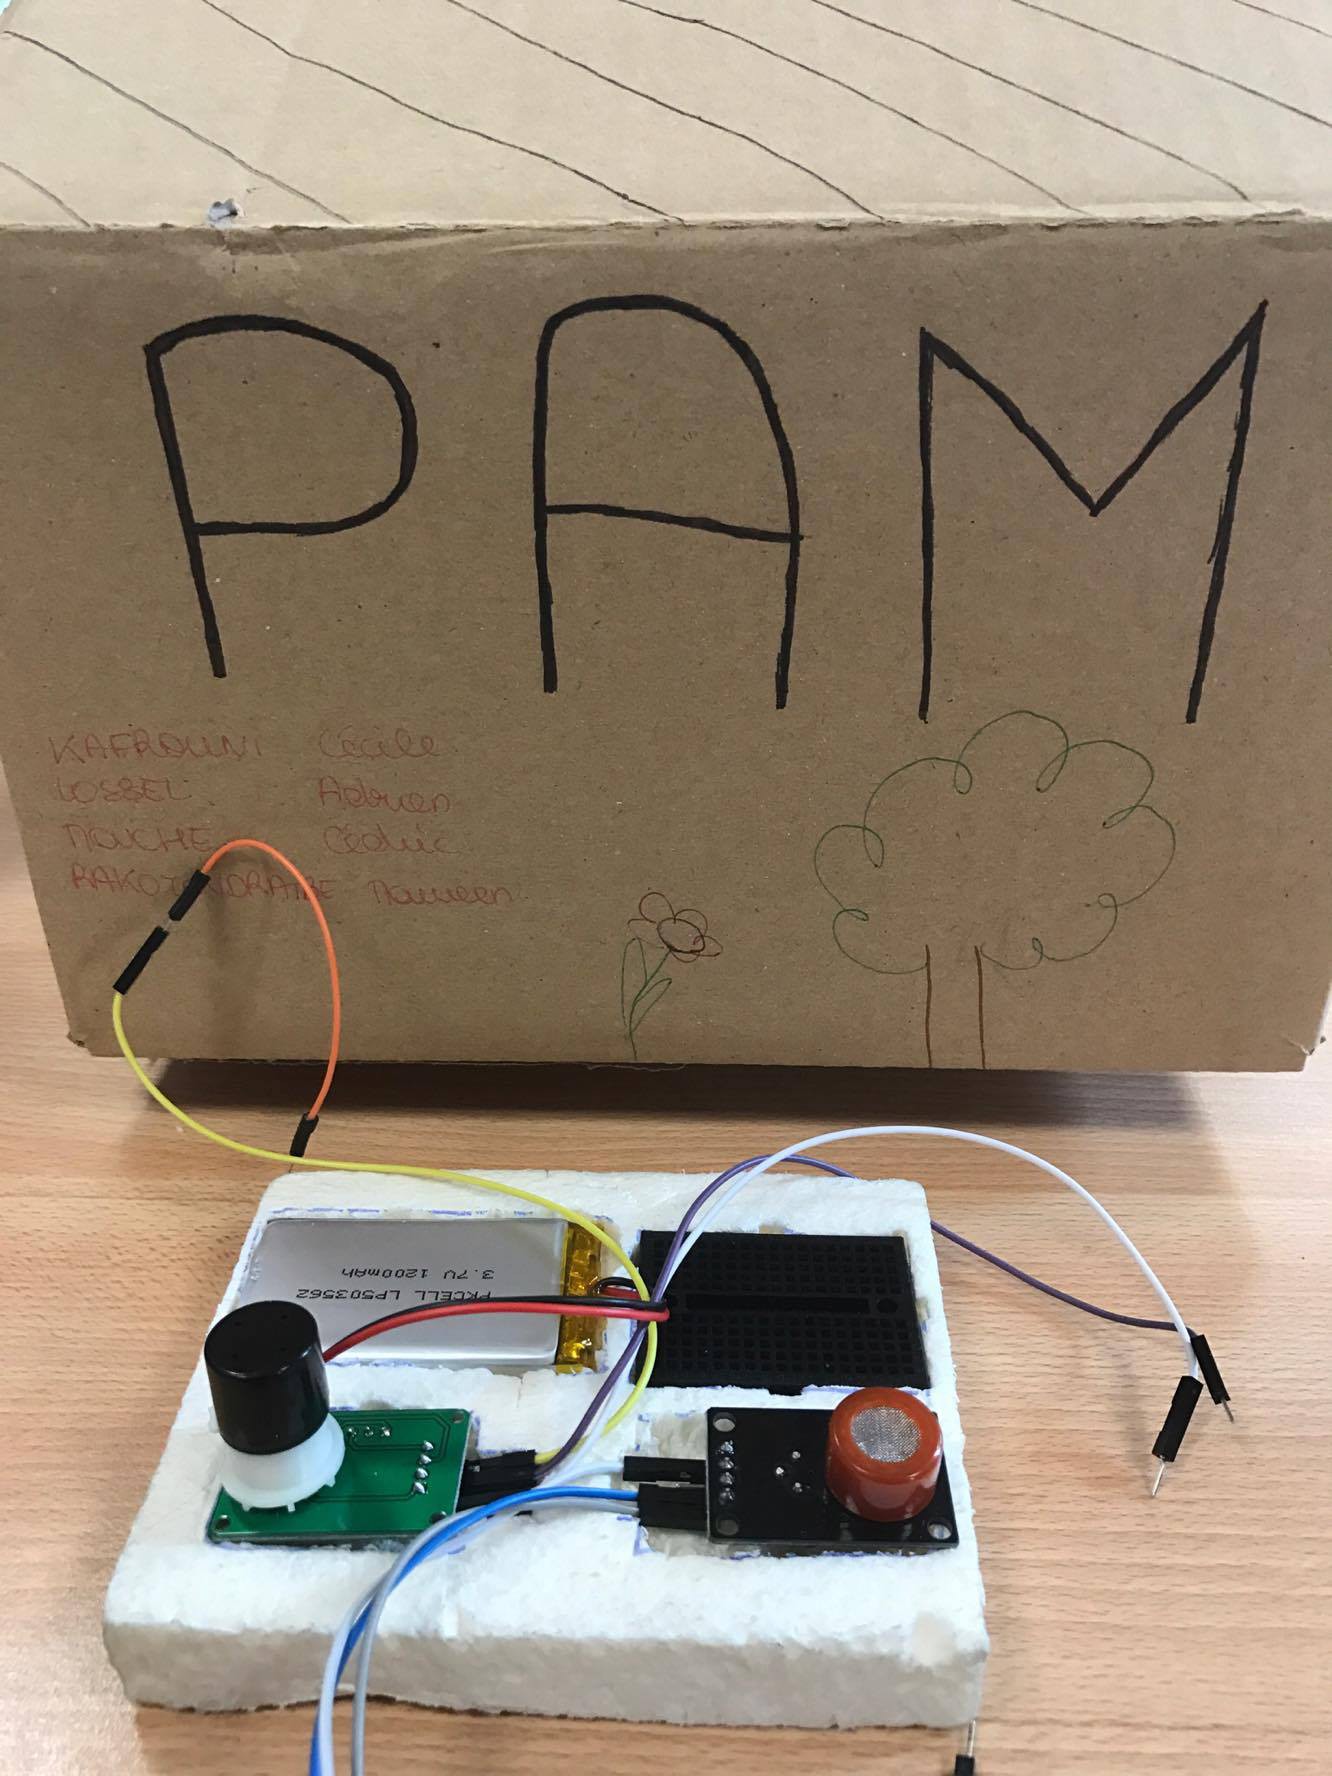
To make the experience fit your profile, pick a username and tell us what interests you.
We found and based on your interests.
Well, this is the end of our sessions, it came a litlle bit sooner than we expected.
So where are we?
We manage to make a device with two sensors: O3 and CO2. We just need to sold the battery to make it complete.
Sensors values are taken thanks to a code made in the Arduino sofware.
Then, we made an interface to present the values.
We didn't succeed to draw the graph we wanted, but we manage to print the coordinates of each point.
All this to one goal: help you stay healthier :)
PAM Team
Here, you can take a look at our final platform design.
It should help to understand the data easily. You just need then to open google maps on another window to check where you've been.
Unfortunately, we had some troubles to draw the graph with the processing code. We are still working on it.
It's time to think about how we'll assemble the components.
We decided to use polysterene because it's a really light material. We dug holes for each components to fit. You can see a photo above.
We are thinking about covering all this with fabric to hide the wires, and add a scratch to make it an armband.
We decided not to sold the arduino with the breadboard, so it won't be complicated if the card needs to be change. It happened to us, our computer didn't recognize the arduino pro micro anymore so we had to find a new one.
05/05/2017
The person is wearing the bracelet during the day.
But how could he know the level of CO and O3 during his distance?
So we thought about creating an interface.
This is the muddle head below.
We got our logo on the left side and our quote.
We using the colour red and green, red-one for the CO and green-one for the O3.
A graphic will be created, so the person will understand the level of pollution that he used to meet during his path.
By the way, the maximum of pollution will be known, after that we will compare those informations to our tables to sensibilize people on the effects.
That is what we already made.
Thank you for reading !!! ;)
We received the O3 sensor! 😊
During this session, we tried both sensors (CO and O3) on a same circuit.
As the first test with the Arduino Leonardo went well last time, we decided to try on an Arduino pro micro. To connect both sensors we used a breadboard. You can see the circuit below:
For the code, we added some lines. We created a second variable for the O3 sensor. In the EEPROM memory, values from both sensors are alternating line by line.
The website above gives a worldwide air pollution map. You can compare the air quality index in different countries quickly. Our project is based on the same idea but on a smaller scale: people will be able to compare the air quality during their daily routine.
In the classroom we measured 1,35 ppm of CO, but what does that mean?
We found a simple scale to realize the quality of our air:
We translated these data in english from http://www.centreantipoisons.be/monoxyde-de-carbone/le-monoxyde-de-carbone-co-en-d-tail/quelles-sont-les-concentrations-toxiques-de
To have the pourcentage, you divide the level in ppm by 104 .
Below 200 ppm, there is no real danger but normally in a non polluted area, the CO level is around 0.2 ppm. As we can see, our air is already quite polluted.
Today, we tried the CO sensor.
We used the information in the previous log to understand the connections. We decided to try first on an Arduino Leonardo card, because on a nano it will be the same principle.
Here is a photo of the circuit we made:
Then, we wrote a code in the Arduino software. We put the code below:
This code give the quantity of CO in the air in ppm(parts per million) multiply by 100, every 100ms.
You need then to verify and compile the code on the Arduino. Take care to check if you are connected to the right type of board and in the right COM port. This is what we get:
We wanted to try then to take the measure every 30s, means every 30000ms.
We just had to chage the delay value (in ms).
There is about 1,35 ppm of CO in the air, in our classroom.
It worked really well!! We need now to choose at which frequency we want to have the measures.
Next session we will try to connect the CO sensor to an arduino to obtain our first values.
How should we proceed?
These are the schematics of the connections:
https://www.dfrobot.com/wiki/index.php/Carbon_Monoxide_Gas_Sensor(MQ7)_(SKU:SEN0132)
From the website above, we have a code that we may need to adapt :
First, we thought about using the wifi to obtain the position. It’s called wifi positioning system (WPS). After some researches we found out that it may be really complicated as we are totally novice in coding. Also, this solution is more adapted to indoor positioning. WPS is well explained on the website below:
So then, we had to think about a second solution. We thought about putting a gps on the Arduino card but that kind of device is relatively big. It wouldn’t be very convenient, because we still want to make a wristband and our components are already quite large. A GPS is also expensive, it’s not the best solution in our case.
Finally, we found out a Google function, that can be use in our case: the timeline in Google Maps. All you need is a google account. Google can track your mobile device during the day, and then give you all your positions at any time. By combining this timeline to the data collected with our device, people will have access to their personal daily air pollution exposure, simply and without any supplementary cost :).
Write the code to get values in the Arduino sofware.
Test the first sensor with an Arduino.
Then test the second sensor.
If it works, write the adapted code to get the values of both sensors at the same time.
Test both sensors.
Write a processing code to show the result.
As we did, you can choose to make an interface.
Think of the design and colors you want.
Create an account to leave a comment. Already have an account? Log In.
Become a member to follow this project and never miss any updates