 PP
PPFor the clock to know how much time has passed, it measures the number of tuning-fork oscillations.
But how much time has passed after a certain number of oscillations?
This is where an estimator comes into play. We need to estimate the frequency of the tuning fork with a given model and a given environment input.
Roughly speaking: If the model says: "Yup, at this temperature the fork oscillates at 440.1 Hz", then the passed time can be derived from the number of measured oscillations (let's say, 1000) by `1000 * 440.1 Hz = 2.272210861s`. The easiest model is that the tuning fork will always resonate at 440Hz, as the original project used.
They got drift of around 60-120 seconds per day, which is a drift of around 1ms/s.
(As a side note: phase noise is not considered in this project, but only drift.)
Nice, but how does the model know that? And what kind of model is that? And how precise can it get?
These are the main project questions that I wanted to find out.
For that, I separate the usage into two phases: Measurement and Application.
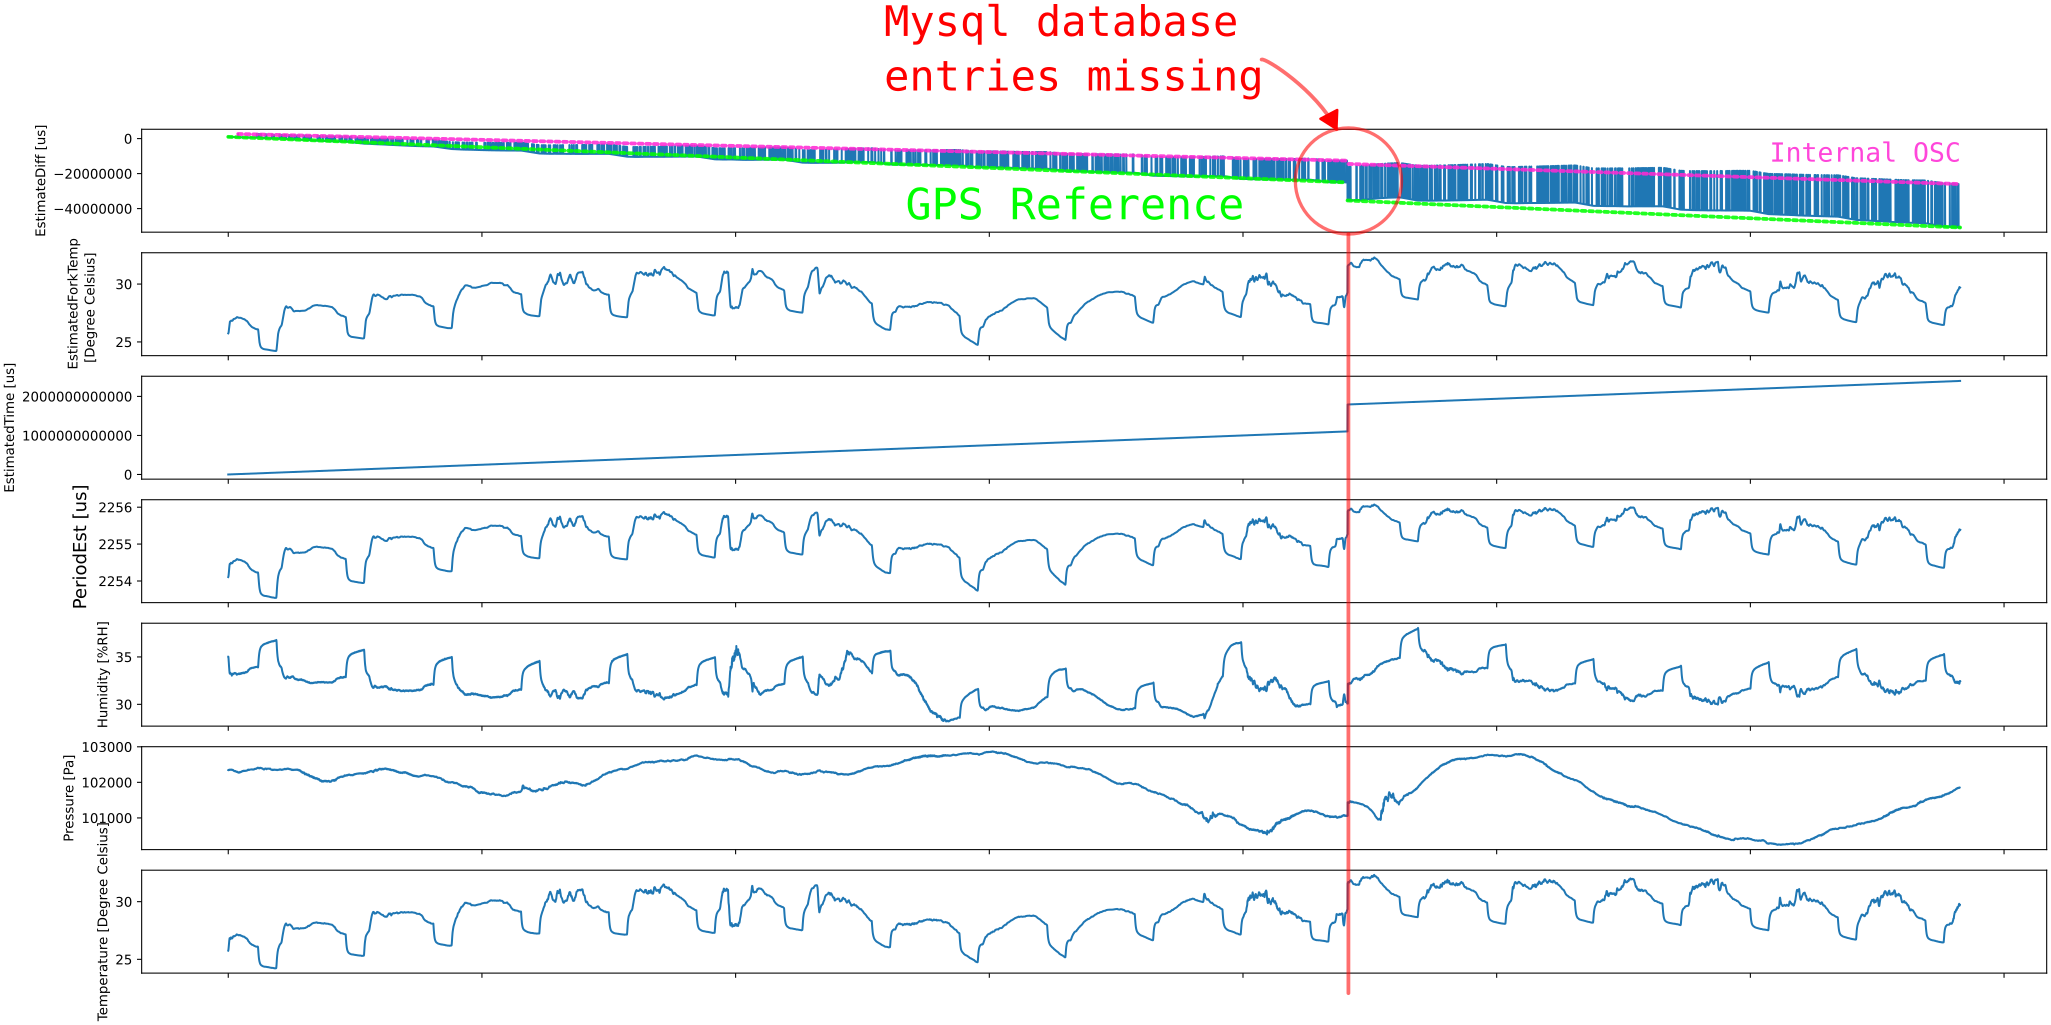
In the measurement phase, I use a precise reference* to log the actual frequency against the temperature.
Then, offline on my main computer, I try to find and apply functions that can model the seen behavior, and find/optimize the parameters to fit the measured frequency as good as possible.
(*precise reference: First the internal Pico's OSC, then I got my hands on a nice precise GPS Megahertz Timing Reference)
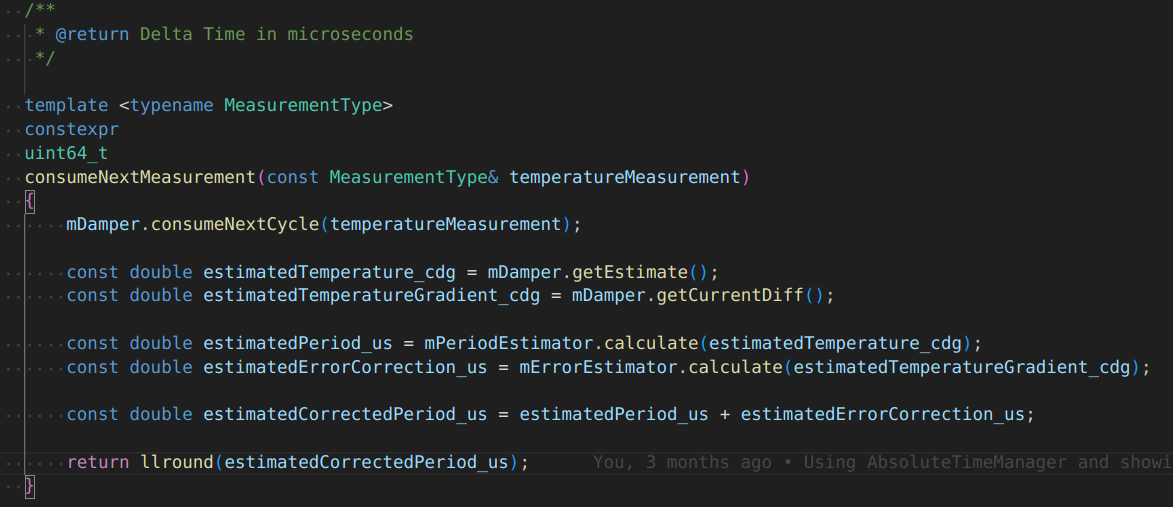
In the application phase, I then use the offline-trained (No AI! Only statistics!) now-constants for the given model in the clock to estimate the frequency and thus, the passed time since startup. Showing the actual current time is then nothing more than adding an time offset at setting-the-clock on top of the passed-time-since-setting-clock (see github repo).
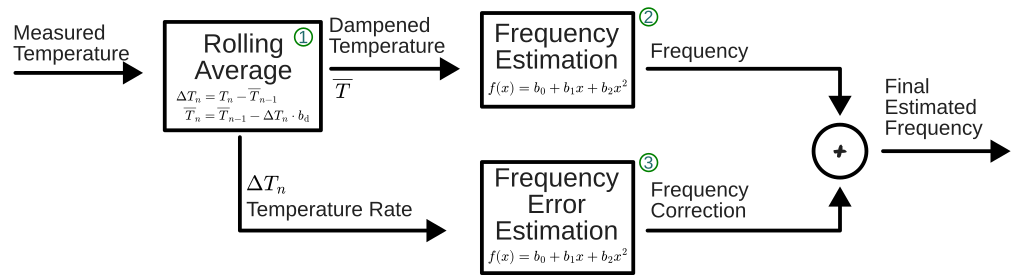
So, just to wrap up: We shift what is "knowns" and "unknowns" in the phases. First, in the Fork Measurement Phase, we know the Fork frequency and temperature, but don't know the model parameters that fit the behavior.
Then, in the Application Phase, we don't know the true fork frequency, but know the model, its parameters, and the temperature to estimate that!

I had a lot of surprising influences on precision. Currently, with a fresh calibration, without standing in direct sunlight, and with a not-too-bright display, it achieves a drift of ~15 seconds per month, which results in around 5µs/s of drift! That is a factor of 250 better than uncalibrated, which I consider a project success :)
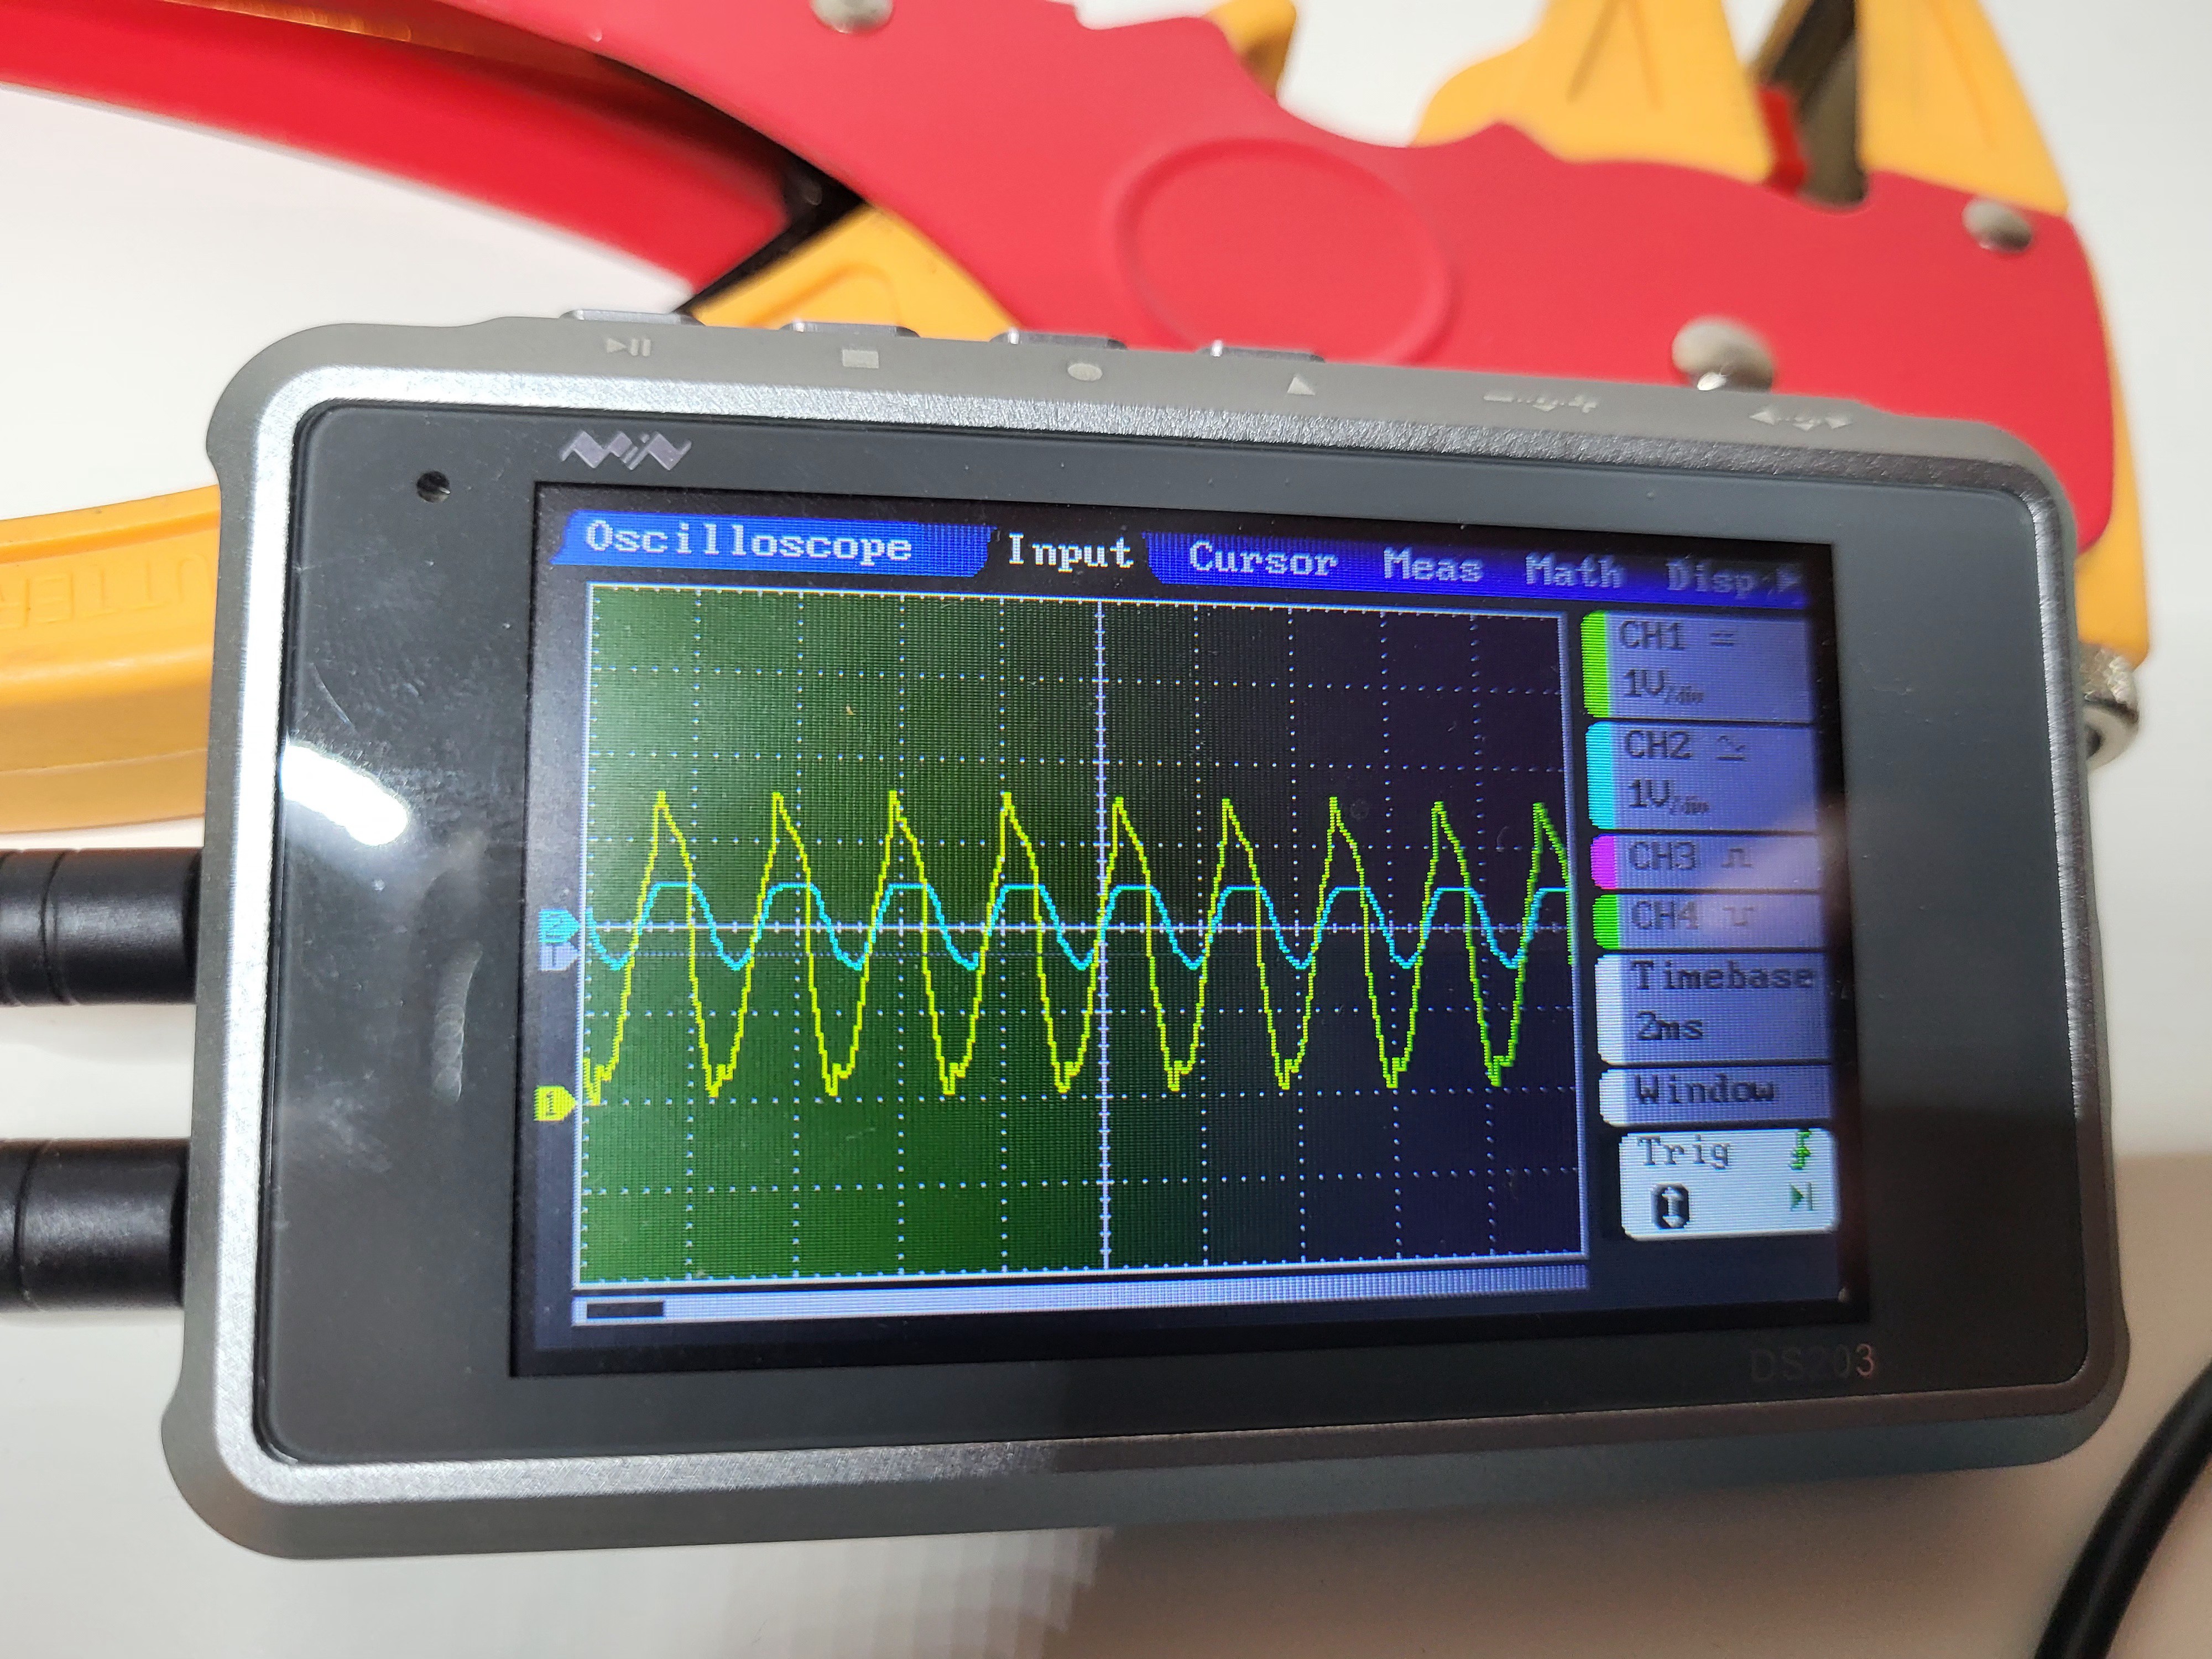
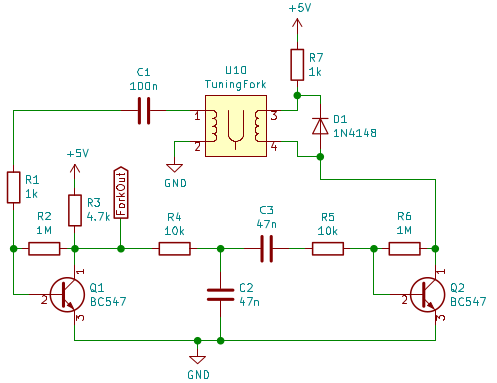 There, R4 and R5 together with C2 and C3 form a Bandpass filter. Mainly I suspected the large C3 (High-Pass) to be too big.
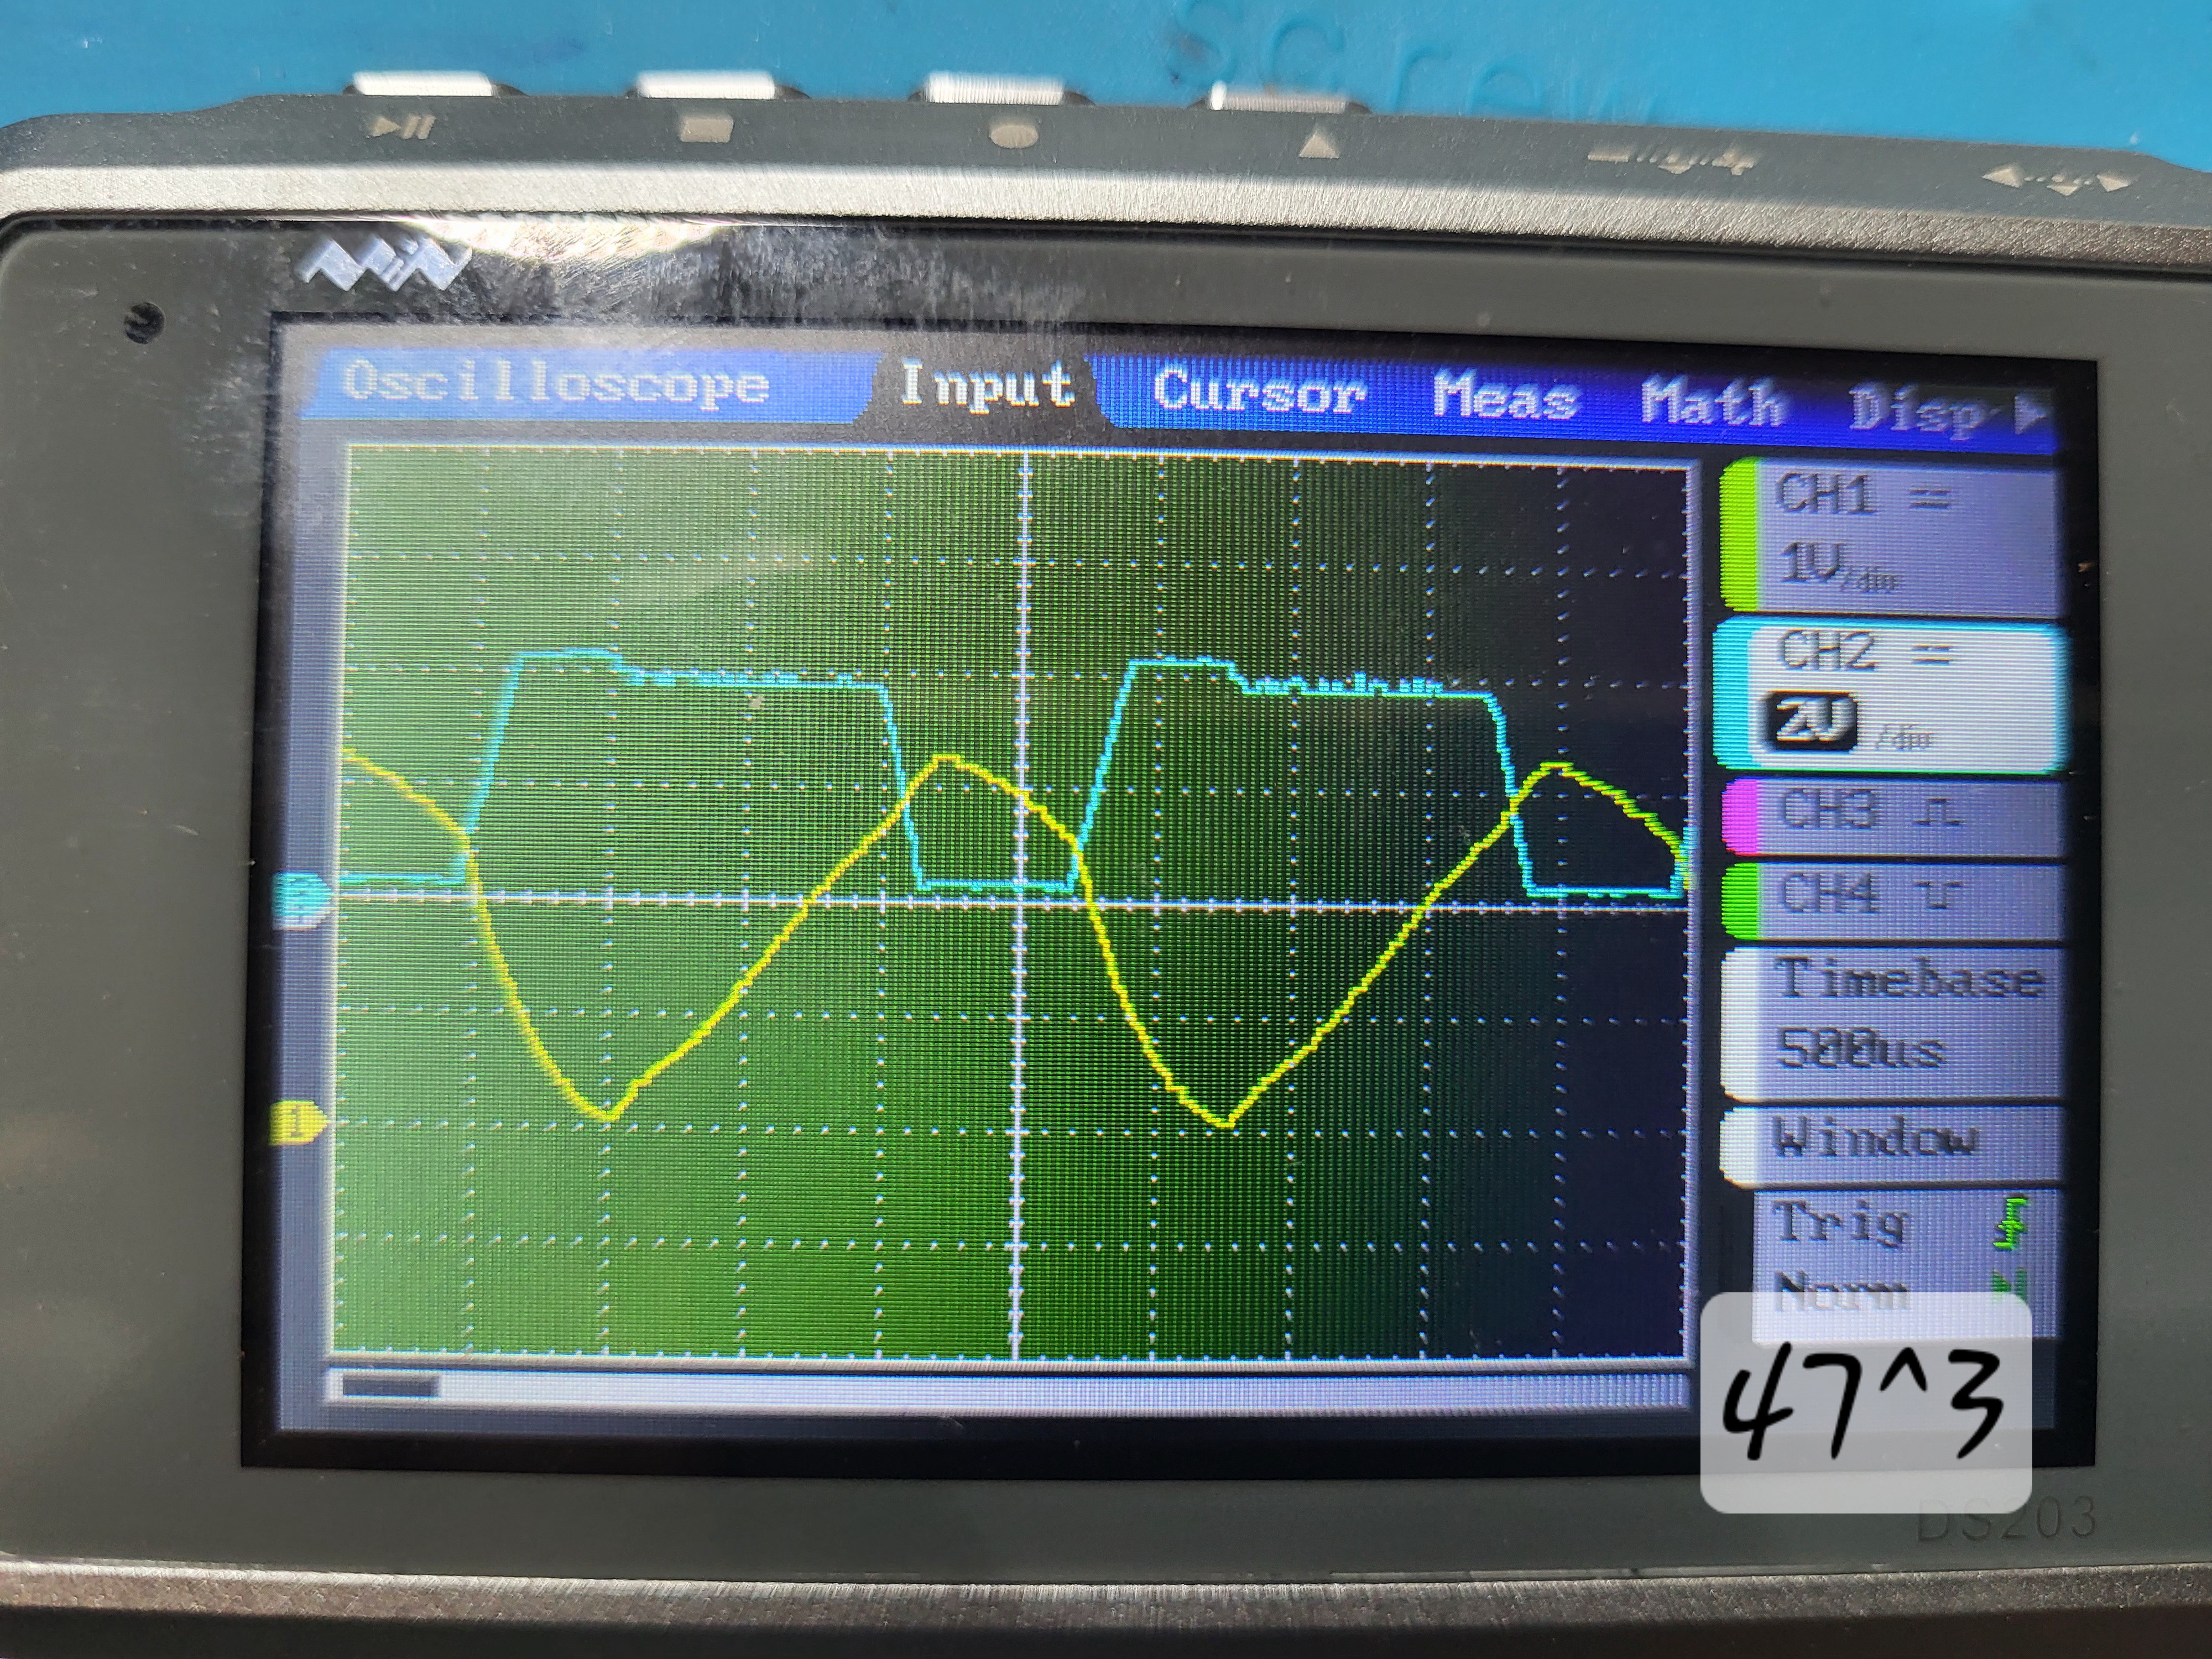 Notice the sharp edges at the low and high spots of the Yellow trace, as soon as the blue trace (the driving coil) either Turns on or the first step-off. (I don't know why it does the first step down. Well, I am not an Electrical Engineer...)
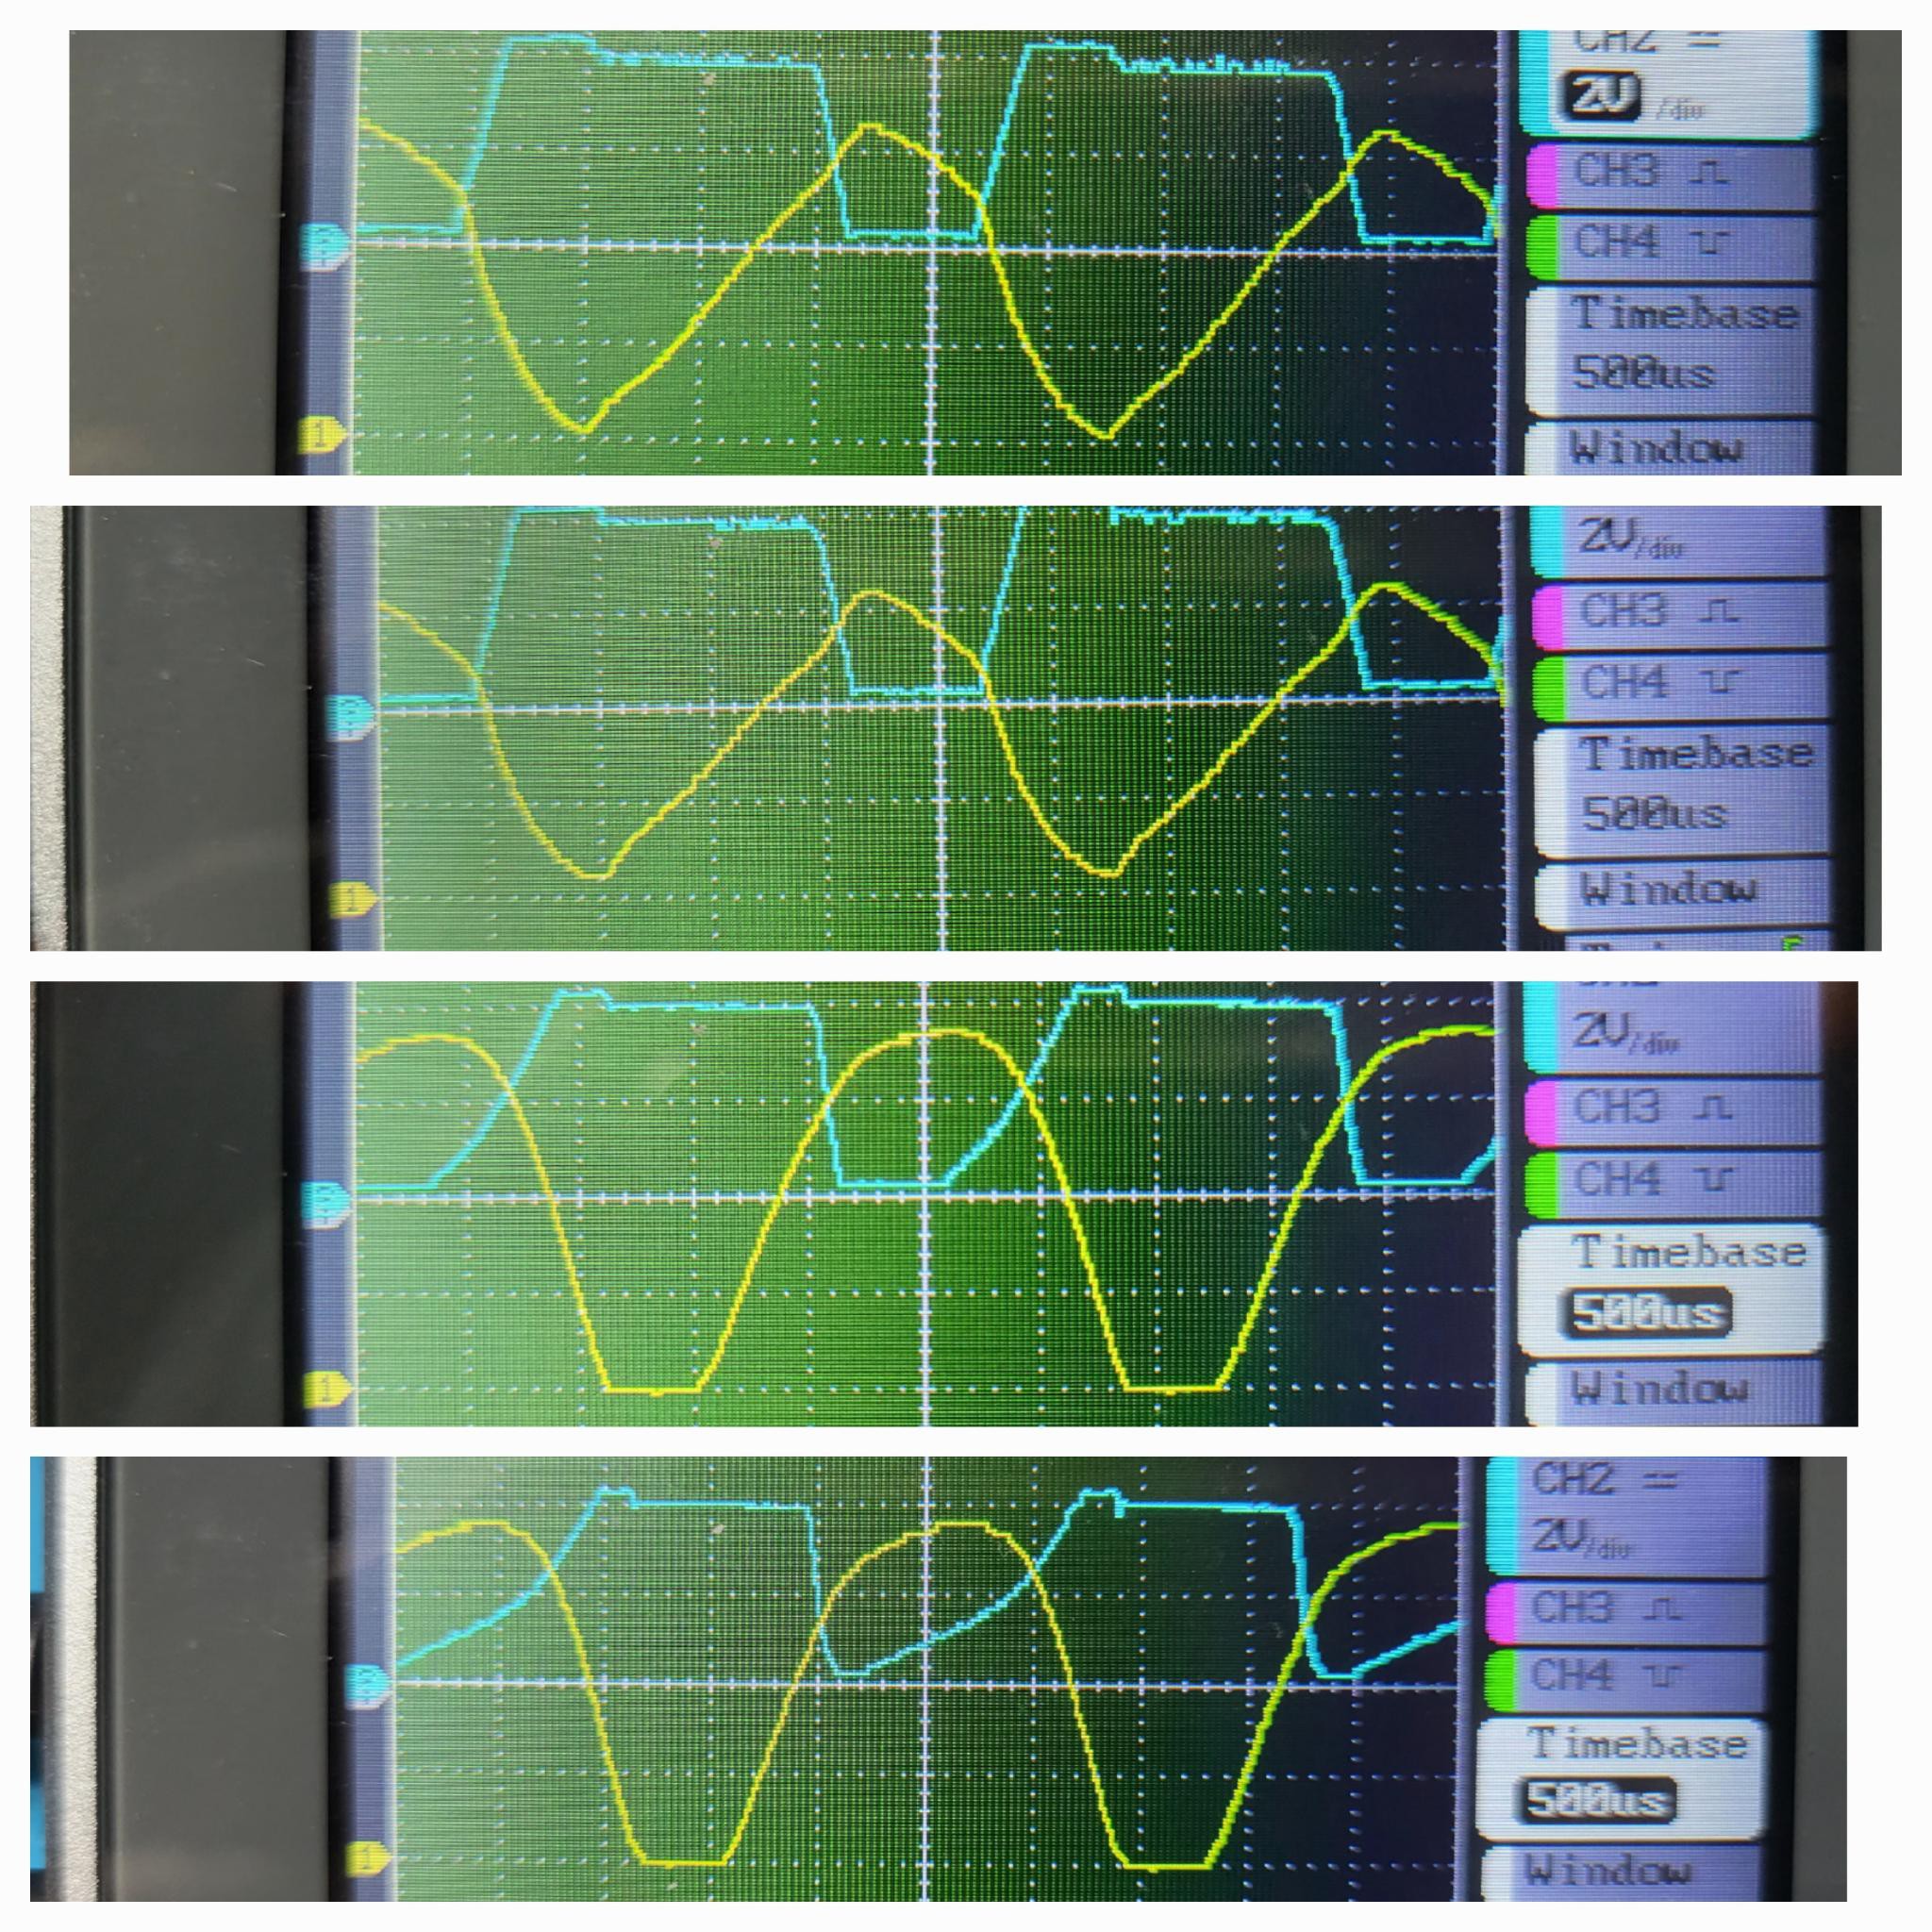
 Well, now off to a new test run for logging :)
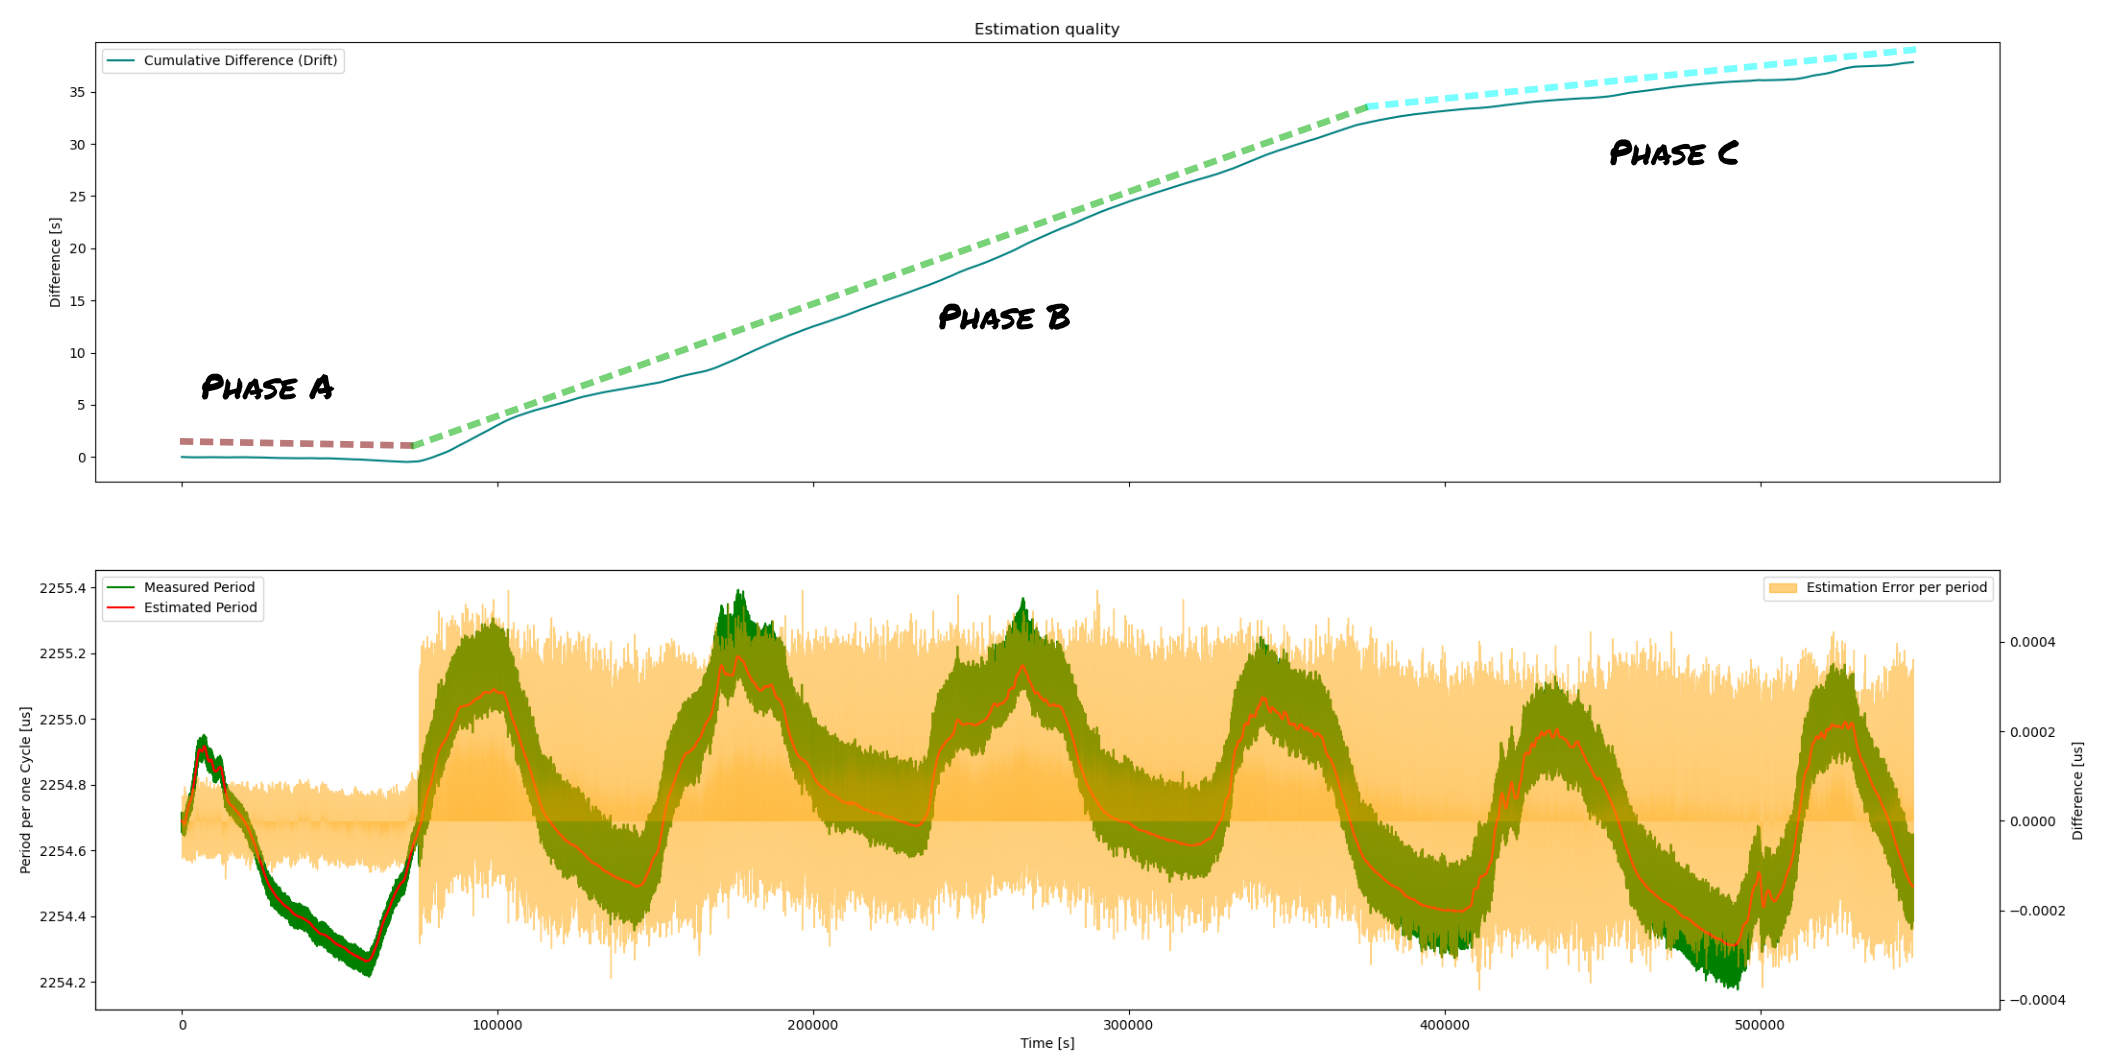

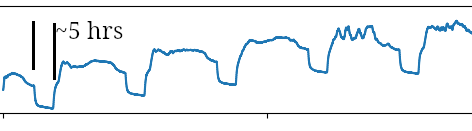
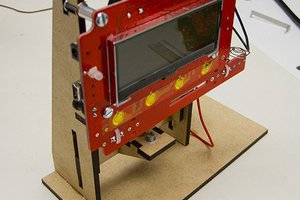
 Do you see it? I dim the display at nighttimes to reduce Eye-Strain and in that glass-dome the "dayBrightness" (5 of 7) actually heats up the thing! And to make matters worse, the heat rises up to the Temperature Sensor, but most of the Tuning Fork is actually below the display, making it worse to correlate measured temperature with actual tuning fork temperature.
 So basically I am throwing accuracy out in the order of ~1 microseconds per second, which results in 86400 * 0.5us = 0.086s / day, which is roughly one second per week.


 Dave Ehnebuske
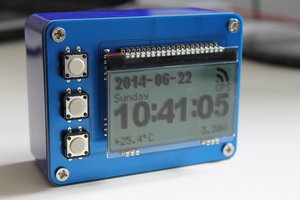
 hkdcsf
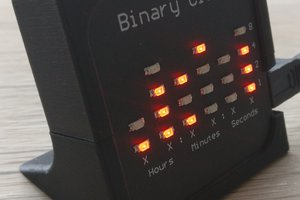
 Tobias
 alnwlsn
My mid-1960s Bulova Accutron tuning-fork watch was considerably better that a minute a month. I adjusted it to run very slightly slow so an occasional "thump" on the side would cause it to gain a tiny bit when necessary -- retarding it was considerably more difficult.