 Ergun PAYAL
Figure 1 shows the FFT graph when there is no periodic motion in the environment. Peaks can be seen around 0, 1, and 2 Hz, with a magnitude of approximately ~12.
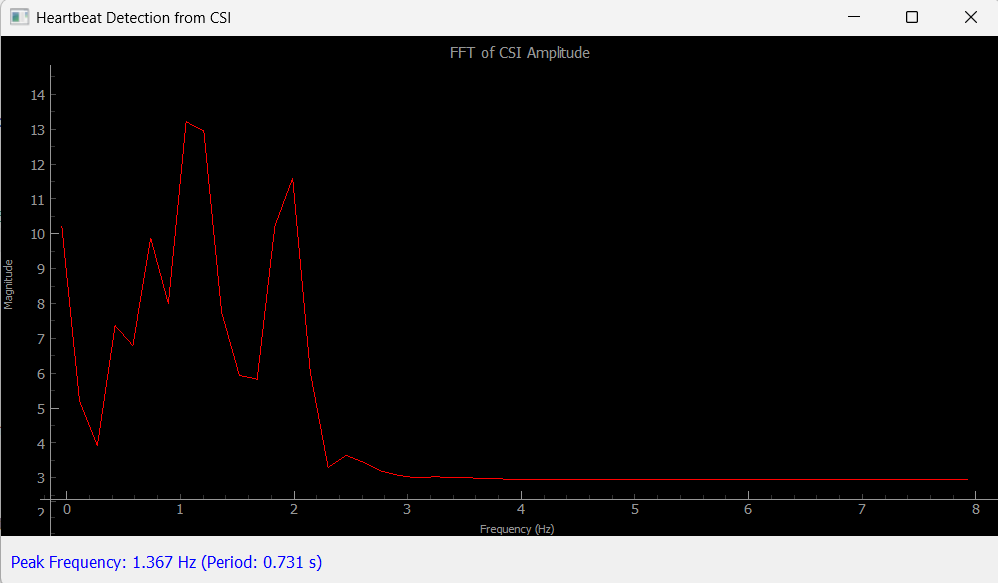
Figure 2 shows the FFT graph generated by rhythmically moving my hand between two ESP32 devices. The magnitude level reaches approximately ~500.

In the video, you can see a live analysis. The rhythmic movement doesn't have to occur directly between the ESP32 devices, but background activity can make it harder to detect.
Discussions
Become a Hackaday.io Member
Create an account to leave a comment. Already have an account? Log In.