 Wassim
Demo
- We can see here how the dashboard looks like, definitely not impressive but the good news is that it is completely hackable !!!
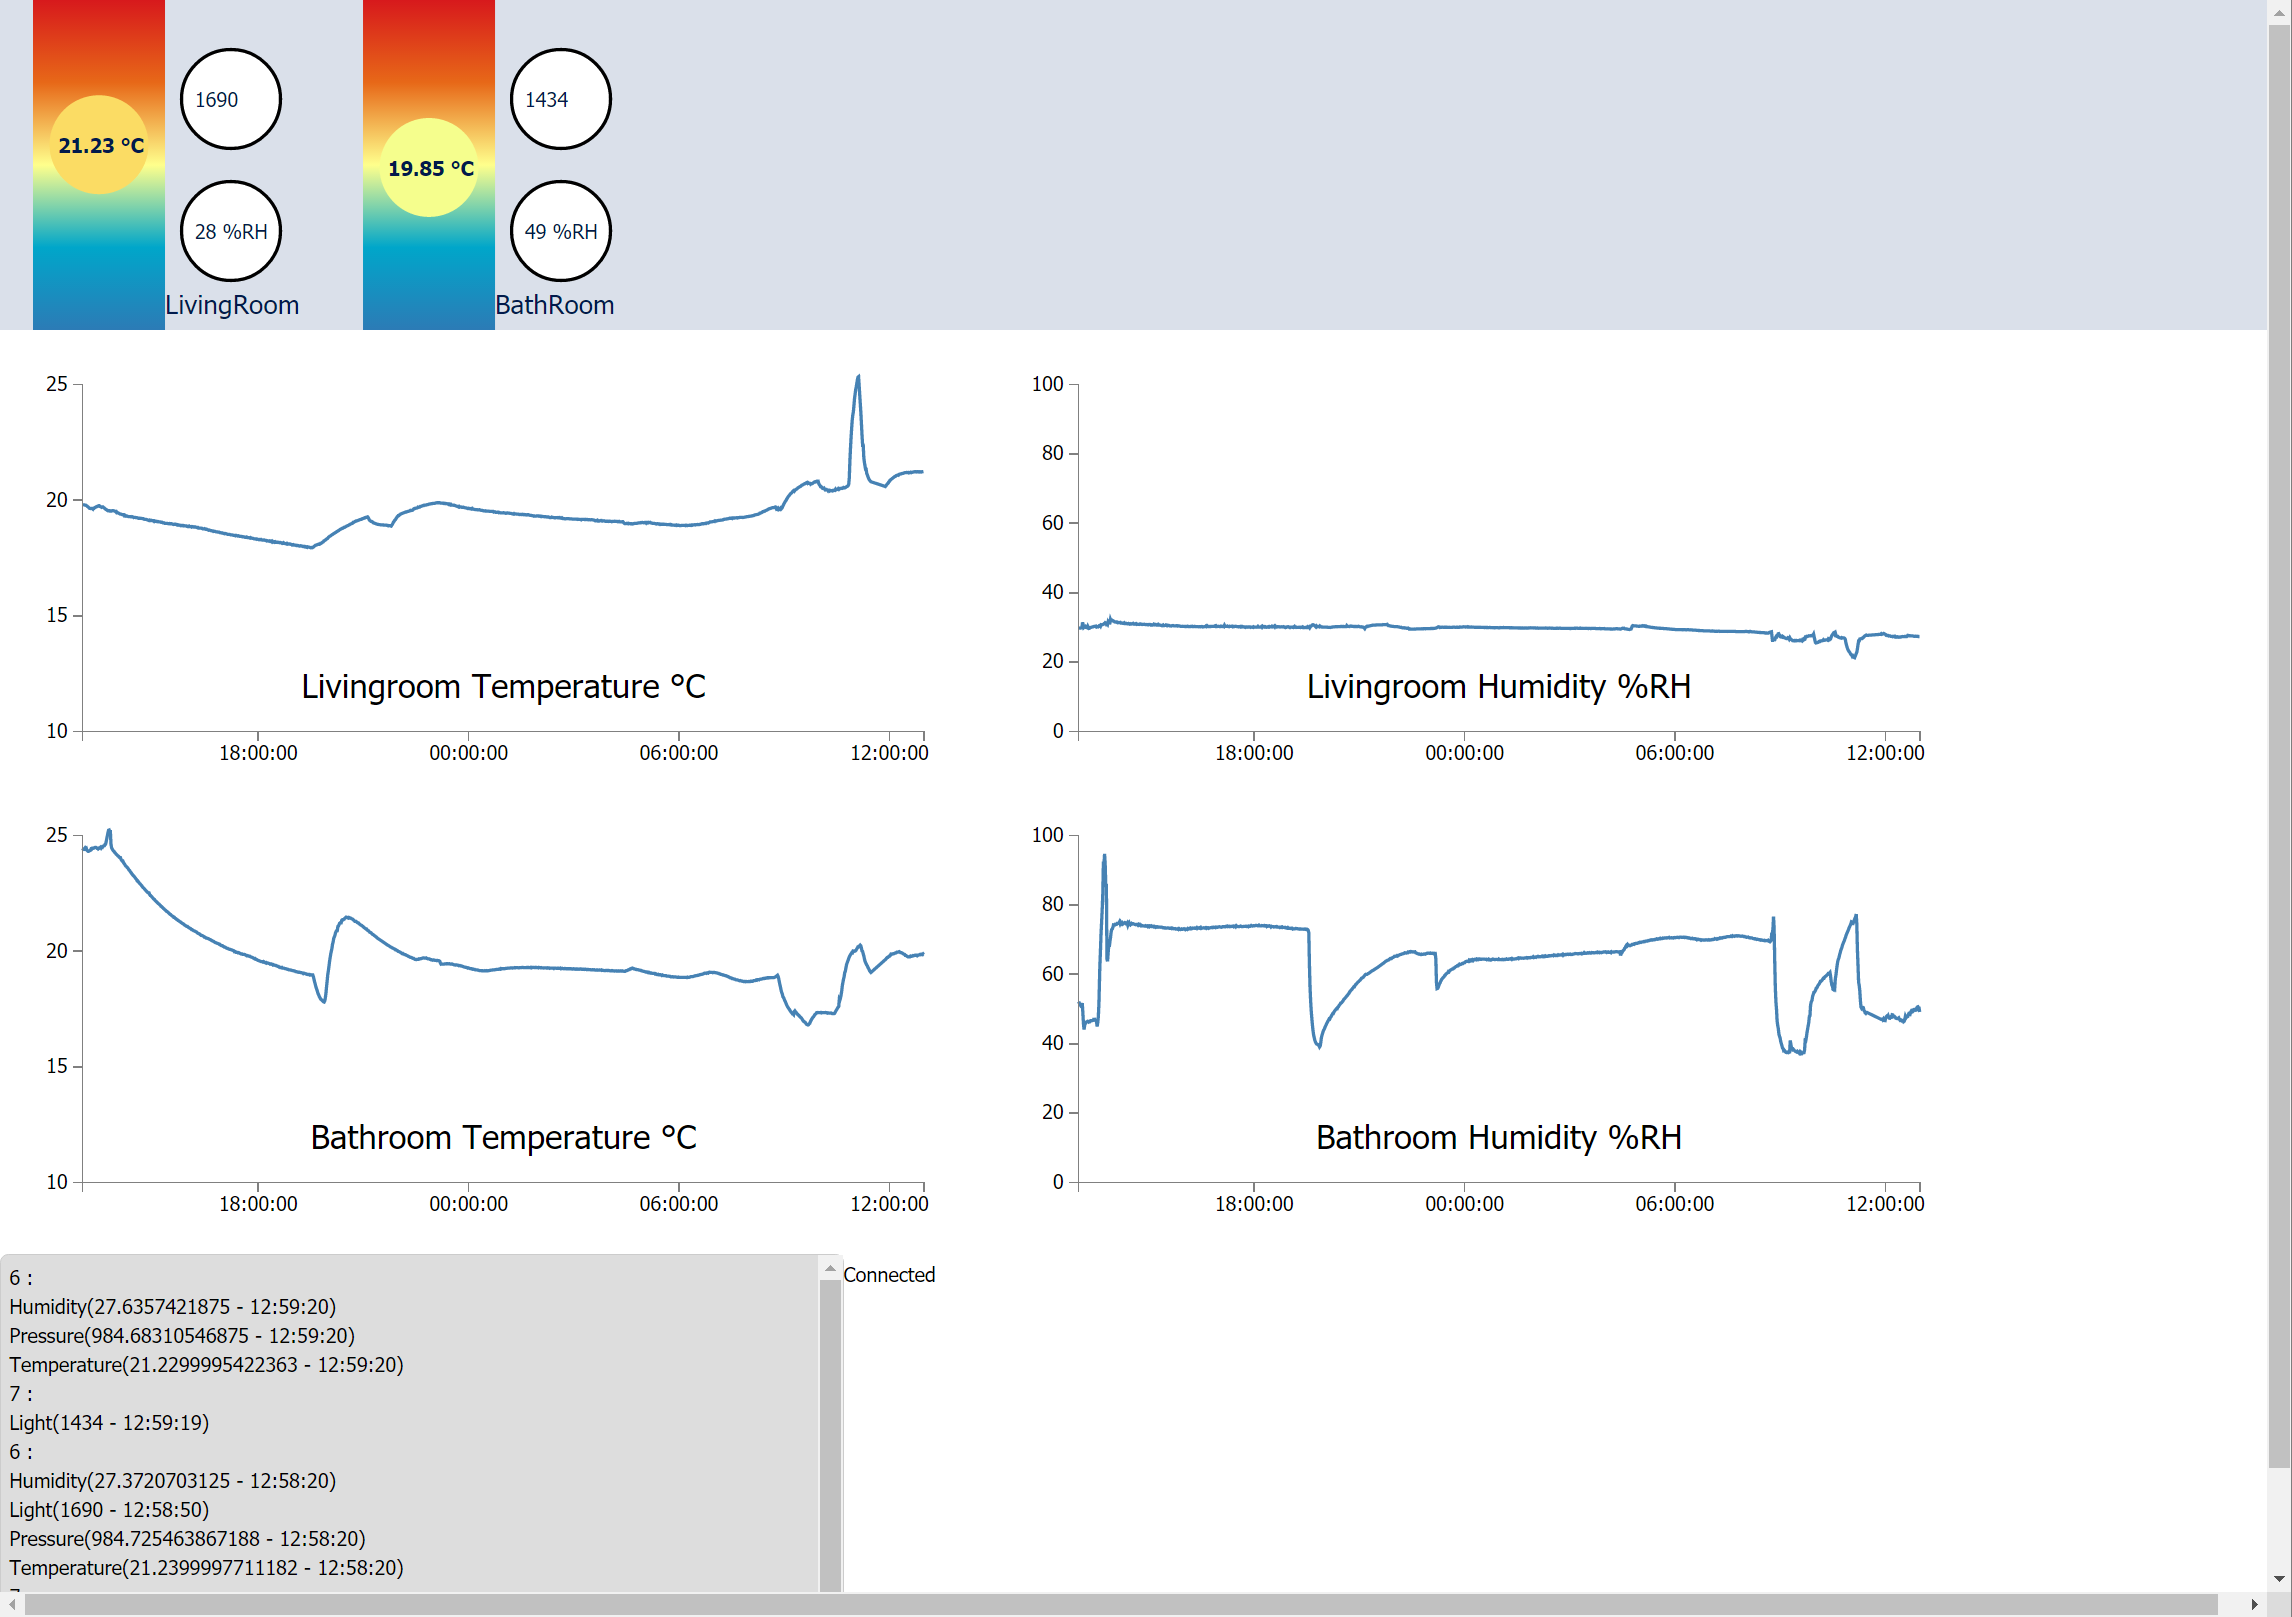
So we can see there bullets going up with the temperature changing color accordingly, note that the color matches the gradient position of the rectangle it's in. The curves show the last 24 h, still planning to add dynamic real time animations, the technology allows but not the time. This page shows an ugly text debug window at the bottom helping me to check all received notifications.
What's behind this ?
- first of all, this is web, only web, html5 is helping, javascript is improving and the tools coming with it as well to make it a descent programming language.
- I struggled looking for ready javascript libraries to show graphs such as highcharts or amcharts they look nice, but not only you get stuck with licence stuff but you cannot edit it to very customized display, the right choice ended on d3js
D3js
- d3js is a wrapper library around the svg standard which just makes selections easier and have a lot of helper functions and examples
- The learning curve is long, but I highly recommend it to those who want to understand the web technology and not simply use it.
Websockets
- Another major improvement in the web, after struggling for server side events with comets or other alien like mechanisms, the websocket restart from scratch and provide an efficient tool already known and proved, the hack behind it is to start as an http request, and then upgrade to a websocket
Poco
- I know javascript is fancy, I know python is cool, sorry to say this but c++ is easier, here I'm not talking about personal preference. Not about writing code only which is obviously faster if you omit declarations, but I'm talking about the effort you spend from when you start writing your code till you get it running as you expect.
- That is why I opted for a C++ application for netwroking where Poco marvelously does the trick. I hesitated between boost io and poco, then opted for poco as it is more than a library as it provides even application class, log and other helpers.
Security
- Some of you might wonder how would I secure this, with all polemics we read about every mentioning IoT devices being hacked, and I do yes access this remotely.
- VPN : yes, the answer is simple, let us not re-invent the wheel, plus I have no time to spending updating every new patch of my authentication web interface. I admit here the solution was expensive, a VPN enabled router, but it's a single time payment for a multipurpose router and the result is independent from any 3rd party (other than simple domain name redirection).
- It is important to note here how users can and must own their IoT devices by using tools that do not require third parties services that only work with registrations or even worse requiring active internet connections, here latency and confidentiality have to be taken into account.
Some Javascript
I learned how to split my javascript in more than one file (not trivial, yes, I'm serious), so I isolated the usage of the d3js graphic elements from a simple interface:
var StatusParams =
{
	svgID : "#StatusDisp",
	data  :
	[
		{ x: 100, y: 100, r: 20, color: "Blue",
			Temperature : 26, Light : 500,
			Name : "LivingRoom"
		},
		{ x: 300, y: 100, r: 20, color: "Blue",
			Temperature : 26, Light : 500,
			Name : "BathRoom"
		},
		{ x: 500, y: 100, r: 20, color: "Blue",
			Temperature : 26, Light : 500,
			Name : "Balcony"
		}
	]
};

var nmap = {6 : 0,
			7 : 1,
			16 : 2};

//---------------------------------------------------------------------------
//					Time Chart
//---------------------------------------------------------------------------
var now = Date.now();
var start_disp = now - 24*60*60*1000;//1 day
var ChartsParamsList =
[
	{
		svgID : "#ChartLivTemp",
		scale_x_domain : [start_disp,now],
		scale_y_domain : [10,25],
		NodeId : 6,
		SensorName : "Temperature",
		Label : "Livingroom Temperature °C"
	},
	{
		svgID : "#ChartLivHum",
		scale_x_domain : [start_disp,now],
		scale_y_domain : [0,100],
		NodeId : 6,
		SensorName : "Humidity",
		Label : "Livingroom Humidity %RH"
	},
Then let's call it the main function is simply initializing using these tablesvar MyPanel = new StatusPanel(StatusParams);
var MyChartList = new TimeChartsList(ChartsParamsList);
var reqList = [statusReq].concat(MyChartList.getAllRequestsDuration());
initWebsocket(reqList,MyPanel,MyChartList);
d3js has excellent doc and tutorials so I won't detail it here
The source code is of course available with the rest of the IoT_Framework here in github
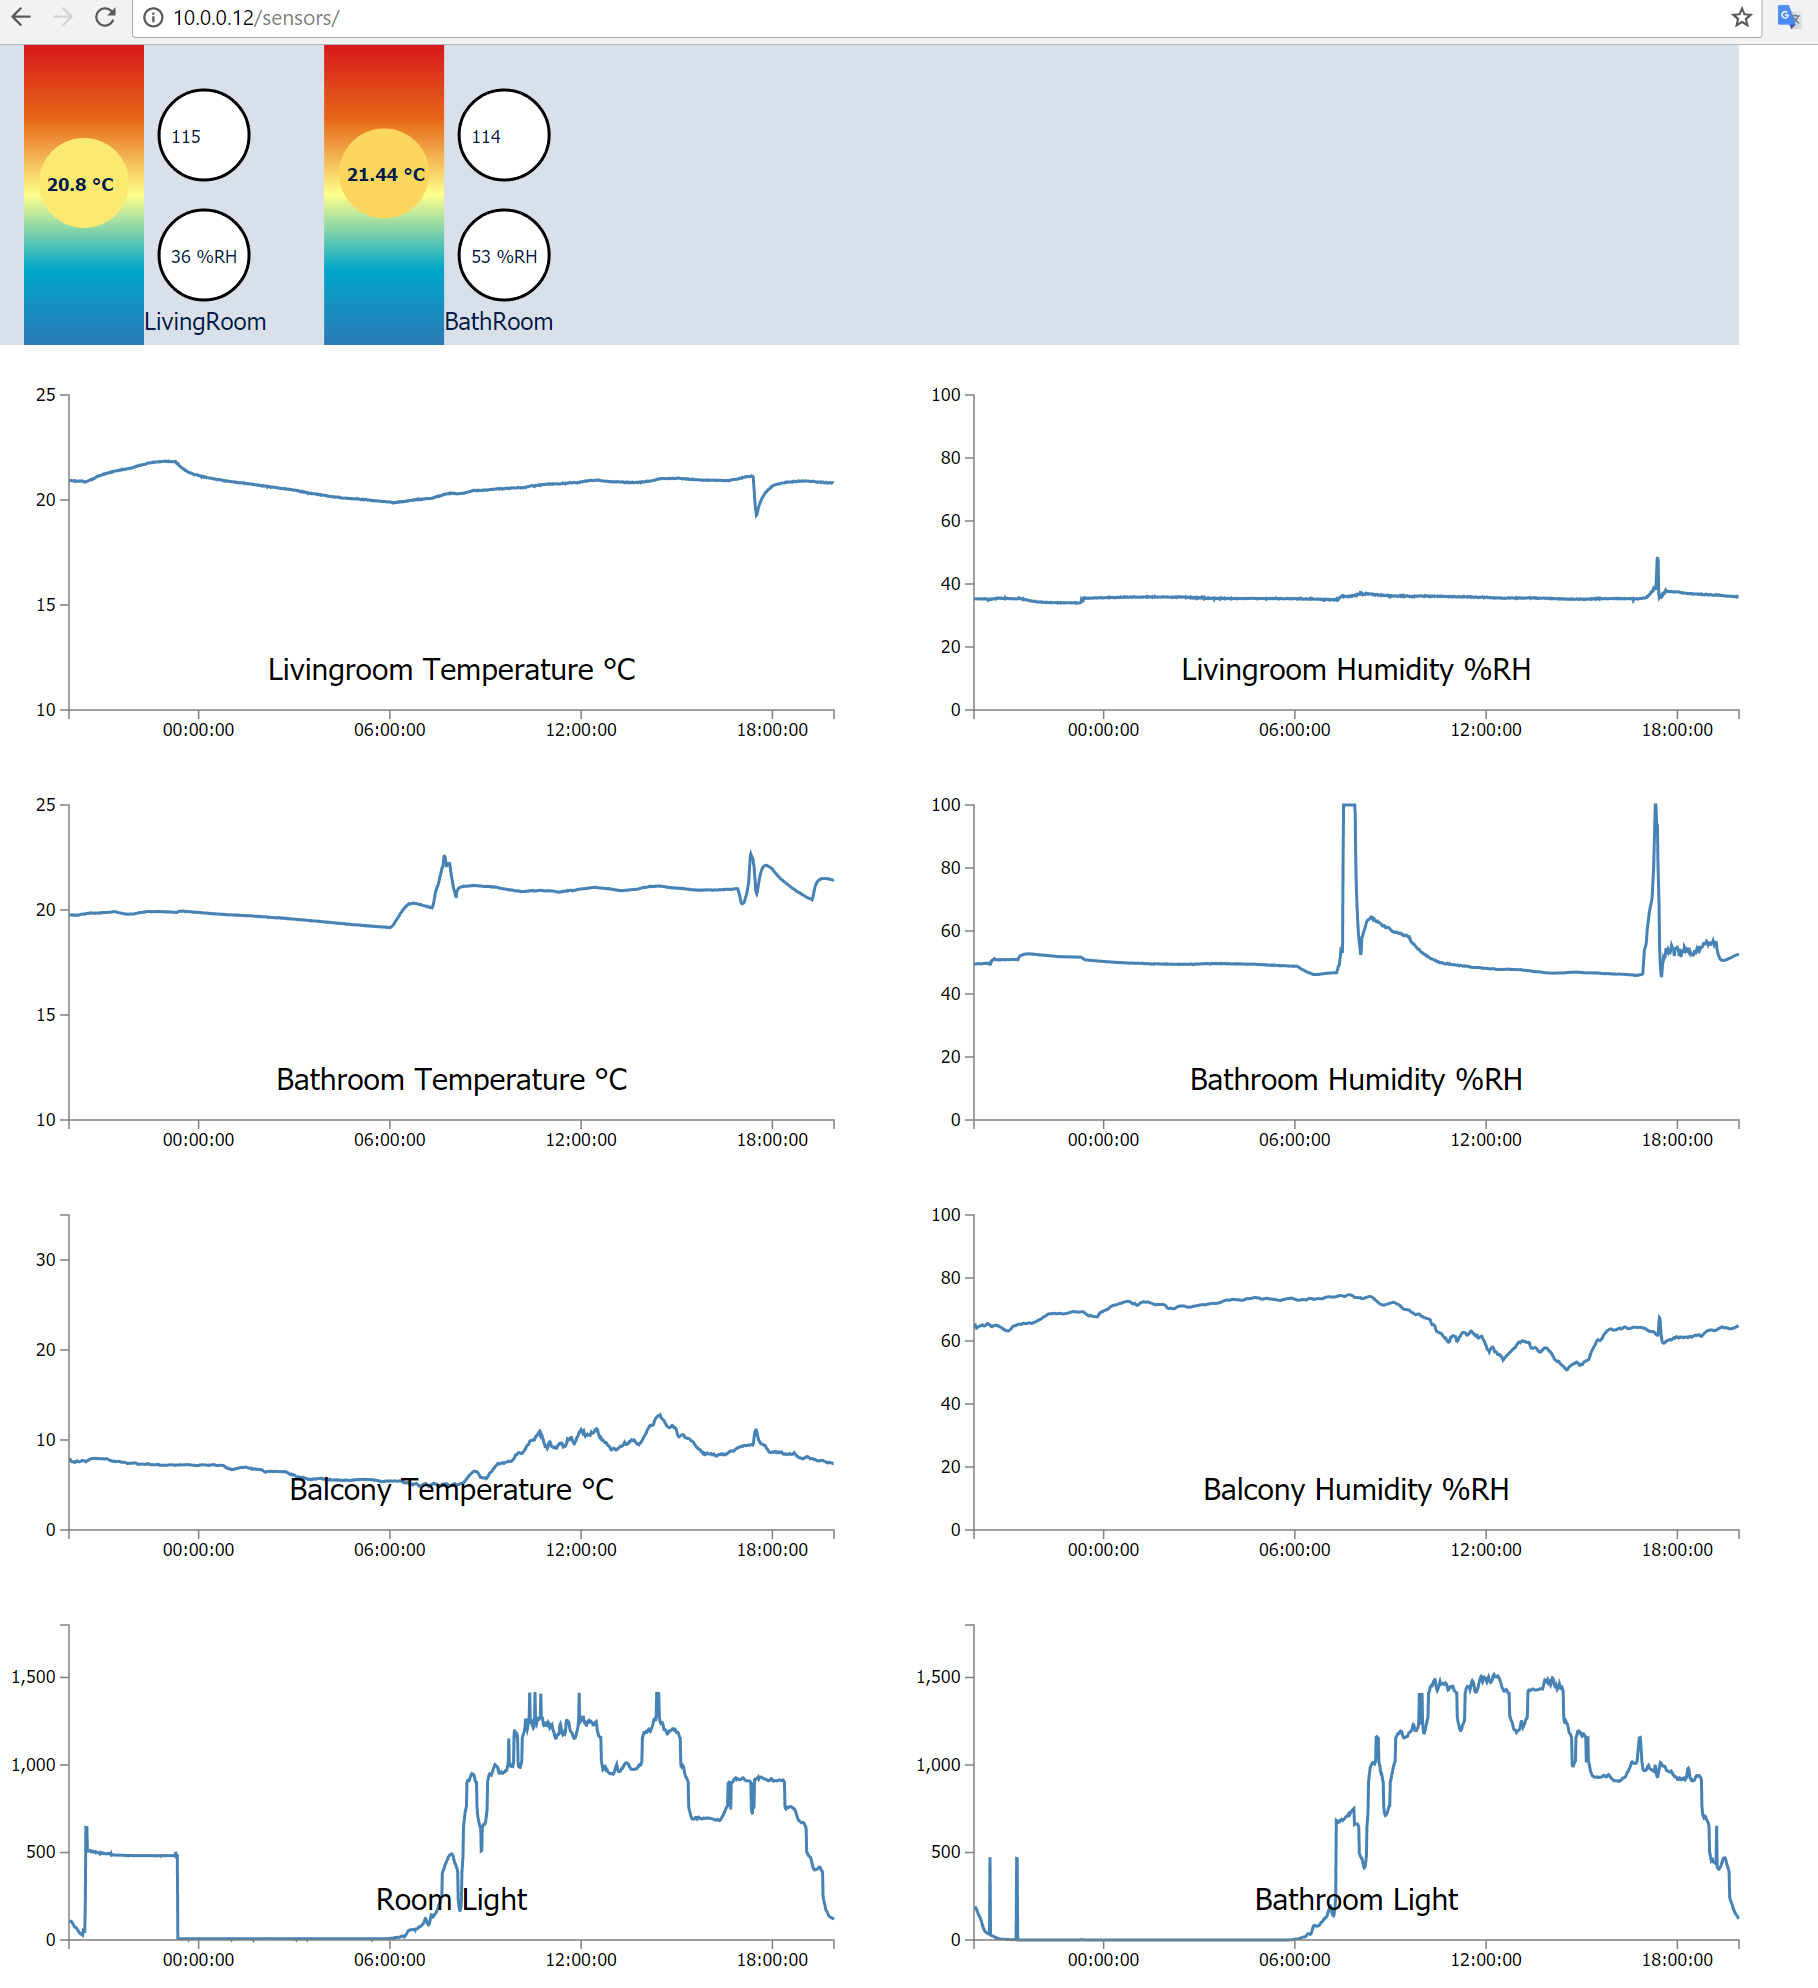
Another Screenshot
Looking to those curves bring more ideas, for home automation yes we can feel here that it was raining outside, that someone took a shower at around 8h and went to sleep at around eleven the night before (of course entries are more precise down to the second).
Discussions
Become a Hackaday.io Member
Create an account to leave a comment. Already have an account? Log In.