 Ray Burne
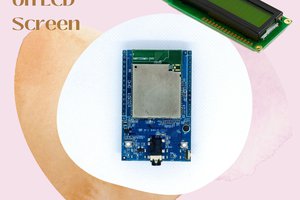
The BMP180 I2C protocol barometer connect to Maple Mini pins 15 & 16 and the board is clearly marked: I2C1, sda/sdl (data/clock). The actual display is slightly different than shown on the Lead-In... In the code provided, I have added temperature; the default units is degrees Fahrenheit, but that can be easily changed in the code by modifying the single line, boolean Fahrenheit = true;
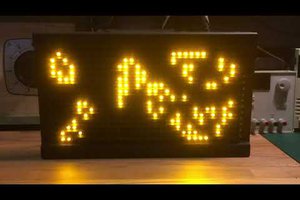
In 24 hour operation, a vertical line is drawn to represent the current pressure high reading every 18 minutes. There is room on the display for 80 vertical bars, therefore 80 bars at 18 minutes per bar represents 24 hours. Prior to drawing the screen, the software moves bars representing the array values: so bar 79 moves to bar 80 (the old 80 is overwritten) and then bar 78 to 79, and on until bar 1 value is moved to the bar 2 value. This completes the rolling of values to establish history. The current value from the barometer is then placed in the array element representing bar 1 and the system draws the full graph. Lastly, lines are drawn across the graph horizontal to represent the highest and lowest values within the pressure data that was just drawn: the color Green represents the lowest reading and the color Yellow the highest reading for the data shown. Remember, the graph "rolls to the right" every 18 minutes and thus the high/low values are dynamic and the more recent bars are to the left.
The graph is set up for the Atlanta, Georgia, U.S.A. recorded high and low barometric values. Specifically, for Atlanta: High = 30.79 on 1/6/1924 and the Low = 29.08 on 1/11/1918. In the area I live, there is a local airport and NOAA has the hourly barometric pressure available, so I simply had to adjust this line of code to compensate until I got the published pressure to match my display:
int localCorrect = 3575;
The implications here is that in different geographic areas of the world, the graph may need to be modified for the ranges in those
areas. If this needs to be done, familiarize yourself with the function:
void displayHistory()
which is the worker function to do the actual mapping. Legends are added to the display by the function void drawLegends() so it should be rather easy to customize the working of the internal storing and mapping of the data to the LCD
 Daphne
 Dorijan