 zpekic
Complex programmable logic designs are opaque. Unless this opaqueness is turned into transparency, the design and the whole project will fail. I use mainly two methods to peek into the (quite literally) little black box of FPGA:
- Create generic components and test them in separately or inherit them from projects in which their already worked. Examples in this project that I reused (with some modifications):
- Microcode control unit
- Binary to BCD converter
- 7-seg LED display unit
- Serial to parallel and parallel to serial components
- VGA controller
- Button / switch debouncer(s)
- Build into the project itself as many as possible debug features, starting with simpler (LEDs, buttons) towards more complex (serial debug, VGA) as the project progresses
| component \ visualization | LEDs, 7-seg LEDs | Serial output | VGA |
| serial to parallel input | LEDs | Echo of input buffer during GL | Input buffer hardware window |
| CPU register T | traceT(); microcode subroutine | Displayed using block cursor at the locations it points to | |
| CPU registers BP, LS, LE, PrgEnd | 7-seg LEDs | traceBP(); | Underline cursor shown at location pointed by register |
| ALU registers | - | traceALU(); | - |
| CPU return stack | - | displayed as indentation of each IL operation | - |
| Microcode execution | (program counter can be displayed) | - | Hardware window, using symbols from symbols ROM produced by microcode compiler |
| IL execution | - | Each IL instruction traced with mnemonic and parameters | - |
| Command line | - | - | Hardware window |
| Basic program | - | - | Hardware window |
| GOTO cache | Only empty/used/full state on LEDs | - | - |
Armed with the above, I was able to visualize and debug the 3 layers of code:
- Microcode executes TBIL instructions
- TBIL instructions execute Basic interpreter
- Basic interpreter executes user's Basic program
Two components important for debugging merit some discussion as they are useful and generic enough for other programmable logic projects too:
Serial Tracer
Basic CPU has an output - only serial port which outputs a constant stream of trace data, whenever microcode includes a call to the "traceString nn" subroutine. nn is a number from 0 to 63 (can be easily expanded to 127) which is an index into an 8-byte string which will be output on this port. While the trace output is ongoing, microcode execution is waiting for it to finish (good opportunity to add an outgoing FIFO here)
trace:    if DBG_READY then next else repeat;    // sync with baudrate clock that drives UART
    if DBG_READY then next else repeat;
    DBGINDEX <= zero, back;            // clear the serial debug output register and return
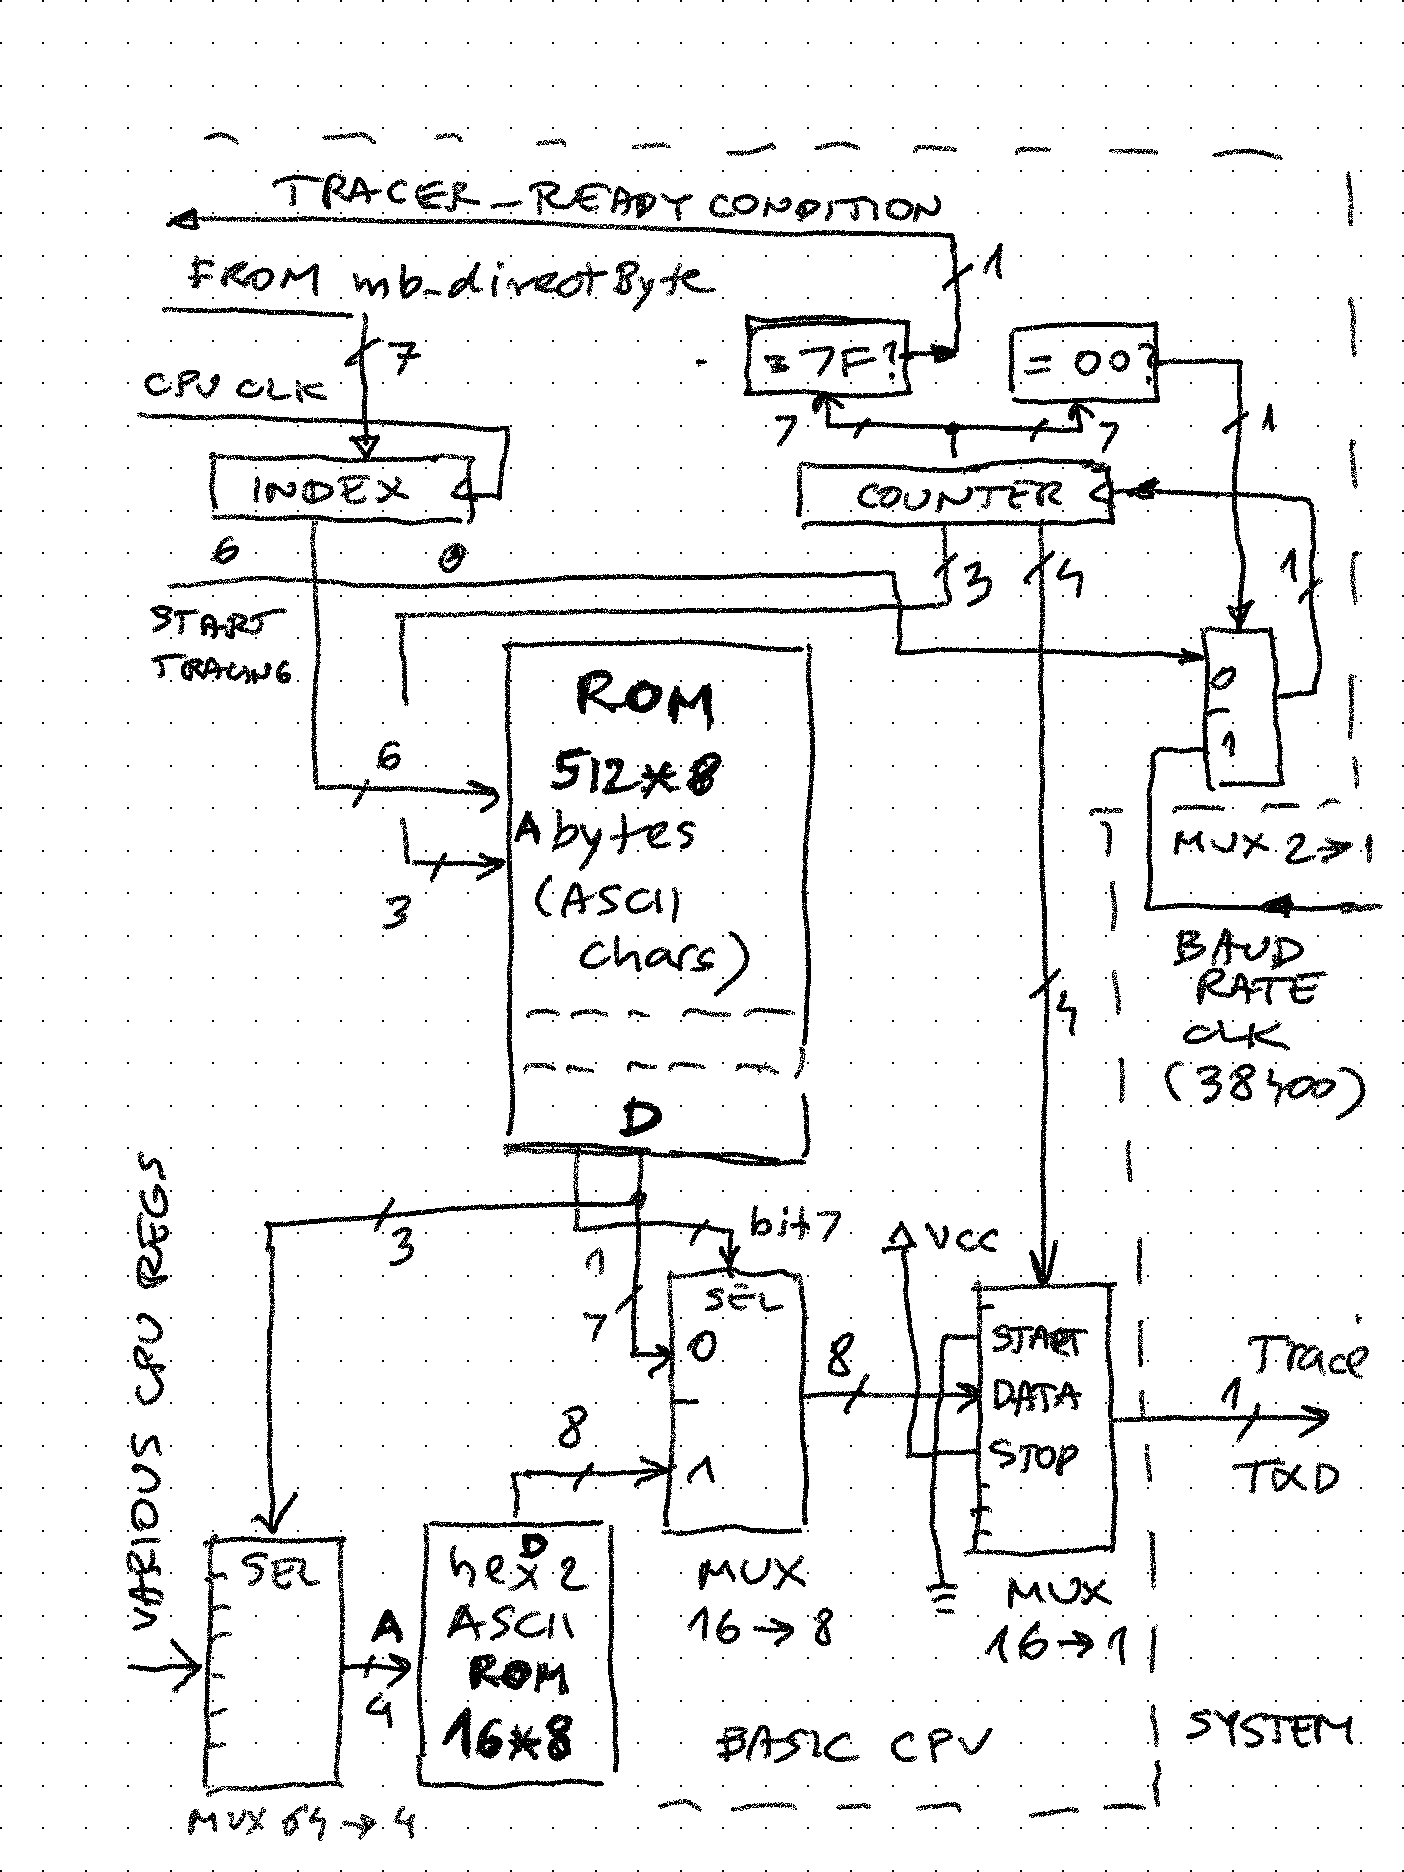
Central part is the 512 byte ROM organized as 64 entries of 8 ASCII characters. When desired entry number is stored into the index register, the 7-bit counter resets to 0 and starts counting up, driven by the baudrate clock. Lower 4 bits of this counter are connected to a 16 to 1 MUX. This MUX drives the serial output line, by selecting the start ("space"), data, and stop ("mark") bits. The upper 3 bits select 1 out of 8 characters in that ROM entry. For extra capability, if the character stored has bit 7 set, it doesn't go directly to output, but selects 1 out of 16 inputs that tap into various values in the Basic CPU. The 4-bit hex value is converted using a look-up table into ASCII, and it sent out to trace_txd output.
For example, entry #2 in the ROM is equivalent to C# "string.format()" such as $"{IL_PC:X3}: {IL_OP:X2}"
X"80", X"81", X"82", c(':'), c(' '), X"83", X"84", c(' '), -- aaa xx:
Hardware window
The VGA controller generates a 640*480, 50Hz signal using 25MHz dot clock. The screen is divided into 80 columns and 60 rows, and these two values are fed into and consumed by "hardware window" components. They simply check if the current horizontal and vertical position of the screen pixel is inside their coordinates. If yes, they convert it to a memory address based on window size and memory base address. The resulting address is used to fetch ASCII char from memory and displayed (each window can have own background and foreground colors)
Here is the definition of input line and program code windows (note their base addresses):
inpwin: entity work.hwindow
        Generic map (
            top =>     X"08",
            left => X"08",
            width => X"40",
            height => X"02"
        )
        Port map (
            enable => '1',
            x => x80,
            y => y60,
            m_base => X"0000",
            m_cursor => cpu_debug(15 downto 0),
            -- outputs
            char_addr => inp_addr,
            cursor_hit => inp_cursor,
            active => inp_active
        );

prgwin: entity work.hwindow
        Generic map (
            top =>     X"0C",
            left => X"08",
            width => X"40",
            height => X"1E"
        )
        Port map (
            enable => '1',
            x => x80,
            y => y60,
            m_base => X"0080",
            m_cursor => cpu_debug(15 downto 0),
            -- outputs
            char_addr => prg_addr,
            cursor_hit => prg_cursor,
            active => prg_active
        );
And how they look on VGA screen (this program is loaded into RAM, and "list 100,999" command is issued):

The "magic" here is the "active" output signals. Because these two windows share the same "core" memory, the active one decides which "char_addr" will drive the address MUX of that memory. It could be both (in case of overlapped windows), but same signals are also fed to an equivalent of a "74x148" priority encoder to arbitrate which window is top of view stack etc. This is all hardcoded now, but could be made programmable (essentially creating text based "sprites" that could be moved and resized on the screen)
Discussions
Become a Hackaday.io Member
Create an account to leave a comment. Already have an account? Log In.