The 
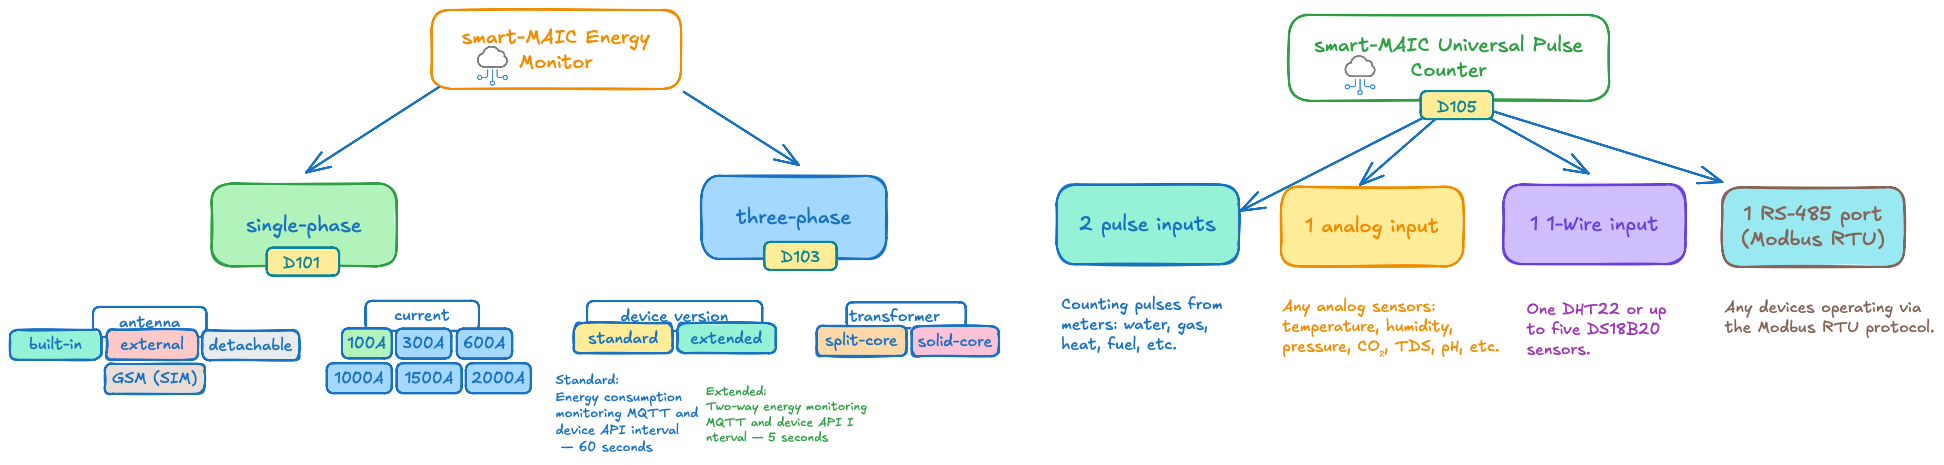
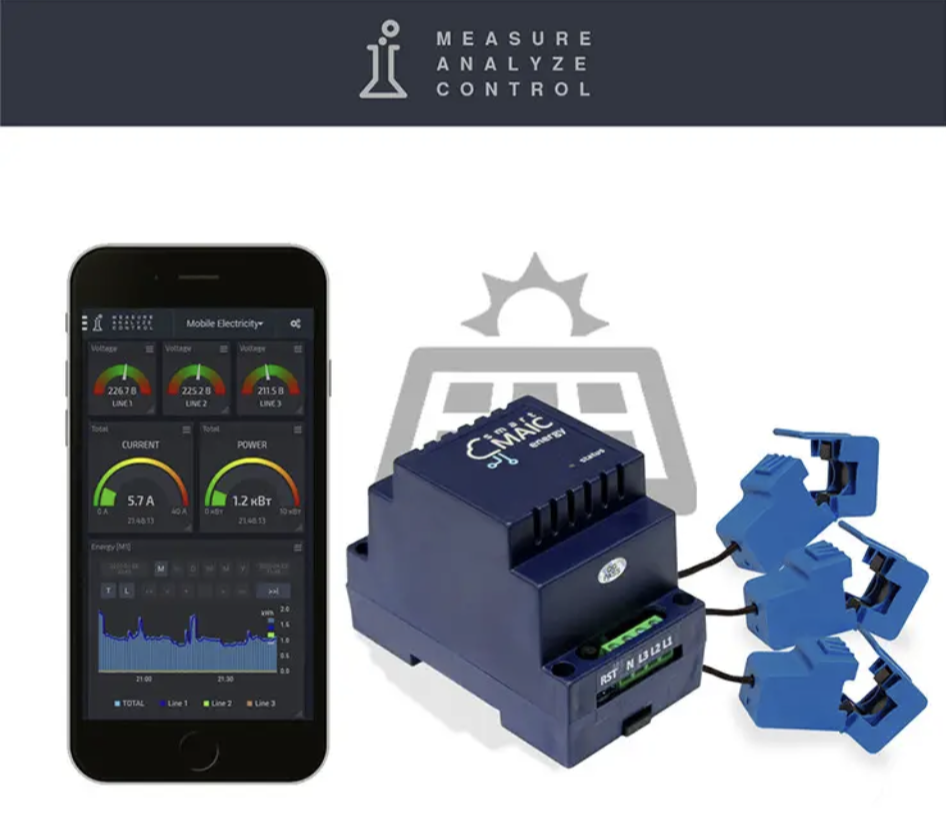
smart-MAIC Energy Monitoring System is a commercial solution designed to help households and businesses track, visualize, and analyze energy consumption. It integrates smart meters for electricity, water, gas, and heat, collecting real-time data and storing it securely in the cloud. Users can access detailed insights through web dashboards, allowing them to monitor usage patterns, detect inefficiencies, and make informed decisions to reduce consumption and costs.
The system provides intuitive visualizations and reporting tools, making it easy to understand trends and anomalies without technical expertise. While primarily targeted at professional and residential energy management, smart-MAIC can be adapted for various monitoring scenarios, offering flexibility and scalability.
Energy costs are rising globally, yet most of us have no real visibility into where our consumption goes. Do you know which appliances are your biggest energy drains? If you have solar panels, can you track how much energy you're generating versus consuming in real-time? For businesses paying commercial rates — often 2-3 times higher than residential — every wasted kilowatt-hour hits the bottom line hard.
Whether you're a homeowner trying to cut costs, a solar panel owner optimizing self-consumption, or a business manager tired of surprise utility bills, understanding your energy flow is the first step to control.
⚡ Smart-MAIC Devices and Capabilities
Smart-MAIC devices fall into two main categories: energy monitors and universal pulse counters.
Energy Monitors
Energy monitors continuously measure electrical grid parameters and power consumption. They're available in single-phase and three-phase configurations, connecting via current transformers—either solid-core rings or split-core clamps. Split-core clamps offer easier installation since they open completely, while ring types have a smaller footprint in your electrical panel.
Models come in standard and extended versions. The key difference? Extended versions support bidirectional energy metering (essential for solar setups) and faster data refresh rates via API/MQTT—5 seconds versus 60 seconds in standard models.
Smart-MAIC devices are available with maximum current ratings of 100A, 300A, 600A, 1000A, 1500A, and 2000A per phase, allowing you to match the monitor precisely to your actual load. For three-phase installations, total current capacity can reach up to 6000A.
What Parameters Can You Monitor?
Every energy monitor tracks:
Voltage (V) — grid voltage level
Current (A) — phase current
Active Power (W) — actual power consumption
Active Energy (Wh) — cumulative energy consumed
Power Factor (PF or cosφ) — efficiency metric
Reverse Active Power (rW) — energy returned to grid (extended versions only)
Reverse Active Energy (rWh) — cumulative energy fed back (extended versions only)
Universal Pulse Counter
The universal pulse counter handles water, gas, and heat metering, plus temperature, humidity, pressure, light, water quality sensors, anemometers, and much more. Each unit features:
2 pulse inputs
1 analog input (0.1V – 18V)
1 1-Wire port
1 RS-485 port (Modbus RTU)
Application Examples
Pulse inputs count pulses from water, gas, heat, and specialized meters (fuel, milk, beer, you name it). The analog input accepts any analog sensor—temperature, humidity, pressure, water level, pH, salinity, dissolved oxygen, etc. The 1-Wire port supports one DHT22 sensor or up to five DS18B20 digital temperature sensors. The counter also supports digital sensors via RS-485 using Modbus RTU protocol, including sensors for temperature, humidity, barometric pressure, CO₂, wind speed and direction, noise level, and even solar inverters.
📊 Dashboard Interface
All devices monitor and transmit data in real-time to the cloud, where all analytics are stored. If a device loses power or fails, no data is lost. Even without internet connectivity, devices can store data locally for over a week and sync it later when connection is restored.
The Smart-MAIC interface offers flexible data visualization in whatever format works best for you. You can create multiple custom dashboards—for yourself, family members, or different departments. Each dashboard can be shared via public link, even with non-authenticated users.
No need for separate data storage and visualization systems—it's all built in, with real-time energy consumption monitoring at its core.
For example, you might configure your personal view to display energy consumption in watts, while accounting sees the same data in local currency based on your utility rate. This access control approach is particularly useful: everyone sees only the metrics they actually...