mircemk
Recently, in one of my previous videos I presented you a Retro VU Meter project on round displays with ESP32 Microcontrollers and the Adafruit GFX library. In that case, the VU meters are drawn using the library functions, but the code is still relatively complex and you could see the result in that video.
In this project I will also show you a way to make a Retro VU Meter, but now using LVGL wich is a free and open-source library that enables you to create graphical user interfaces for any MCUs from any vendor on any platform, and also Squarelinestudio UI editor to design and develop beautiful UIs for your embedded devices quickly and easily. The result of using these two tools is immediately visible, the VU meters are extremely realistic, and at the same time the code is much simpler and more flexible.
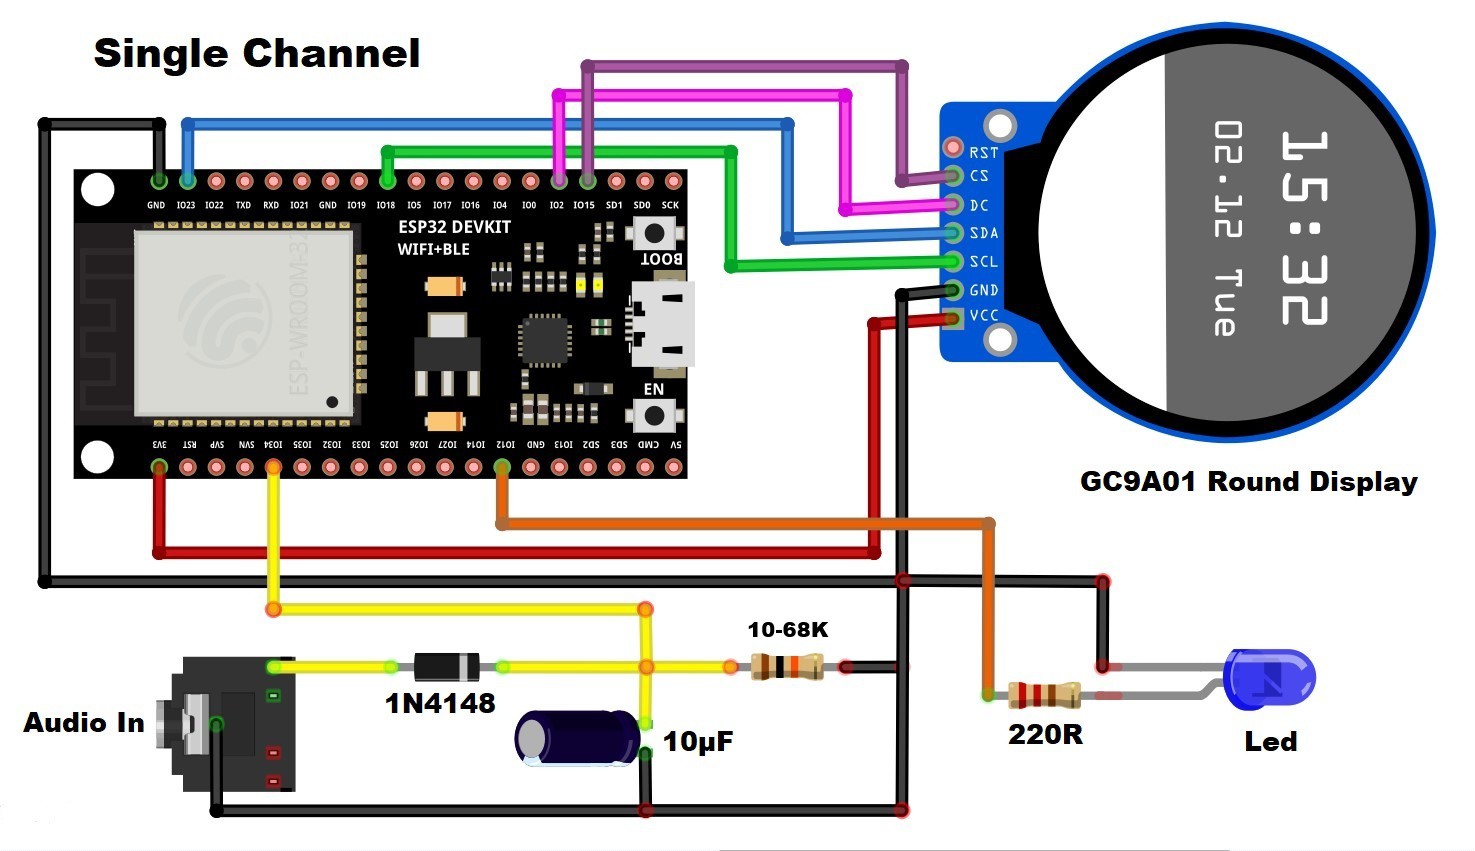
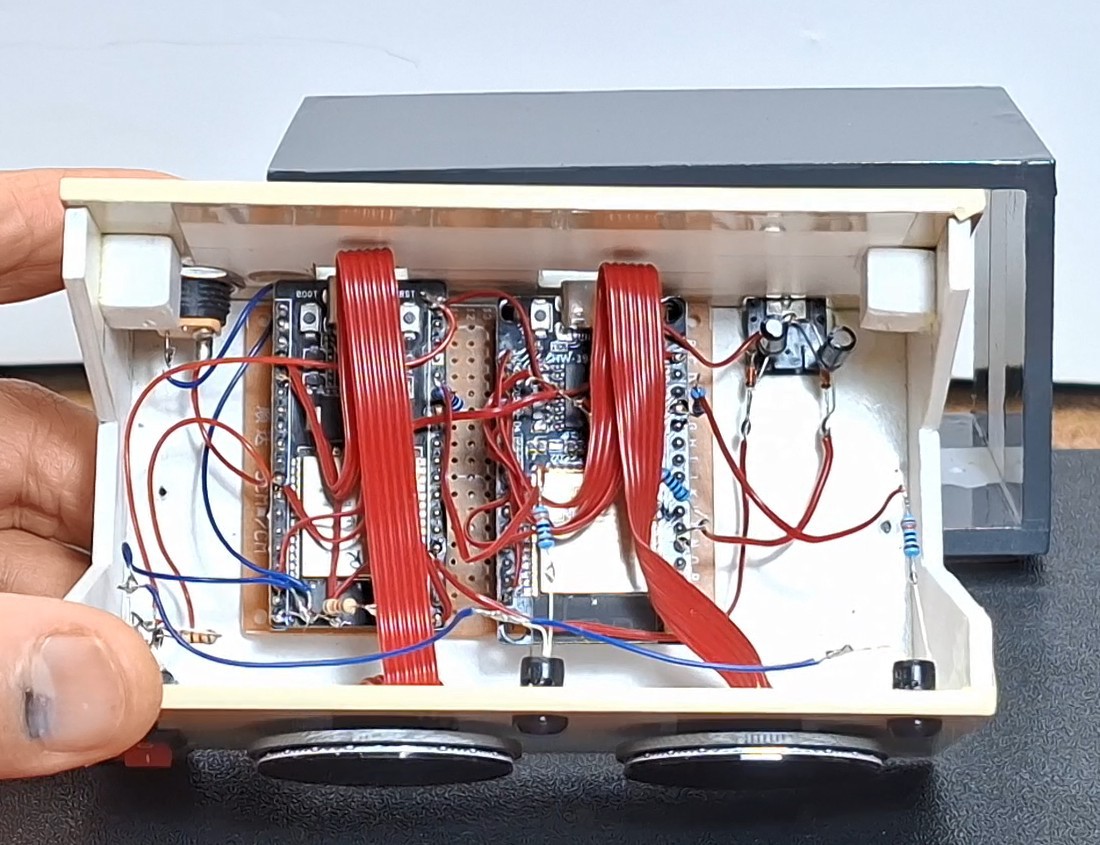
The hardware part is identical to that of the previously mentioned project and consists of only a few cheap components:
- Two ESP32 microcontroller boards, one for each channel separately. Here I should mention that I could have made the project with one MCU, but considering the price, I decided to use two, which makes the production simpler and has more advantages.
- then two round displays 1.28 inches 240x240, with GC9A01 driver chip
- several resistors
- two diodes and capacitors for processing the input signal
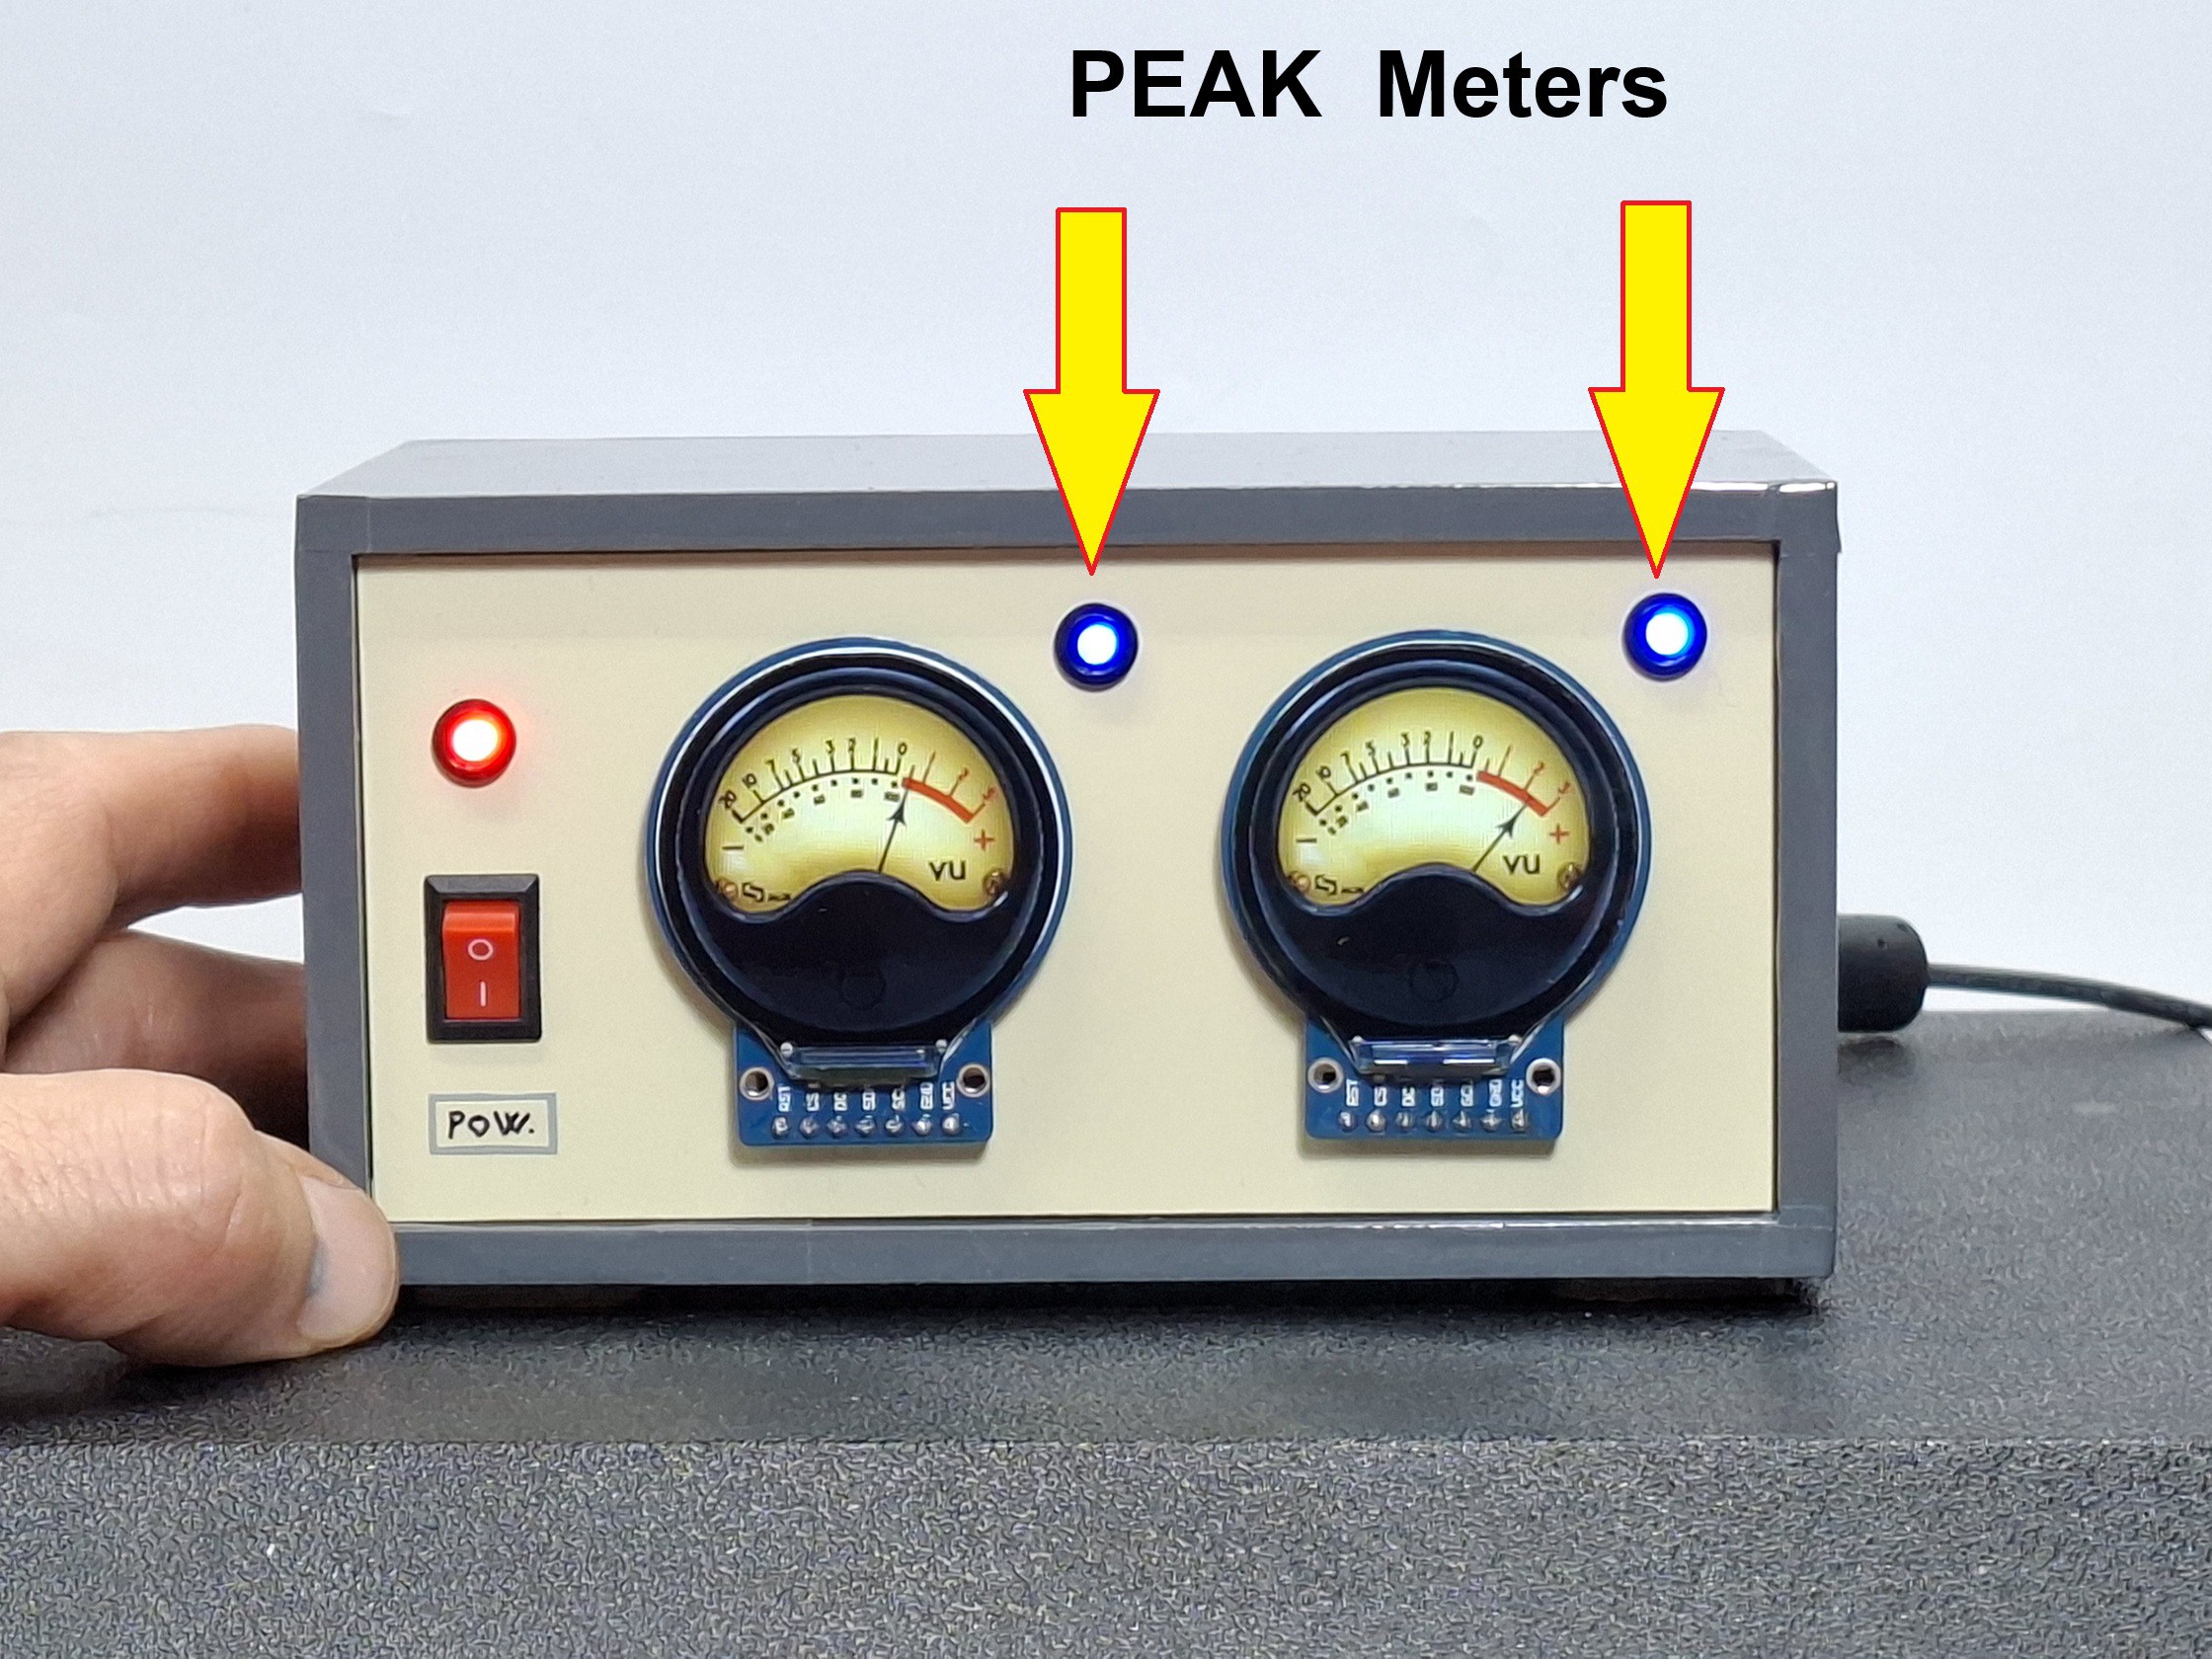
- And two LEDs for the Peak Meter function
The diodes together with the capacitors at the input make up a so-called Envelope Follower circuit that brings a signal suitable for further processing to the input of the MCU. The Peak Meter LEDs are connected via appropriate current limiting resistors and the displays are connected via the SPI Interface.

This project is sponsored by PCBWay. From concept to production, PCBWay provide cutting-edge electronic design solutions for global innovators, Including hardware design, software development, mechanical design, product testing and certification. PCBWayengineering team consists of experienced engineers in electronics, embedded systems, and product development. They successfully delivered hundreds of projects across industries such as medical devices, industrial automation, consumer electronics, smart home, and IoT.
As for the code, it generally consists of two parts: UI files generated with SquareLine Studio and the basic .ino code that uses the LVGL library to "manage" these files.
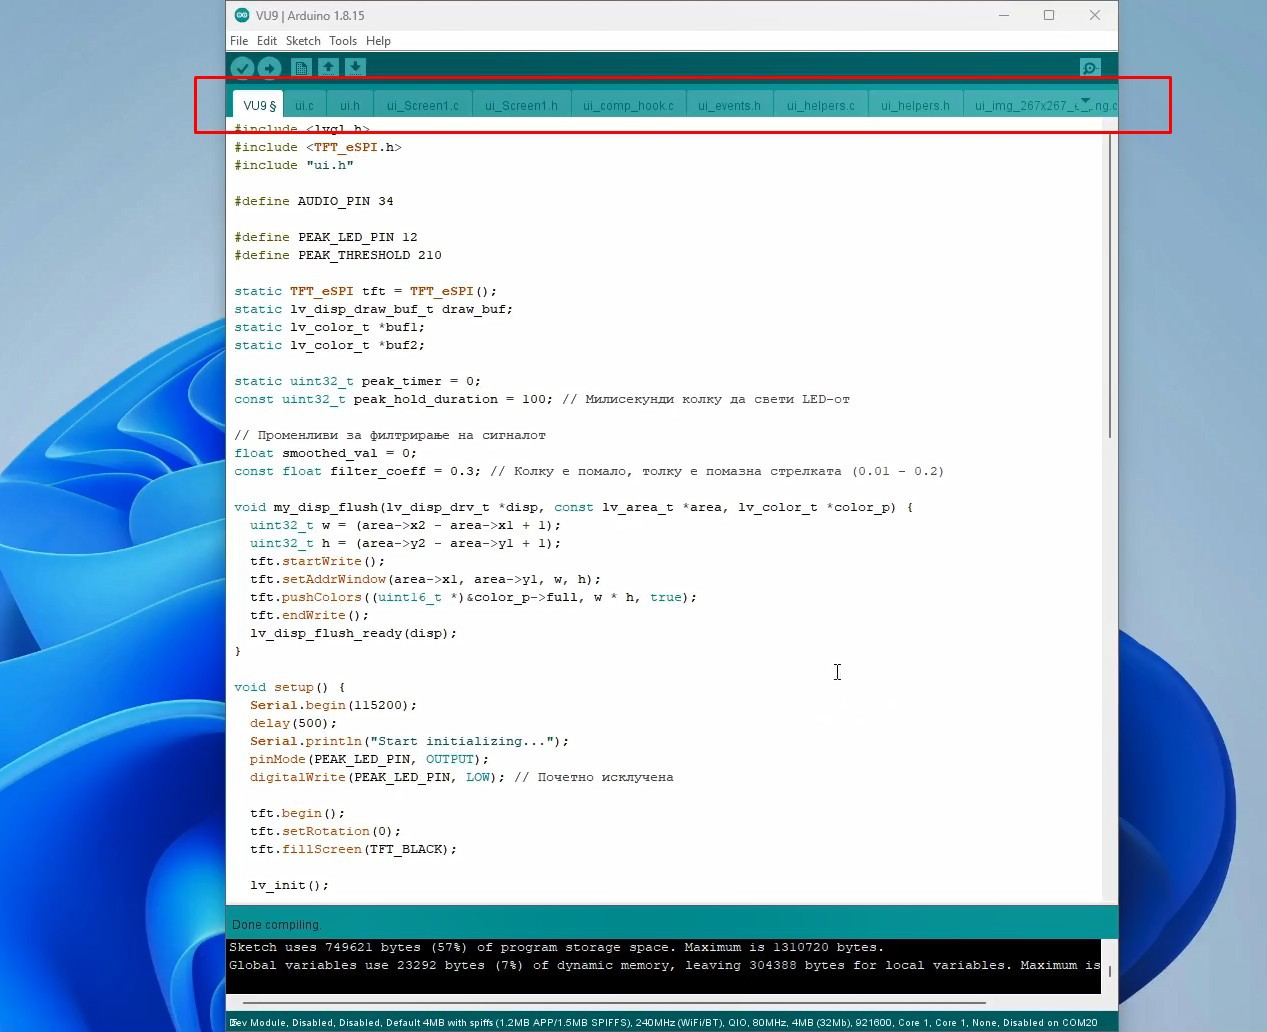
To briefly mention that I am using Arduino IDE version 1.8.16, ESP32 Core ver. 2.0.14 and LVGL library ver. 8.3.11. The name of the folder containing the code files should be the same as the name of the .ino file inside the code. Now we simply run the .ino file and compile and upload the code. We make the basic settings directly in this file.
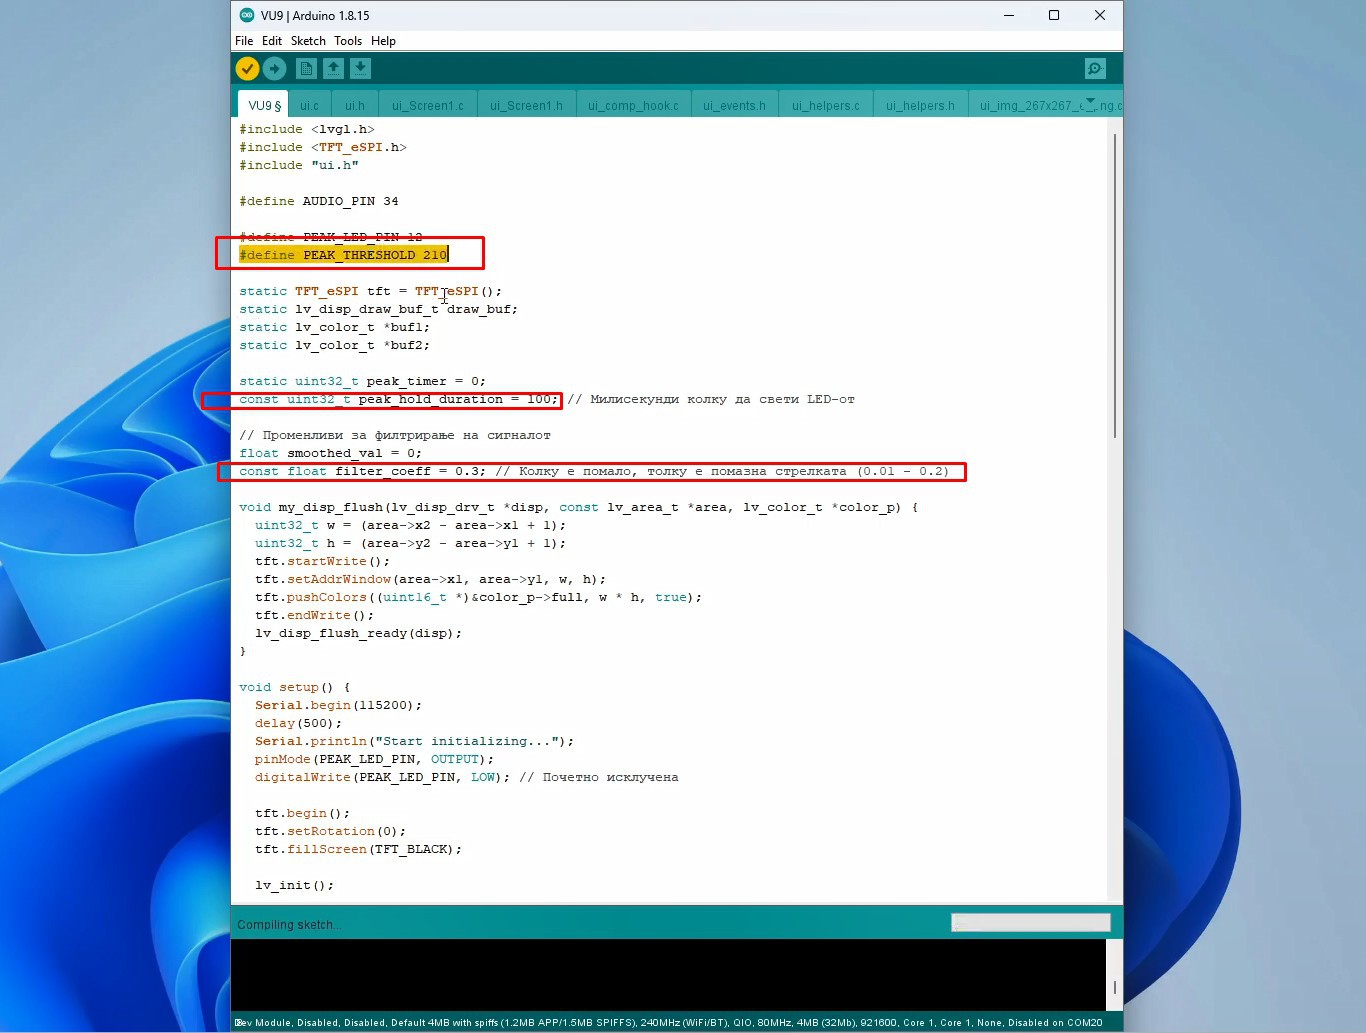
Code have the part where you can change value at which the Peak LEDs are turned on, then the duration of the activated LED, the way the arrow reacts, and finally the sensitivity of the inputs. The code is identical for both channels. By the way, I should mention that we can also adjust the input sensitivity in a simple way with a stereo potentiometer.
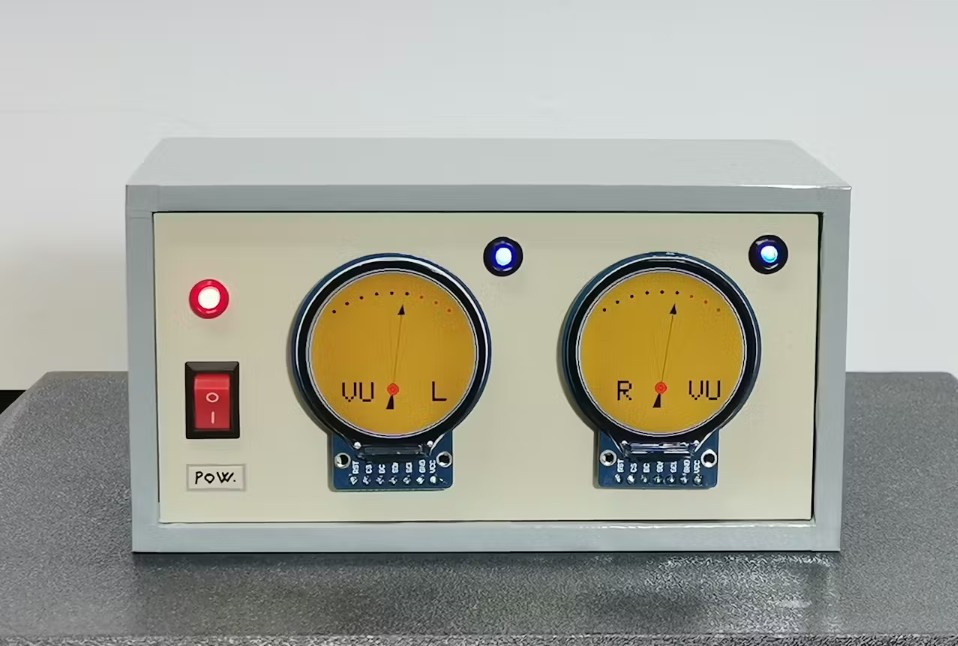
Now let's see how the device reacts in real conditions. Immediately after switching on the VU meter is active, and the arrows move, following the intensity of the incoming audio signal. If this signal crosses the previously defined limit, the Peak LEDs light up. As I mentioned earlier, the speed and the way the arrows move can be changed in the code.
And finally a short conclusion. This project is a modern twist on the classic analog VU meter, using a powerful ESP32 microcontroller and a circular TFT display to achieve an authentic retro look with modern precision. Using the LVGL library and SquareLine Studio, I created a visualization that is not only functional, but also aesthetically enriches any audio system.