Jon
JonThe Workflow: Server to Client Architecture
eDashboard operates as a server-client system where Home Assistant acts as the rendering brain and the reTerminal acts as the beautiful display peripheral.
Server Side (Home Assistant)
- Installation: The custom component installs directly into Home Assistant via HACS, requiring no external servers or Docker orchestration.
-
Rendering Pipeline: At configurable intervals (default: every 5 minutes), the component:
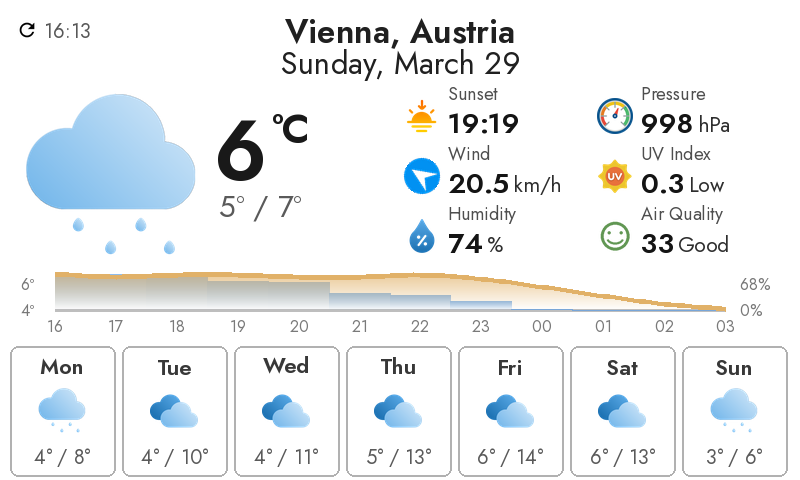
- Pulls live weather data from Open Meteo (sunset/sunrise times, pressure, temperatures, humidity, wind speed, air quality index, uv index, conditions and forecasts)
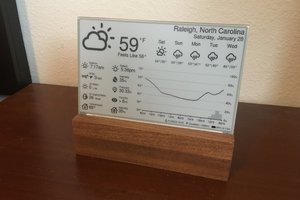
- Renders a beautifully composed weather dashboard with current conditions, hourly trends, weekly forecast
- Optimizes the layout for e-paper readability and minimal visual clutter by dittering the image and recomposing it with pixels in the actual e-paper color-range.
- Generates four output files:
latest_rgb.png: Full RGB image (1.2–1.5 MB) for preview and non-e-paper displayslatest_epd.png: Dithered version optimized for e-paper (300–600 KB), PNG formatlatest_epd.bin: Compact EDB7-v1 binary format (192 KB fixed) with 4-bit palette indices, optimized for bandwidth-constrained clientsmetadata.json: Configuration, location, latitude/longitude, timezone, and generation timestamp
![]()
![]()
-
API Endpoint: Exposes a REST endpoint that clients poll to fetch the latest dashboard:
- GET
/api/edashboard/latest?dashboard=<location_name>– Returns the dithered PNG image optimized for e-paper- Query parameter
dashboardis derived from the location (e.g., "Vienna, Austria" →?dashboard=vienna) - Returns HTTP 404 if dashboard not found
- Includes cache-control headers to prevent stale responses
- Query parameter
- GET
-
Service Automation: A Home Assistant service (
edashboard.generate_now) allows automations to trigger dashboard updates on-demand:- Optional
dashboardparameter to regenerate a specific dashboard (omit to regenerate all configured dashboards) - Example:
service: edashboard.generate_noworservice: edashboard.generate_now data: {dashboard: vienna}
- Optional

Client Side (reTerminal E1002)
- Hardware: The Seeed reTerminal E1002 is an ESP32-S3 device with a Spectra E Ink display (800×480 pixels), perfect for displaying the dashboard.
-
Firmware: ESPHome firmware running on the device connects to Home Assistant over Wi-Fi and:
- Periodically fetches the latest dithered image from the server
- Downloads and decompresses the image into the display buffer
- Triggers a refresh cycle on the e-paper display
- Returns to sleep to conserve power
- Display: The 800×480 e-ink panel shows your dashboard with minimal power drain, making it perfect for always-on wall-mounted displays or desk decorations.
Configuration
Getting eDashboard running is straightforward:
Step 1: Install via HACS
- In Home Assistant, open HACS
- Add this repository as a custom repository
- Search for eDashboard and install
Step 2: Configure Home Assistant (configuration.yaml)
edashboard:
  refresh_seconds: 300                    # Update every 5 minutes (weather refresh interval)
  location: "Vienna, Austria"             # Your location for weather data
  temp_unit: C                            # Celsius or F
  wind_unit: km/h                         # km/h or mph
That's it! The component automatically:
- Resolves latitude, longitude, and timezone from your location string using Open-Meteo Geocoding API
- Fetches current weather conditions, temperature, wind speed, and forecasts from Home Assistant
- Renders the consolidated weather display
Step 3: Restart Home Assistant
After configuration.yaml updates, restart Home Assistant. The component will:
- Generate the first dashboard automatically
- Start the refresh timer
- Expose endpoints at
/api/edashboard/*
Step 4: Flash ESPHome Firmware to reTerminal E1002
Create an ESPHome configuration (example provided in /esphome/edashboard.yaml):
substitutions:
  device_name: reterminal_1002
  friendly_name: eDashboard
 image_url: "http://homeassistant.local:8123/api/edashboard/latest?dashboard=vienna"
...
Read more »

 Zane
Zane
 mircemk