 Joan Horvath
-
Log #20: epub3 version of Make: Calculus
09/24/2022 at 01:35 • 0 commentsFrom the beginning we wanted to make our math explanations as accessible as possible. It turns out that it's pretty challenging to preserve the math in a form readable by screen-readers. Thanks to heroic efforts by Make's production team, there is an epub3 version of Make:Calculus at https://www.makershed.com/products/make-calculus-pdf. The Thorium epub3 reader is recommended. (The link gives you a pdf for visual reading, too.) Of course if you like paper, that's available at https://www.makershed.com/products/make-calculus-print and the usual other retailers.
-
Log #19: Make: Calculus up for preorder!
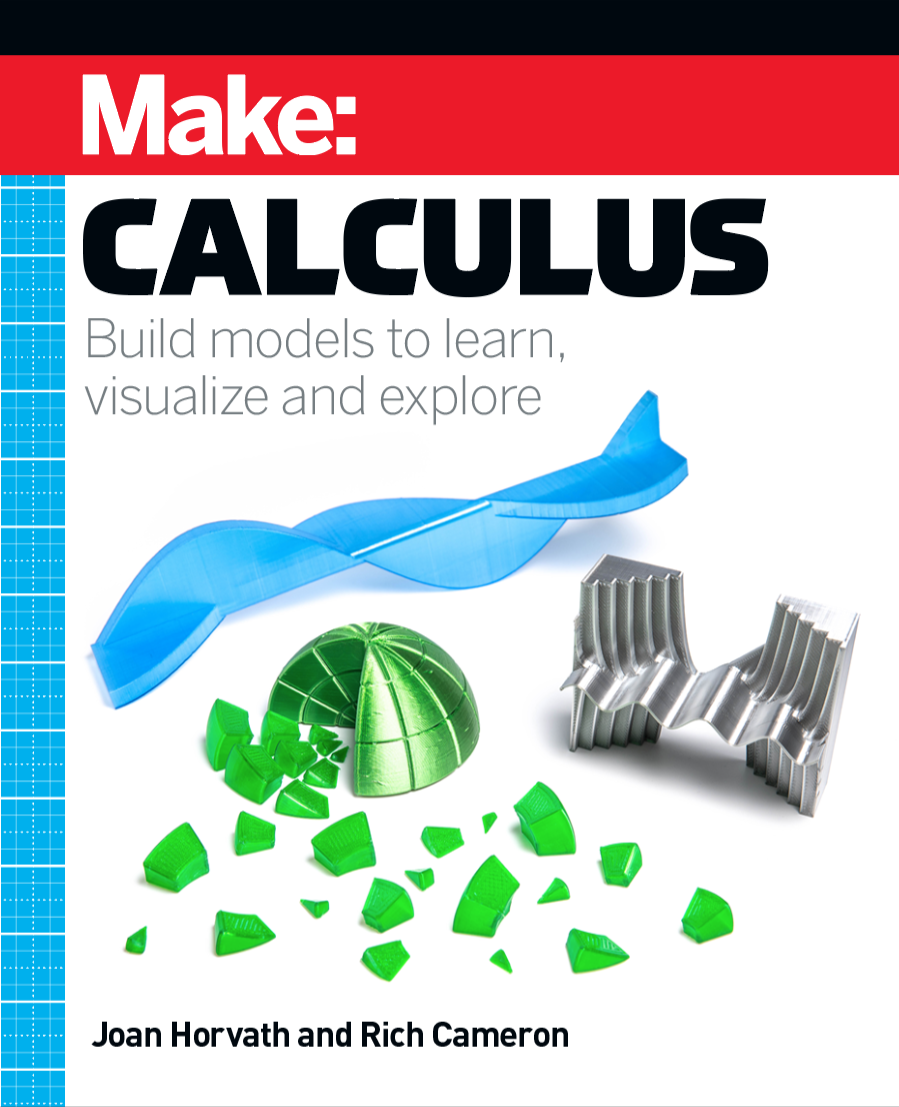
06/26/2022 at 03:10 • 0 commentsWell, it has been a long and winding road... but @Whosawhatsis and I are excited to announce that our book, "Make: Calculus" is now up for preorder in the Maker Shed. Things went in a lot of unexpected directions over these five years(!) but it worked out in the end! For more, see https://www.makershed.com/products/make-calculus-print
![]()
-
Log #18: Video of our Supercon talk is up
02/16/2019 at 17:46 • 0 commentsIf you missed our talk at Supercon, there's now a good writeup on Hackaday, with video of the talk embedded. Here's the link: https://hackaday.com/2019/02/15/understanding-math-rather-than-merely-learning-it/.
-
Log #17: Supercon presentation & Make Magazine
10/07/2018 at 18:14 • 0 commentsFor those of you following along with our progress, you'll be glad to know that we are doing a Hackaday Supercon presentation! We are scheduled as the first talk on Sunday morning, Nov. 4 (10 AM). Supercon tickets still available at https://www.eventbrite.com/e/hackaday-superconference-2018-tickets-47386813234
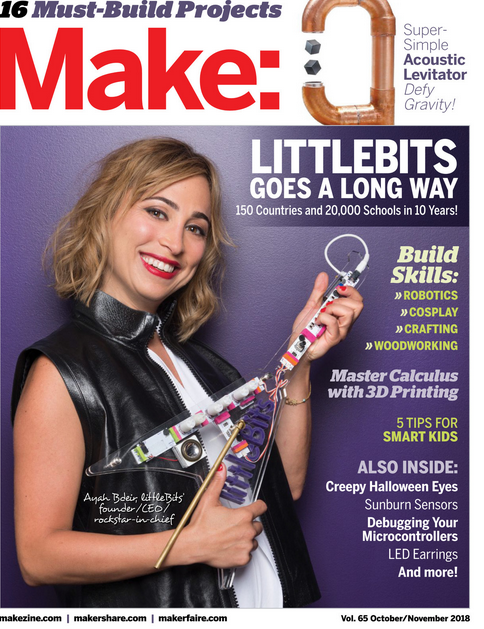
Also, we have a writeup about our math and science modeling in general in the new issue (Oct/Nov 2018) of Make magazine. Check it out!
![]()
-
Log #16: New repository is up - presentation 6/15
06/08/2018 at 18:55 • 0 commentsRich has now organized our relatively-mature models into a Github repository. Let us know if you try them out! Details in the repository notes. https://github.com/whosawhatsis/Hacker-Calculus-models
We've updated the predator-prey time model to create a surface that can be viewed a little better than the previous model. You could turn the earlier model (Log #12) to do this, but we think the new one is more intuitive.
We encourage experimentation and the Github repository should facilitate that. Meanwhile work continues apace on our book and other ideas... stay tuned, and contact us via this site or Nonscriptum.com's "contact us" link if you have ideas.
We'll also be presenting this next week at the American Association for Advancement of Science (AAAS) Pacific Division Meeting in Pomona. On Friday Rich and I will be chairing a Scientific Maker event and Open Source Hardware Science Workshop - come on out if you are in the area. (Registration fee required.)

Predator prey: time series of prey view 
Predator prey: time series of predator view ")
Predator prey: predator/prey phase space (looking down time axis) -
Log #14: Talk at UC Berkeley April 2nd
02/24/2018 at 05:07 • 0 commentsIf you're in the Berkeley (CA) area and interested in this, we're giving a talk at the Berkeley Graduate School of Education about Hacker Calculus on April 2nd. They've posted it now http://events.berkeley.edu/index.php/calendar/sn/townsend.html?event_ID=115692&date=2018-04-02. Hope to see some friends there!
-
Log #13: updated video
10/07/2017 at 04:04 • 0 commentsWe decided to update our project video to make a few things a little clearer and to add some bits. Check it out! (Linked in the project video slot, and also embedded in the Details section.)
-
Log #12: A taste of differential equation models
10/06/2017 at 00:41 • 0 commentsWe were going to start shifting over to a site more oriented toward learning calculus (rather than our musings about how we are doing the development) but we thought we would put up just one more idea here first to get some feedback. It's a little preliminary, so we're not posting the models yet- but we would love some thoughts on the ideas!
Our PID controller model is really a model of a two-dimensional system- a signal and its variation with time. We made it a three-dimensional piece by showing the derivative and integral of the system to show how each of these contributes to the final solution on a PID controller. But in some ways, you could do that with multiple lines on a traditional graph.
So, instead, we said: what if you could model a truly 3D system, where you are showing how, for instance, two things are varying with time? We hunted around a bit and asked some folks for good candidate equations, and our mathematician friend Niles Ritter suggested we look into the predator-prey equations.
These equations model how two populations, one of which eats the other one, vary over time. Populations will swell and contract as first the prey have a population boom and then the predators catch up and overtake. (Often the example used is rabbits and foxes, if this is starting to sound dimly familiar!)
The equations for this are called the Lotka-Volterra equations, and they come up in a variety of other contexts as well. Their basic form is a pair of equations like this, where x = predators, y = prey, t = time, and a, b, c and d are constants:
dx/dt = ax – bxy
dy/dt = cxy – dy
We approximated dx/dt in the most simple-minded way possible:
dx/dt = x at the current time – x at the previous time/time difference
creating a standard time step and solving for x and y at each time step by using x and y at the previous time step. There are many more sophisticated ways of doing this, but we wanted something simple we could toss into OpenSCAD and mess with.
It turns out (see the Wikipedia article linked above) that if a=2/3, b=4/3, c=d=1, that there is stable oscillatory behavior of the two populations. They grow and sink together. (Another stable state is that both populations go extinct after some wild variation, but what fun is that?)
Our first attempt to plot the three-dimensionally, messing around a bit with a,b,c,d and the starting values for the population, had time coming up from the platform, and looked like this. The numbers of rabbits and foxes are the x and y axes respectively, and time is coming up toward you.
 Expanding Lotke-Volterra equations solution
However, the particular set of equations we were trying out were not supposed to expand like that (although it looked cool.) Joan remembered her graduate school math and realized we needed to use either a smaller time step size or a more sophisticated way of modeling the derivative or both (we went with a smaller time step.)
Rich also decided to try printing with different axes “up” in the print. So here is what the correct version looks like, printed with time going toward the top of the the picture but with each one printed with a different pair of axes on the build platform of the 3D printer:
 Three versions of the visualization, printed with different axis "up" during printing.
 It's also cool to note that two of these fit into each other. The one above that looks like a toilet paper tube is the equivalent of the one that expanded, but with the numerical instability corrected.

Two versions fit into each other
The version we find the most explanatory is the one below. Imagine the line in space describing the rabbits, foxes and time running along the top surface of this, making a spiral. Time goes left to right, rabbits are in the vertical axis, and foxes are toward you in this orientation.

Best orientation predator prey visualization
And if you look straight back through it, you'll see a sinusoid - the projection of the prey varying over time. Looking at 90 degrees gives you the variation of the predators over time.
There are a lot of "famous equations" out there that happen to govern a lot of interesting phenomena, and we want to try out some of the more stable ones once we get the kinks out of this one. We're not putting out the model for this one just yet, because it's still got some numerical instabilities and issues. But we wanted to let you see our very latest cool stuff before the deadline closes in! We are looking into various options for a long-term home for these models and the math, so stay tuned about where these later explorations wind up living.
-
Log #11: The making of our video
08/30/2017 at 04:40 • 0 commentsWe pulled together a few fun bits of video to make a prize video. It's posted in "Details," in the appropriate submission spot, and on YouTube of course, but we wanted to point out a few features.
One of the fun things we realized was that our Log #1 accelerometer would turn green (show zero acceleration in x and y) if it was falling freely. We didn't want to drop our creation very far which meant that we needed a fast video. It turned out that an iPhone 6s in "slo mo" was perfectly fine for capturing the effect. (We dropped it just a few feet into a very big soft pillow - we don't recommend doing anything more drastic than that to your poor Circuit Playground and battery.)
We also felt validated that the objects really do make more sense when we can move them around and talk about them. We hope a lot of readers will make their own, which is even better than watching a video!
One other note: the 3D printed piece showing x^3 versus x^2 curve (derivative and integral) has the two curves scaled differently from each other to make the shape of both curves clear. Scaling for these curves and avoiding unprintable pointy or very thin parts is proving to be tough! Another research area for us!
-
Log #10: Now what?
08/17/2017 at 19:15 • 0 commentsThis project is a little different from many of the other Hackaday project, since we are not focused on building one thing, but rather on coming up with an approach to solve a problem that is made possible with technologies like 3D printing.
Now that this has generated a lot of energy and interest, we have to stop and think where we will take it beyond this prize entry. A lot of people ask us if we have a "3D printing curriculum." By that they (usually) mean a few models they can download and plug into an existing curriculum.
Although we appreciate that an incremental approach has its power (and our books support that approach) we think the thing to do now is to go back to our original thought: how can calculus in particular and math in general be taught differently if one starts with the "interesting stuff" and then gradually walks in the calculation part?
Several people suggested we read "The Mathematicians Lament," by Paul Lockhart, (available in a variety of places depending on what online databases you have access to search on the title and name). Lockhart was (and apparently still is) a K-12 math teacher in New York. His premise is that if we taught art the way we teach math, the first few years would be all about creating the perfect brush stroke, and everyone would hate art. He suggests finding ways to show the beauty and application of math first, and teaching the routine stuff later. We agree!
As we have explored this space with this project so far, it has become clear to us that we need to teach calculus in a very different order than it normally is taught. Therefore, we will need to create a new end-to-end system of teaching (and learning) the subject, and we are currently thinking hard about what that system looks like and what it should include.
Not everything has worked out. The "derivative machine" was more complex than expected, and so it violates our design rule that anything we put out there should be build-able by a good student or a time-pressed teacher. Rich is going to continue to tinker with it to see if a simple version might emerge, but as far as this project is concerned going forward we are going to focus on 3D printing and maybe a few more Circuit Playground applications as a good lowest common denominator.
How Far Can This Go?
So, we see our challenge as finding a good way to lay out all of calculus (whatever that winds up meaning) with physical intuition at its core. We have been gratified with how many people have encouraged us and made suggestions, in some cases getting quite energetic about it.
In the coming months we will be thinking about how to scale this, finding good groups to collaborate with, and seeing how far we can stretch the premise here. Can we usefully go beyond the PID example (in which everything is a function of time) to more-complex systems in which several things are varying at once? Can we use these parts to help us think about differential equations? Or should we be looking at how to start with these ideas and move back the other direction toward geometry, algebra, and the notorious algebra II?
Stay tuned, and follow the project or contact us to keep in touch with its ultimate incarnation. Thanks for coming along for the ride so far!
 Sinusoids and exponentials
Hacker Calculus
Isaac Newton was a hacker. Let's take calculus back to its roots and make it accessible to everyone.


")
 Expanding Lotke-Volterra equations solution
 Three versions of the visualization, printed with different axis "up" during printing.

 Sinusoids and exponentials