 Michael Doody
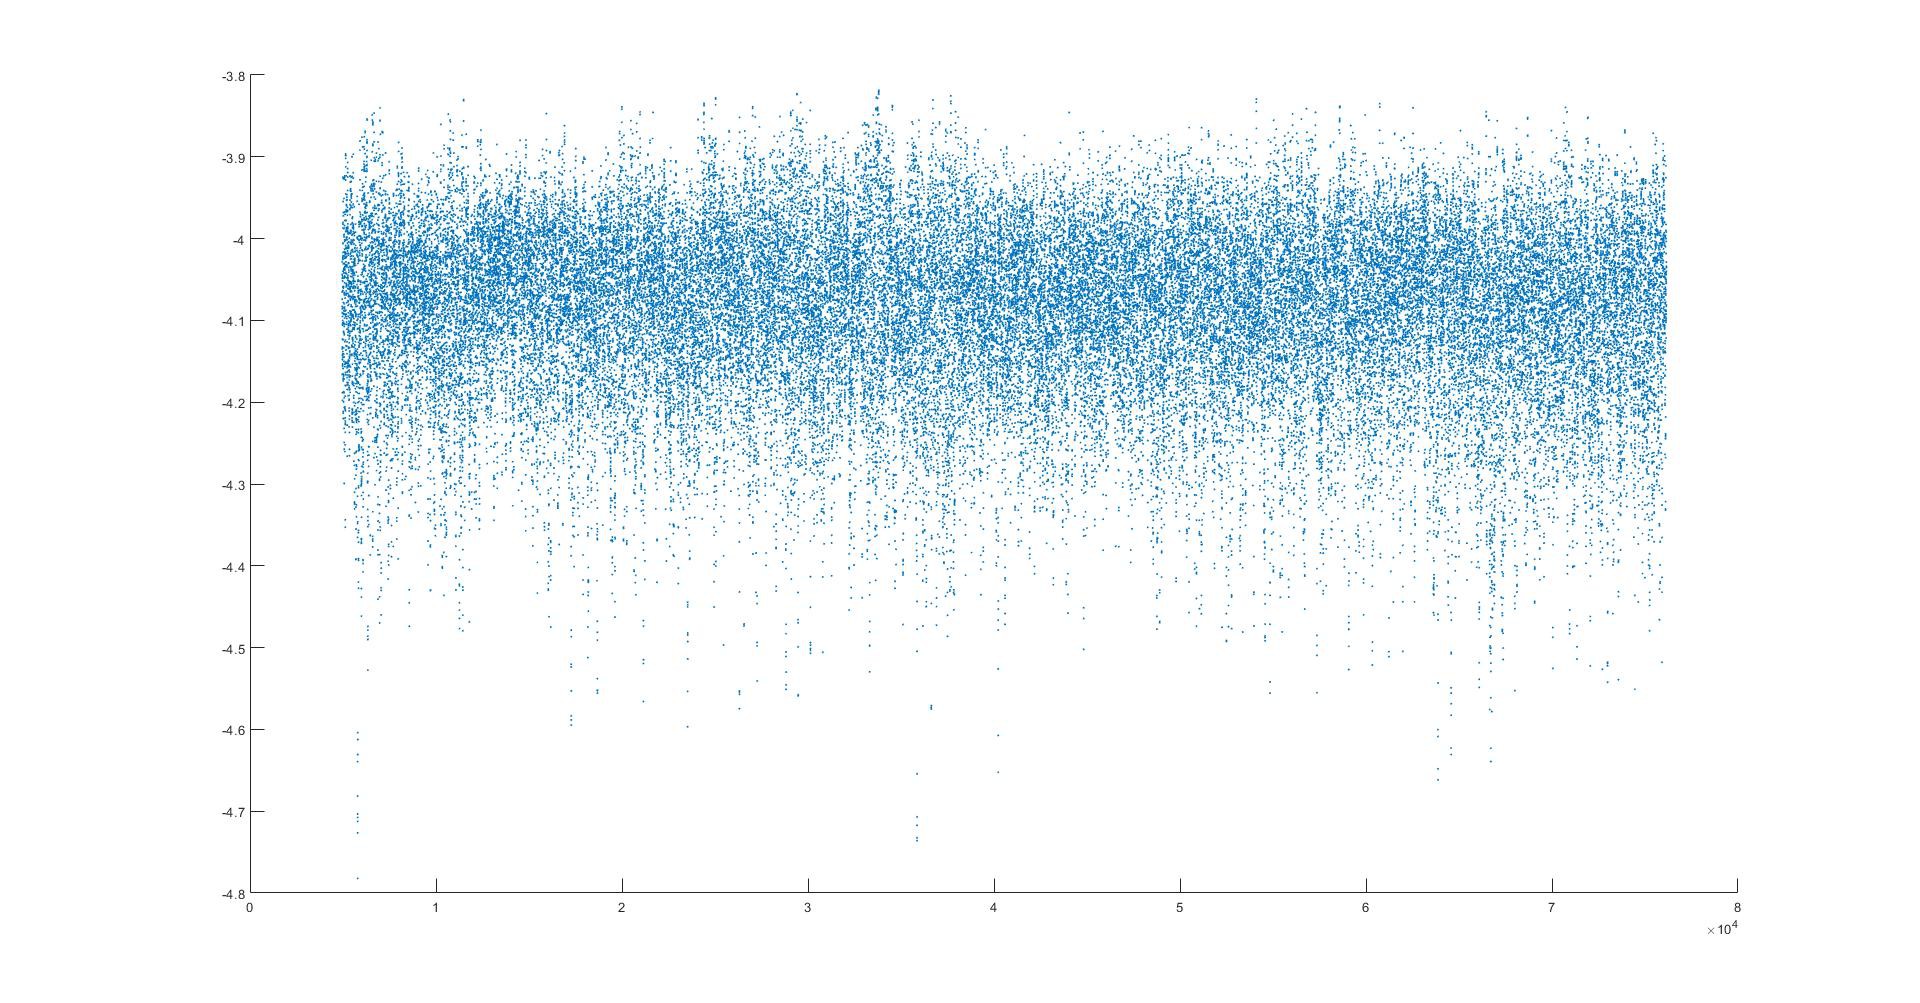
Plots of the moving average of the seismic noise probability data seem to show that the noise comes in discrete clusters of abnormal statistics. The following plot is a 10 second moving average of the 1 second combined noise probability data points. Click or double click on the image to see more detail.
Here is the compass direction of 24 hours of noise 3D magnitude in +/- degrees from North. East is to the left. North is 0 degrees and South is either + or - 180 degrees. Much of the noise originates from the West, with a strong concentration along the North/South axis. The device is roughly 70 miles Northwest of the center of Yellowstone lake.

Discussions
Become a Hackaday.io Member
Create an account to leave a comment. Already have an account? Log In.