 josefschneider
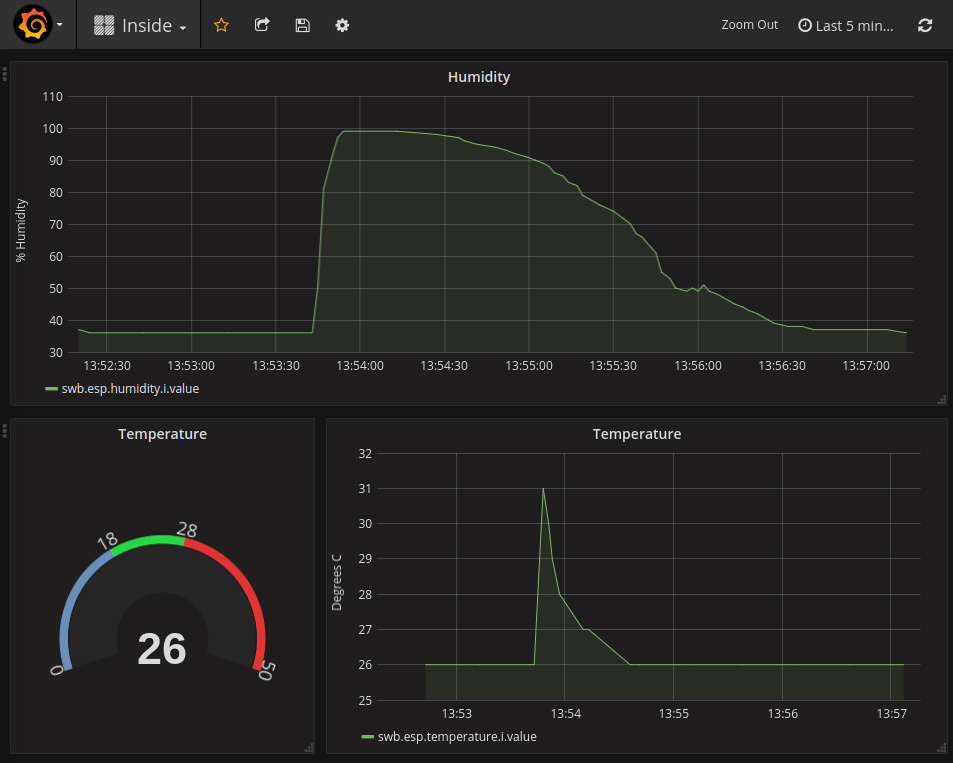
InfluxDB (https://www.influxdata.com/) is a time-series database perfectly suited for the storage of sensor values, and because it provides a Python client library I was able to write an IOData agent app. I'm very keen on InfluxDB because it is natively supported by Grafana (https://grafana.com/), a beautiful, flexible data visualisation suite. After installing InfluxDB and Grafana and launching the swb_influxdb_save app all the Switchboard device values are automatically stored. When creating the following dashboard I was able to select the devices I wanted to plot from a drop-down menu:
As usual, a rough guide on how to setup this app can be found in the repo in the apps/swb_influxdb_save/README.md file.
Discussions
Become a Hackaday.io Member
Create an account to leave a comment. Already have an account? Log In.