Stress and its Relation to Heart-rate Variability (HRV)
Stress is a physiological condition that can be caused by various external stimuli or by our own minds and is mostly considered to be bad (there are also forms of “good” stress). Stress could range from physical stress to mental stress because of excessive cognitive activity (a bad day at the office!). It has been found that stress is a major factor in the cause of several diseases including cardiac disease, and there are a lot of statistics on these issues.
The autonomic nervous system
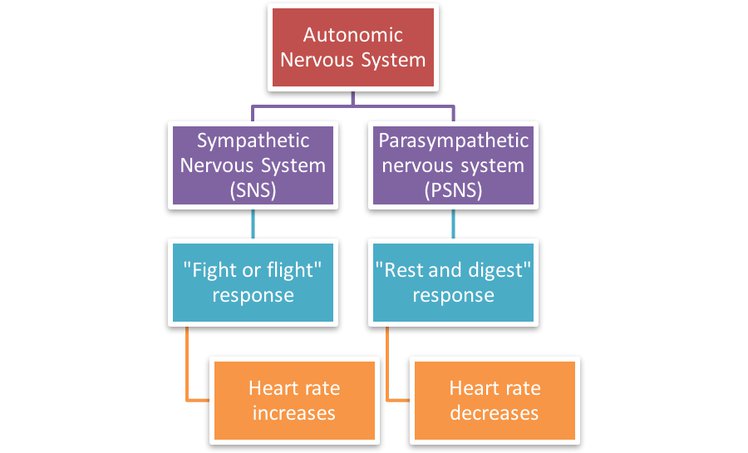
The human body’s Autonomic Nervous System (or ANS), the part of the nervous system that controls the functions of the different organs, is divided into two: the sympathetic (SNS) and the parasympathetic nervous systems (PSNS).
The SNS and PSNS regulate the autonomic functions of the body such as breathing, swallowing, cardiac function and several others. These two systems are complementary in nature - while the SNS functions as a “fight-or-flight” response, the PSNS takes care of the “rest-and-digest response”.
Normally, there is a careful balance of the PSNS and SNS activity to ensure proper functioning of the bodily functions. However, during conditions of stress, there is more SNS activity in the mix, which leads to more of the “fight-of-flight” response, thus subjecting one to be “on edge” at all times. This imbalance is what causes us to sweat, the heart to beat faster and muscles to tense up. Because the body is more involved in these functions, it tends to lower activity in other functions which leads to bad things.
So how’s HRV related to stress?
The current way to measure stress levels and treat stress is usually by psychological questions and discussion during psycho-therapy or counselling sessions. Short of analysing physiological signals such as EEG and biochemical tests (that typically require blood samples), there is no other way to quantify stress. Recently, HRV has been proven to be a very useful and reliable tool for stress assessment.
The “heart-rate” is sometimes recorded as single number such as 70 beats-per-minute (bpm), but it’s more accurate to treat heart-rate as a range (such as 60-70 bpm), as the rate will change over any given time-period. Conventional heart-rate monitors average this range over a period of time (usually 5 minutes) to arrive at a single number. In reality though, it always varies, there is always a constant acceleration and deceleration of heart-rate. If there is absolutely no variation at all then it is probably not a real ECG signal!

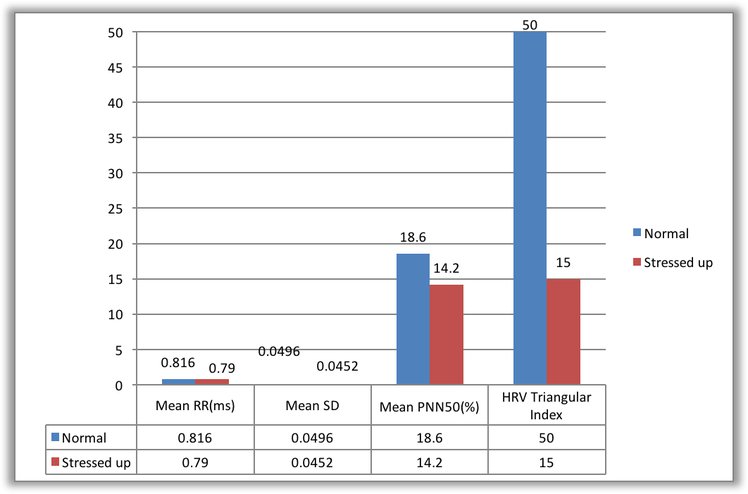
Due to this, under normal conditions, there should be lower variability (because of the PSNS and the SNS balancing out each other). If the variability is too high, it could be due to cardiac disease (which is called Arrhythmia), but even if it is too low, it is a clear indicator of stress.So again, the more stressed you are, the lower the variability. Imbalance adds an unnecessary burden to the cardiac system, leading to cardiac disease.
How does HeartyPatch measure stress?
Conventional methods of heart rate computation from ECG are unable to pick up short-term changes in the heart rate due to their nature of averaging over a set period of time. The reason for this is also partly related to the accuracy of the R-R (peak-to-peak) detection algorithm. HeartyPatch, on the other hand measures “real-time” changes in heart-rate, which is to say that we measure beat-to-beat changes.
There are several different ways detailed in numerous publications to assess stress from HRV. Some of them involve just using the R-R interval time to calculate some basic statistics, while some of them involve frequency-domain parameters to compare frequencies to assess the variability. Since we wanted to simplify this process, we decided to stick to only the time-domain methods.
In the below plot, we use a few time-domain analysis methods to arrive at some parameters that can act as metrics to measure a person’s stress level. The results were surprisingly good. It is quite evident that variability decreases with stress.

Stress is always relative, as is a person’s heart-rate variability. Hence there is no “absolute value” or magic ratio here. A relaxed or calm state of mind is required to set a baseline against which future comparisons can be made.
Expect an app from us in the near future for HeartyPatch to assess stress on-the-go. This will aid people to develop personal relaxation or bio-feedback techniques to control and manage stress.
 Ashwin K Whitchurch
Discussions
Become a Hackaday.io Member
Create an account to leave a comment. Already have an account? Log In.