 Leo
LeoHi all, happy new year for all, it's been a long time since last update, but I haven't stopped working on the project.
I finally got around to create a python webapp using flask. flask is a micro-framework for developing web apps with python. The webapp is currently able to display in a chart all log data from fresca-link temperature updates. The charts are being generated using Google Charts.
If you can't imagine how all this looks like, take a look at the following pic:
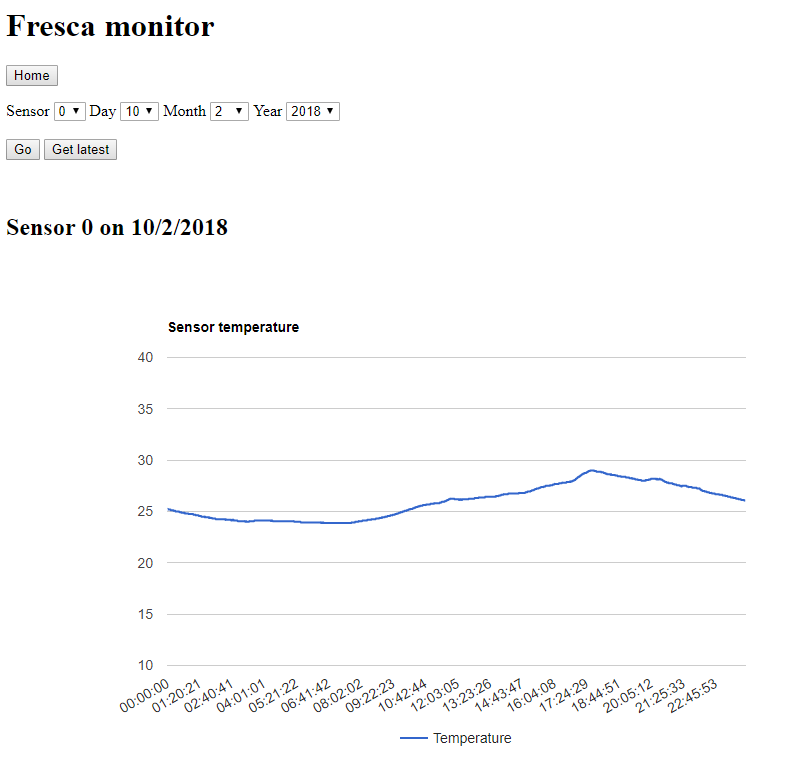
... it's the barebones, but the functionality is there. You just need to point at the directory where the log files reside and the webapp will take care of everything (uncompressing, parsing and formatting). Then select the desired day of the year that you wish to view, the desired sensor, and it will be neatly displayed in an interactive nice chart.
The log files are created by connecting the arduino and the Raspberry Pi using fresca-link (it will generate one log file per day), then fresca-link will get the data from the sensors and output a nice CSV format log file, and, when it is done for the day, it will compress the file to .tar.gz format to save space (log files can get to 10s of MB depending on the sampling interval).
I will be cleaning up all the code, committing it nicely with documentation to github in the next weeks, and then next move on to more features! :)
Stay tuned!
Leo
Discussions
Become a Hackaday.io Member
Create an account to leave a comment. Already have an account? Log In.