The last few weeks have been dedicated to integrating sensors and toughening up a "production" release of the firmware.
One of my favorite sensors is the First Sensor X100-7 silicon photodiode gamma ray sensor. This is perhaps particularly so since I had an amazing experience in my senior summer after high school (1968) working in the gamma ray astronomy lab of Dr. Glenn Fry at the Naval Research Laboratory. His lab was flying payloads of photographic emulsion to the top of the atmosphere in high altitude balloons to construct a then state-of-the-art gamma ray telescope via the Compton effect (a gamma ray passing an atomic nucleus will sometimes decay into a positron and election - in a V shaped pattern. The angle between the particles correlates to the energy of the gamma and backtracking the paths of the particles in the emulsion yield the source direction of the gamma ray.). The real challenge was the changing orientation of the balloon payload. BIG challenge in 1968, but the S4 platform has GPS and 9DOF sensors to determine the attitude at the time of capture - and perhaps some inference as to the cosmic source?
The first version of the S4 software for the X100-7 captured gamma ray counts. While interesting, it was tantalizing insufficient. Was there information about the energy of the gamma ray in the pulse coming from the detector. A bit of oscilloscope research showed the pulse height did not seem to change much but there was an intriguing difference in pulse width. If there was energy information in the pulse width - then I could easily construct not only a gamma detector, but more importantly a gamma spectrograph. Oh my.
I found a way to record pulse width on the Arduino by capturing at interrupt time the timing the rise and fall of the detector pulse (while still collecting polled data samples from the other sensors BTW!).
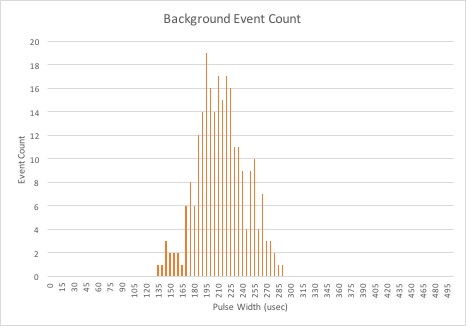
I then let the S4 sit about collecting gamma ray information about the background radiation in my study.
A bit of Excel later. Voila!


But was there reliable energy information in the pulse width?
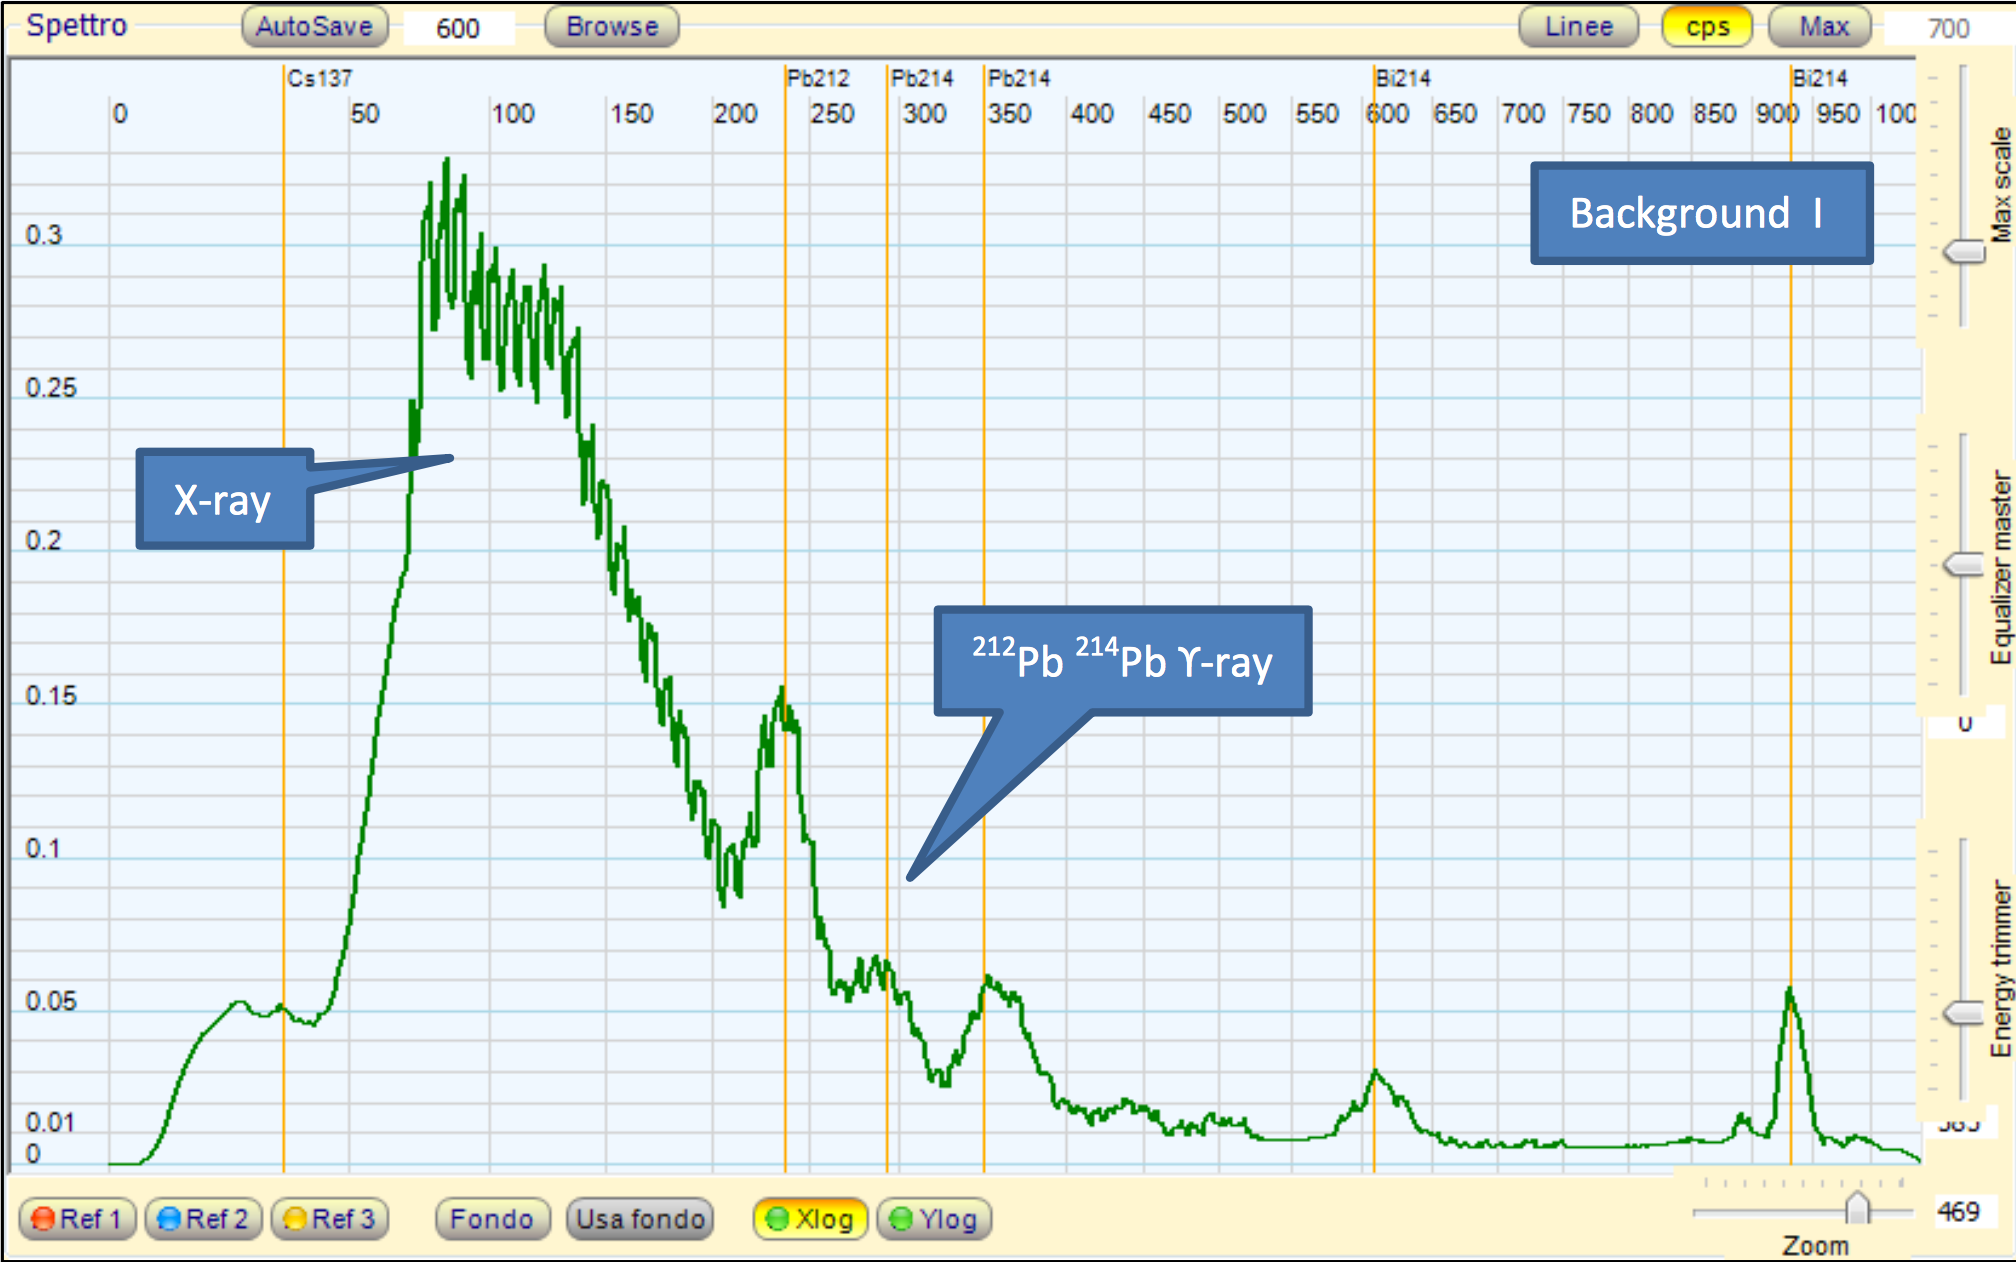
I mapped the key features of the published spectrogram to my sample to attempt a correlation. Was there a relationship between pulse width and photon energy?
Could be. But there is definitely energy information in the pulse width. More data will improve the calibration. But an exponential seems about right.
So ... with an inexpensive photodiode sensor, a bit of Arduino code - the S4 now has likely a gamma ray spectrograph.
Another DIY project capturing science at what only governments could do 50 years ago.
 Ken Biba
Discussions
Become a Hackaday.io Member
Create an account to leave a comment. Already have an account? Log In.