We've completed the monitoring of five nests so far. One sensor failed in a nest (due to a bad connection). Eight nests are being monitored currently, and another four are awaiting a spare Communications Unit to become available. So, we should have data from about 17 nests to evaluate. Using our theory about hatching, which we are now calling the "popcorn" theory, we were able to predict several boils. The popcorn theory is that the turtle eggs are like popping corn in boiling oil. When the kernels heat up, they start to jiggle a little, and then they all start to pop at once. When you hear the popping quiet down, you know it is time to pour everything out of the pot. So, we theorize that the turtles are all programmed to listen for things to quiet down after hatching, and that way they know that it is time to leave the nest.
Popping (hatching) shows up in our data a few days (3-5) before the turtles pour (boil) out of the nest. The sensors are sending 240 records in each report, and each report is phoned in every 4 hours. So each record is a profile of what happened each minute of the day. We can see how many readings there were in about 25 ranges of acceleration from .001 G to about 4 G. We've arranged these ranges logarithmically because we did not know what values we'd be getting. We thought there would be a huge dynamic range between background noise and the motion of hatching turtles hitting the sensors. It turns out the dynamic range is not that large--about 4:1. In future versions, we can design our data collection to get more resolution in the ranges that we are recording.
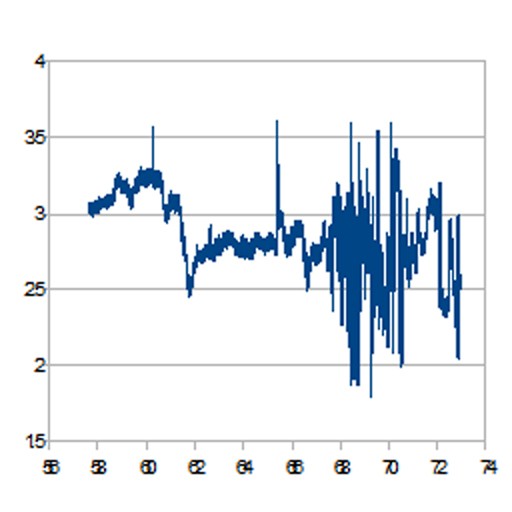
To graph the data, we integrate all the readings during each minute's report to get a single numerical value. This value corresponds roughly to the energy from the motions recorded. We can graph the data versus time to see what is happening. It looks like this:

Looking at the graph, you can see that things are really popping starting around day 68. Then everything gets really quiet for a few hours on day 72. That was just before the boil. So, when we see the graph look like an earthquake on a seismograph, we figure things are going to boil in about 4 days. This is a pretty good method of making a prediction.
Except for one thing. Do you see the spike around day 60 and again on day 65? We think these spikes are from ghost crabs. Ghost crabs are a main predator of sea turtle eggs. They make quite a commotion in the nest when they are feeding on sea turtle eggs. Some nests don't have them, so there are no spikes until the eggs are hatching. But some nests have lots of them. If the crabs find the nest early on, they return over and over. They probably bring their family and friends to feast on eggs.
So now we have to collect more data and learn how to distinguish between the hatching of sea turtles and an orgy of crabs feasting on sea turtles. One member of our team, Tom Zimmerman, is working on using machine learning techniques to do just that.
 Samuel Wantman
Discussions
Become a Hackaday.io Member
Create an account to leave a comment. Already have an account? Log In.