Michel Kuenemann
-
Facts, figures and reflexions about energy
08/18/2014 at 15:07 • 0 commentsA few facts and figures:
The Sun-Earth distance is very close to 150 millions of kilometers.
It takes 500 seconds, about 8 minutes for the light to travel this distance.The power of the sun is 38400000000000000000000000000 watts. This equivalent to the power of 400 millions of billions of 1000 Megawatt nuclear power plants.
The earth receives half of a billionth of the sun's power.
My PV system can produce up to 4300 W. This is 0.000000000000000000001 % of the sun's power. This tiny drop of rather easily harvested energy covers currently 80 % of my electricity needs of and will cover 100 % of my needs when an efficient storage mean becomes available.
As of August 20th, 2014 the production reaches 1500 KWh. With this energy I would have been able to boil 15 000 liters of water. This energy has covered 87 % of our electricity needs during the 5 last months.
My personal reflexions:
The sun can fulfill the humanity energy needs for the next 5 billions years. (Hubert Reeves)
Die Sonne shickt uns keine Rechnung (Dr. Franz Alt) - The Sun does not send us any invoice. (Dr Franz Alt)If the governments had invested more money in long term electricity storage solutions in the past, I bet we would be ready to get rid of fossil and nuclear energy now.
Solar electricity is produced fully statically (no moving parts) with neither dangerous emissions nor noise. It can be produced close to the consumers and so the transportation losses be reduced a lot.
In the 80's, human beings discovered distributed computing with IBM's PC (Personal Computer). I guess that the 21st century man is discovering "Personal Energy", the distributed Energy Production era.
Think global, act local, get Off-grid - as much as you can.
-
My PV Sytem making-of
08/15/2014 at 04:57 • 0 commentsAugust 31st, 2014: Battery pack maintenance
Every now and then the electrolyte level of the batteries need to be checked. Distilled water needs to be added to some elements. The batteries weigh approximately 500 Kg (1100 lb).
Cleaning the batteries with a wet cloth. Do not worry, there is
no electrical danger by 48 V DC !![]()
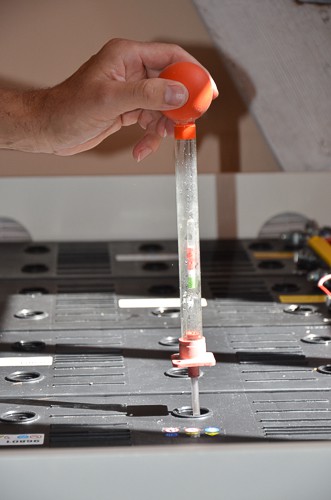
Checking the density of the electrolyte with an hydrometer.
![]()
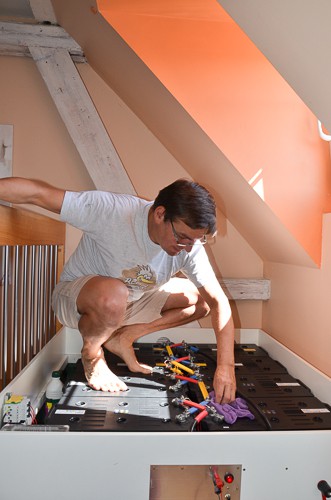
August 1st, 2014: Measurement panel troubleshooting
I had a poor contact in the irradiance measurement panel. I had to climb on the roof to mend it.
![]()
![]()
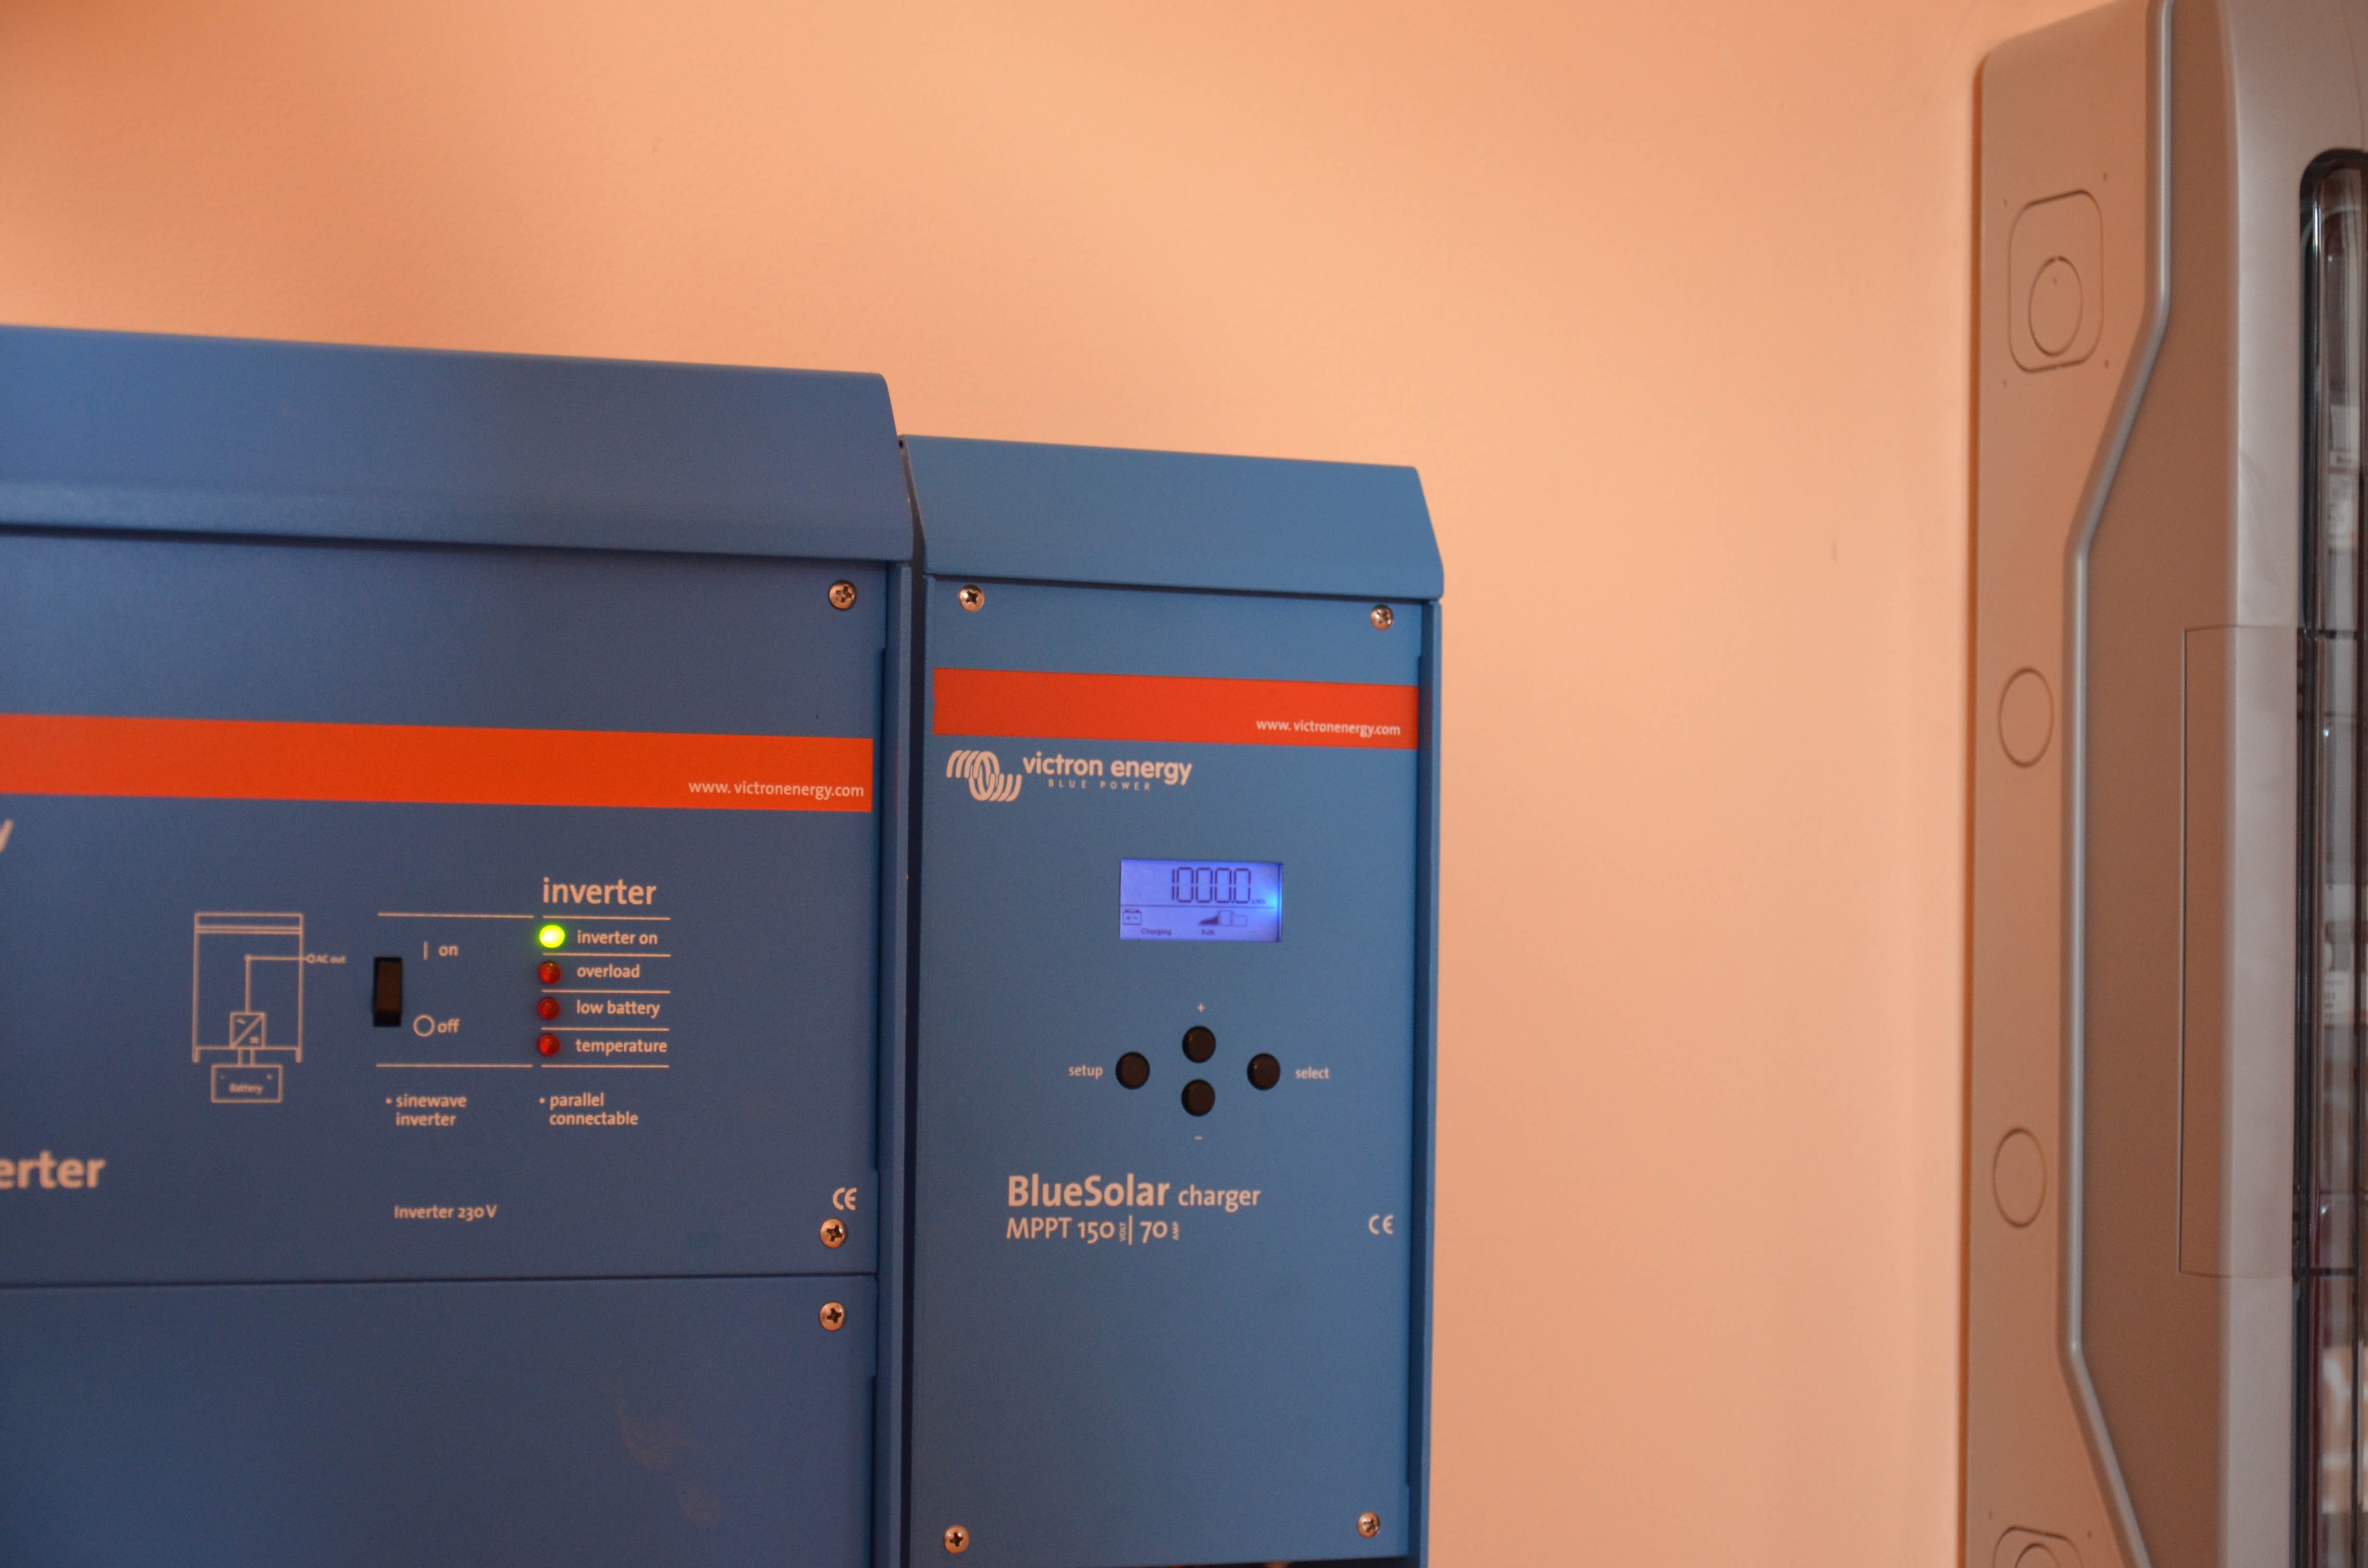
May 23rd, 2014: First produced Megawatt-Hour
The "1000 Kwh" figure can be seen on the blue display.
![]()
The weather and the roses were beautiful in May.
![]()
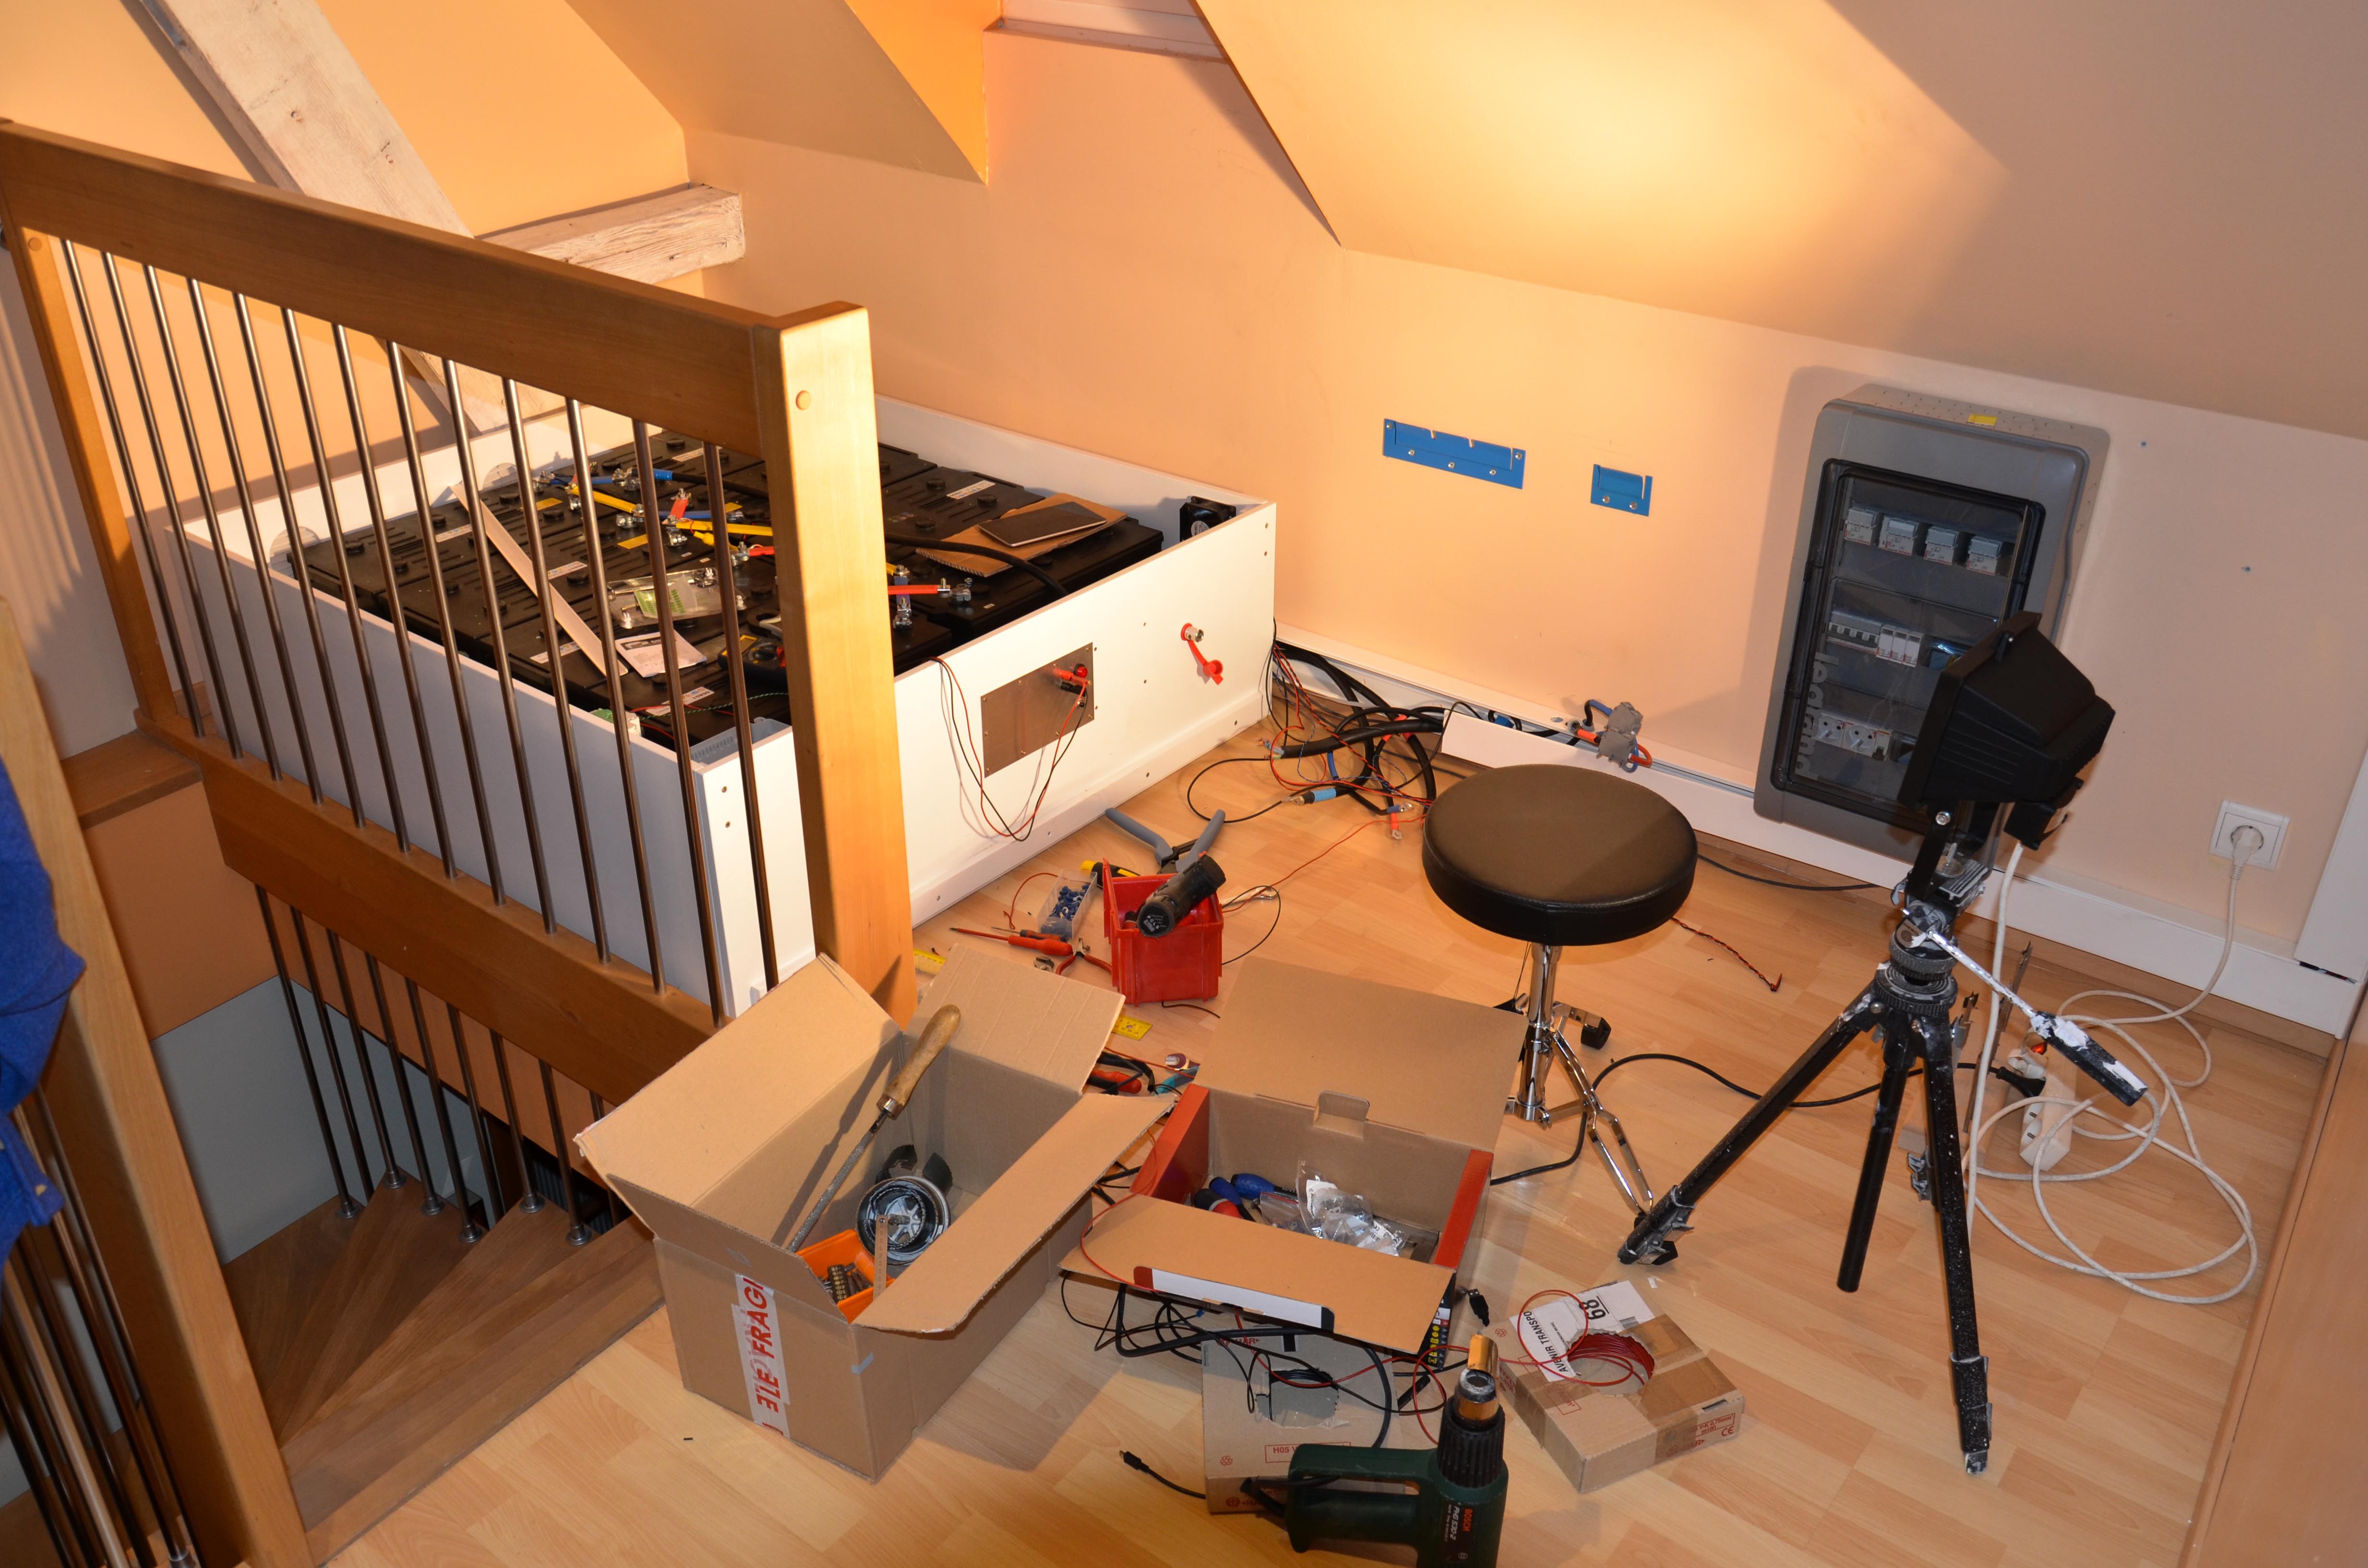
November 9th, 2013: Power Wiring
Its a tough work to wire the entire system. ![]()
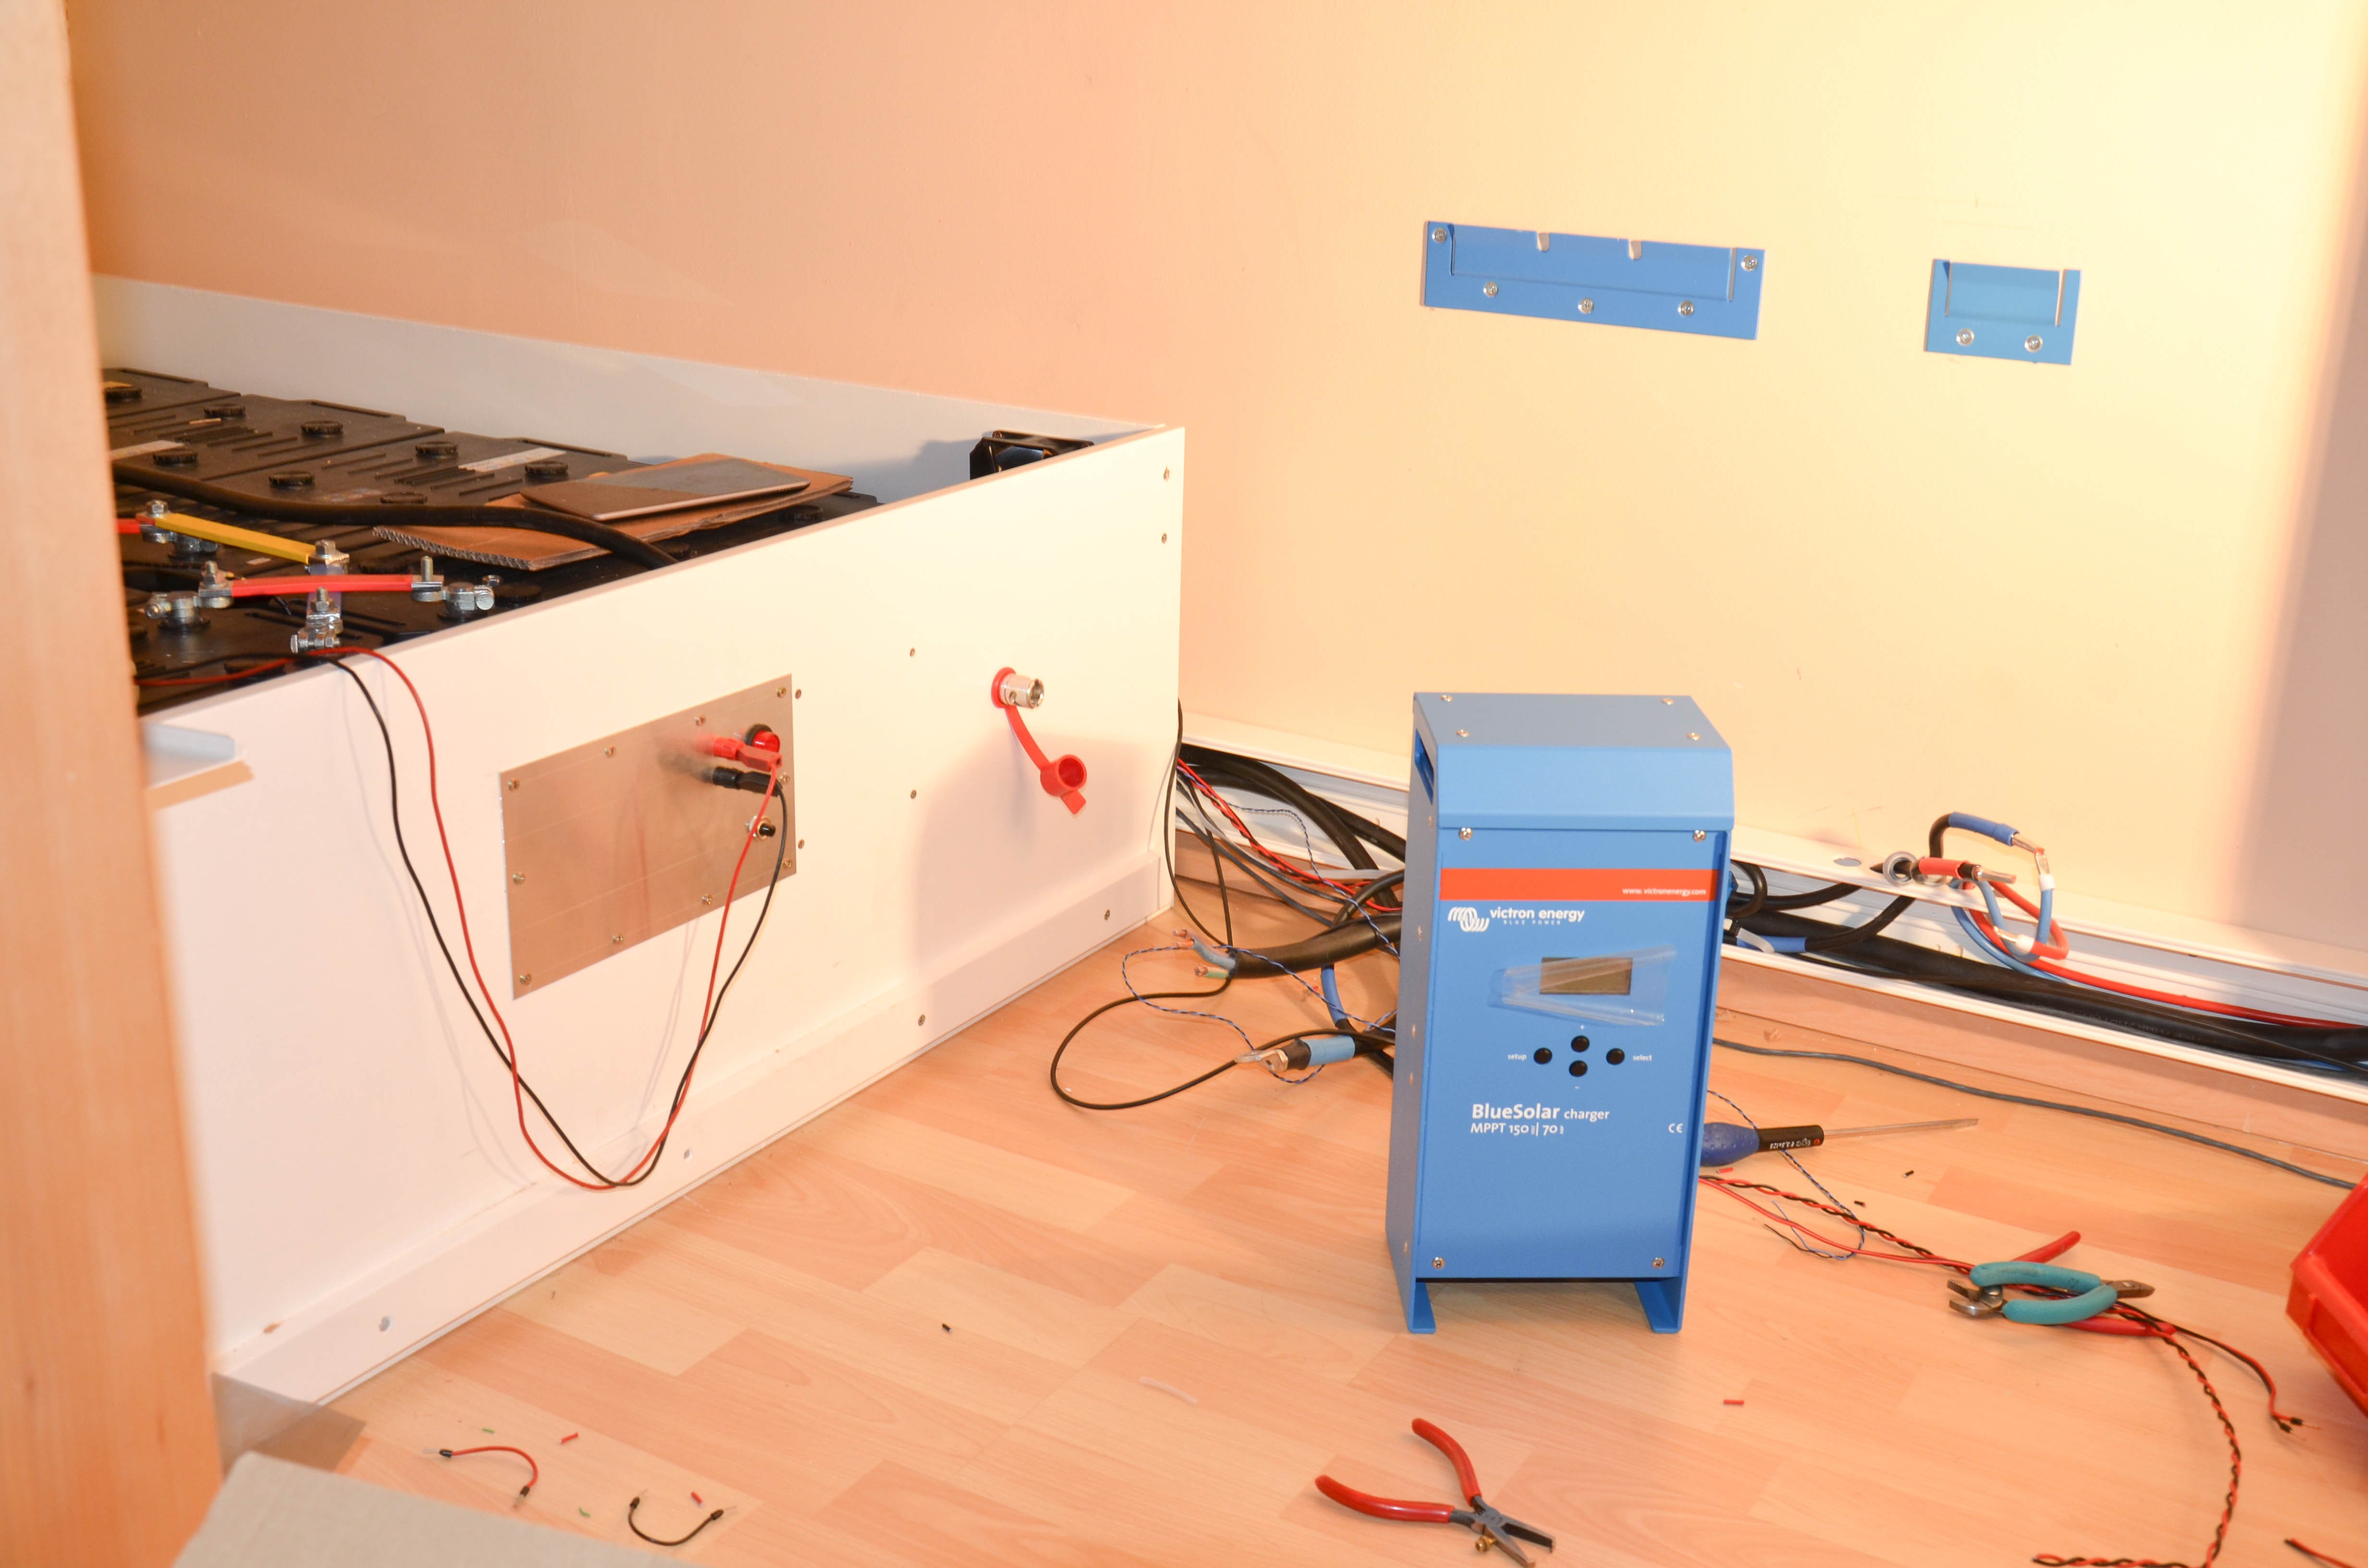
The charger is ready for mounting against the wall.
![]()
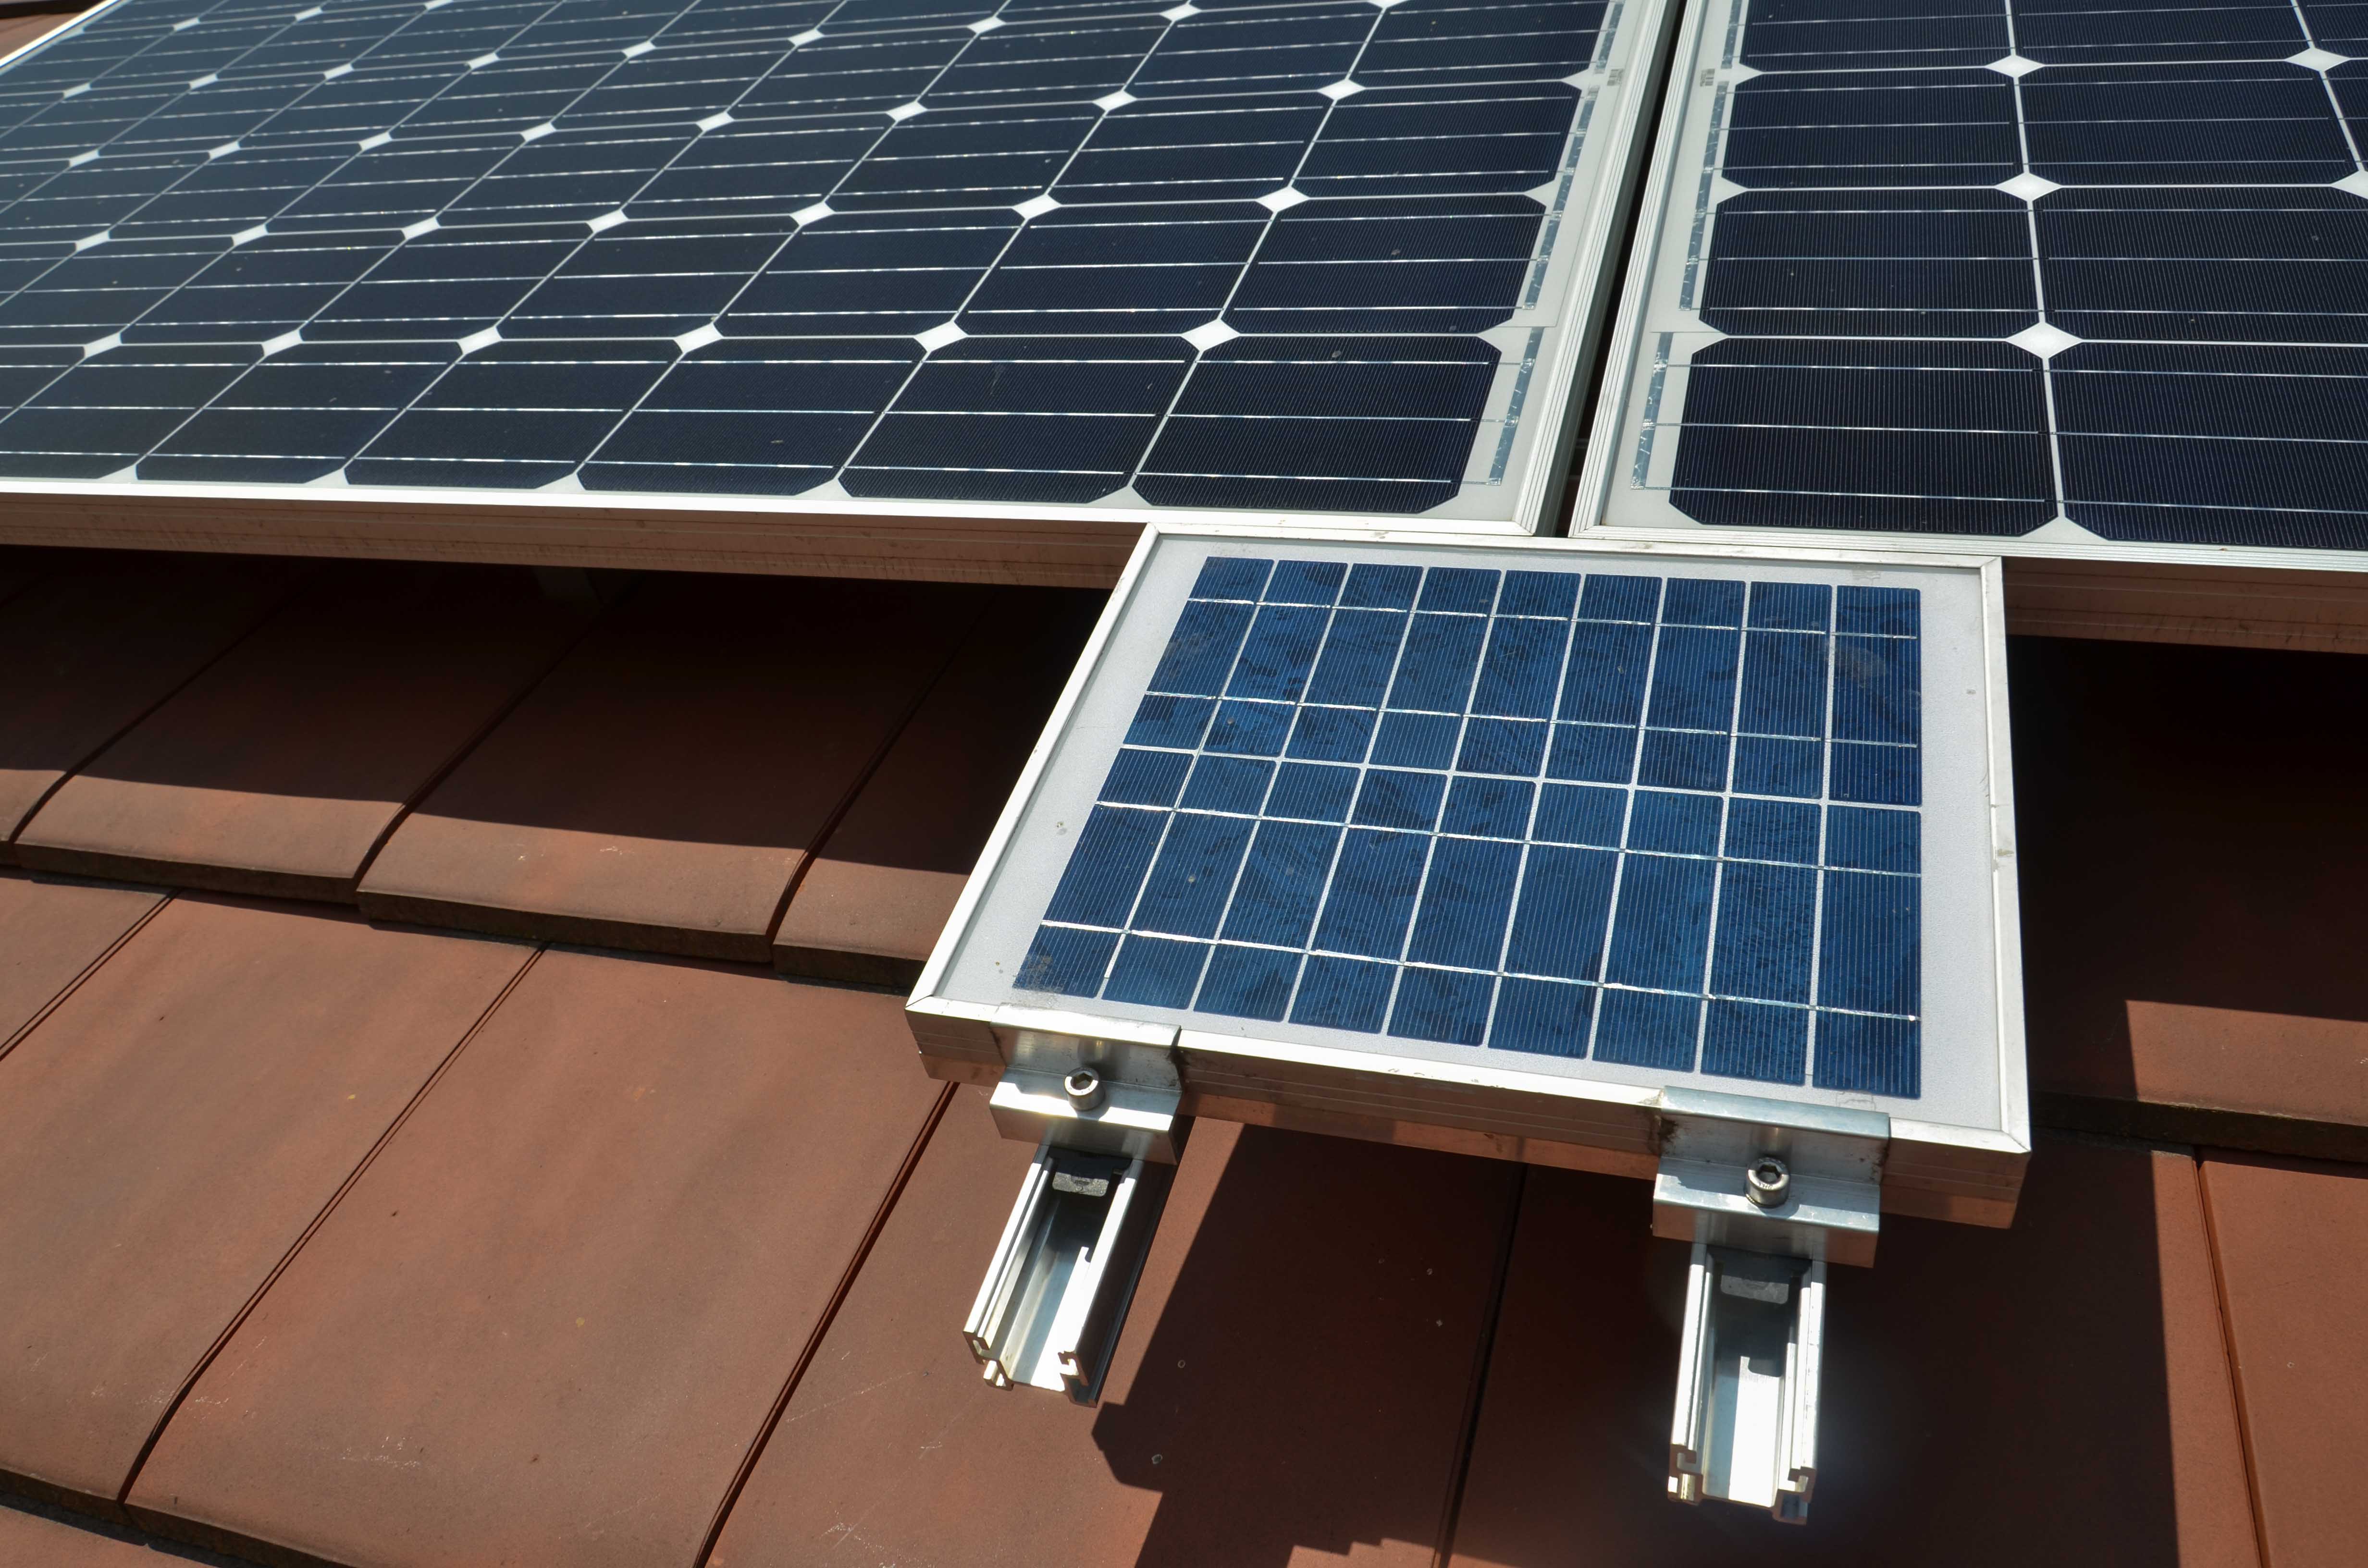
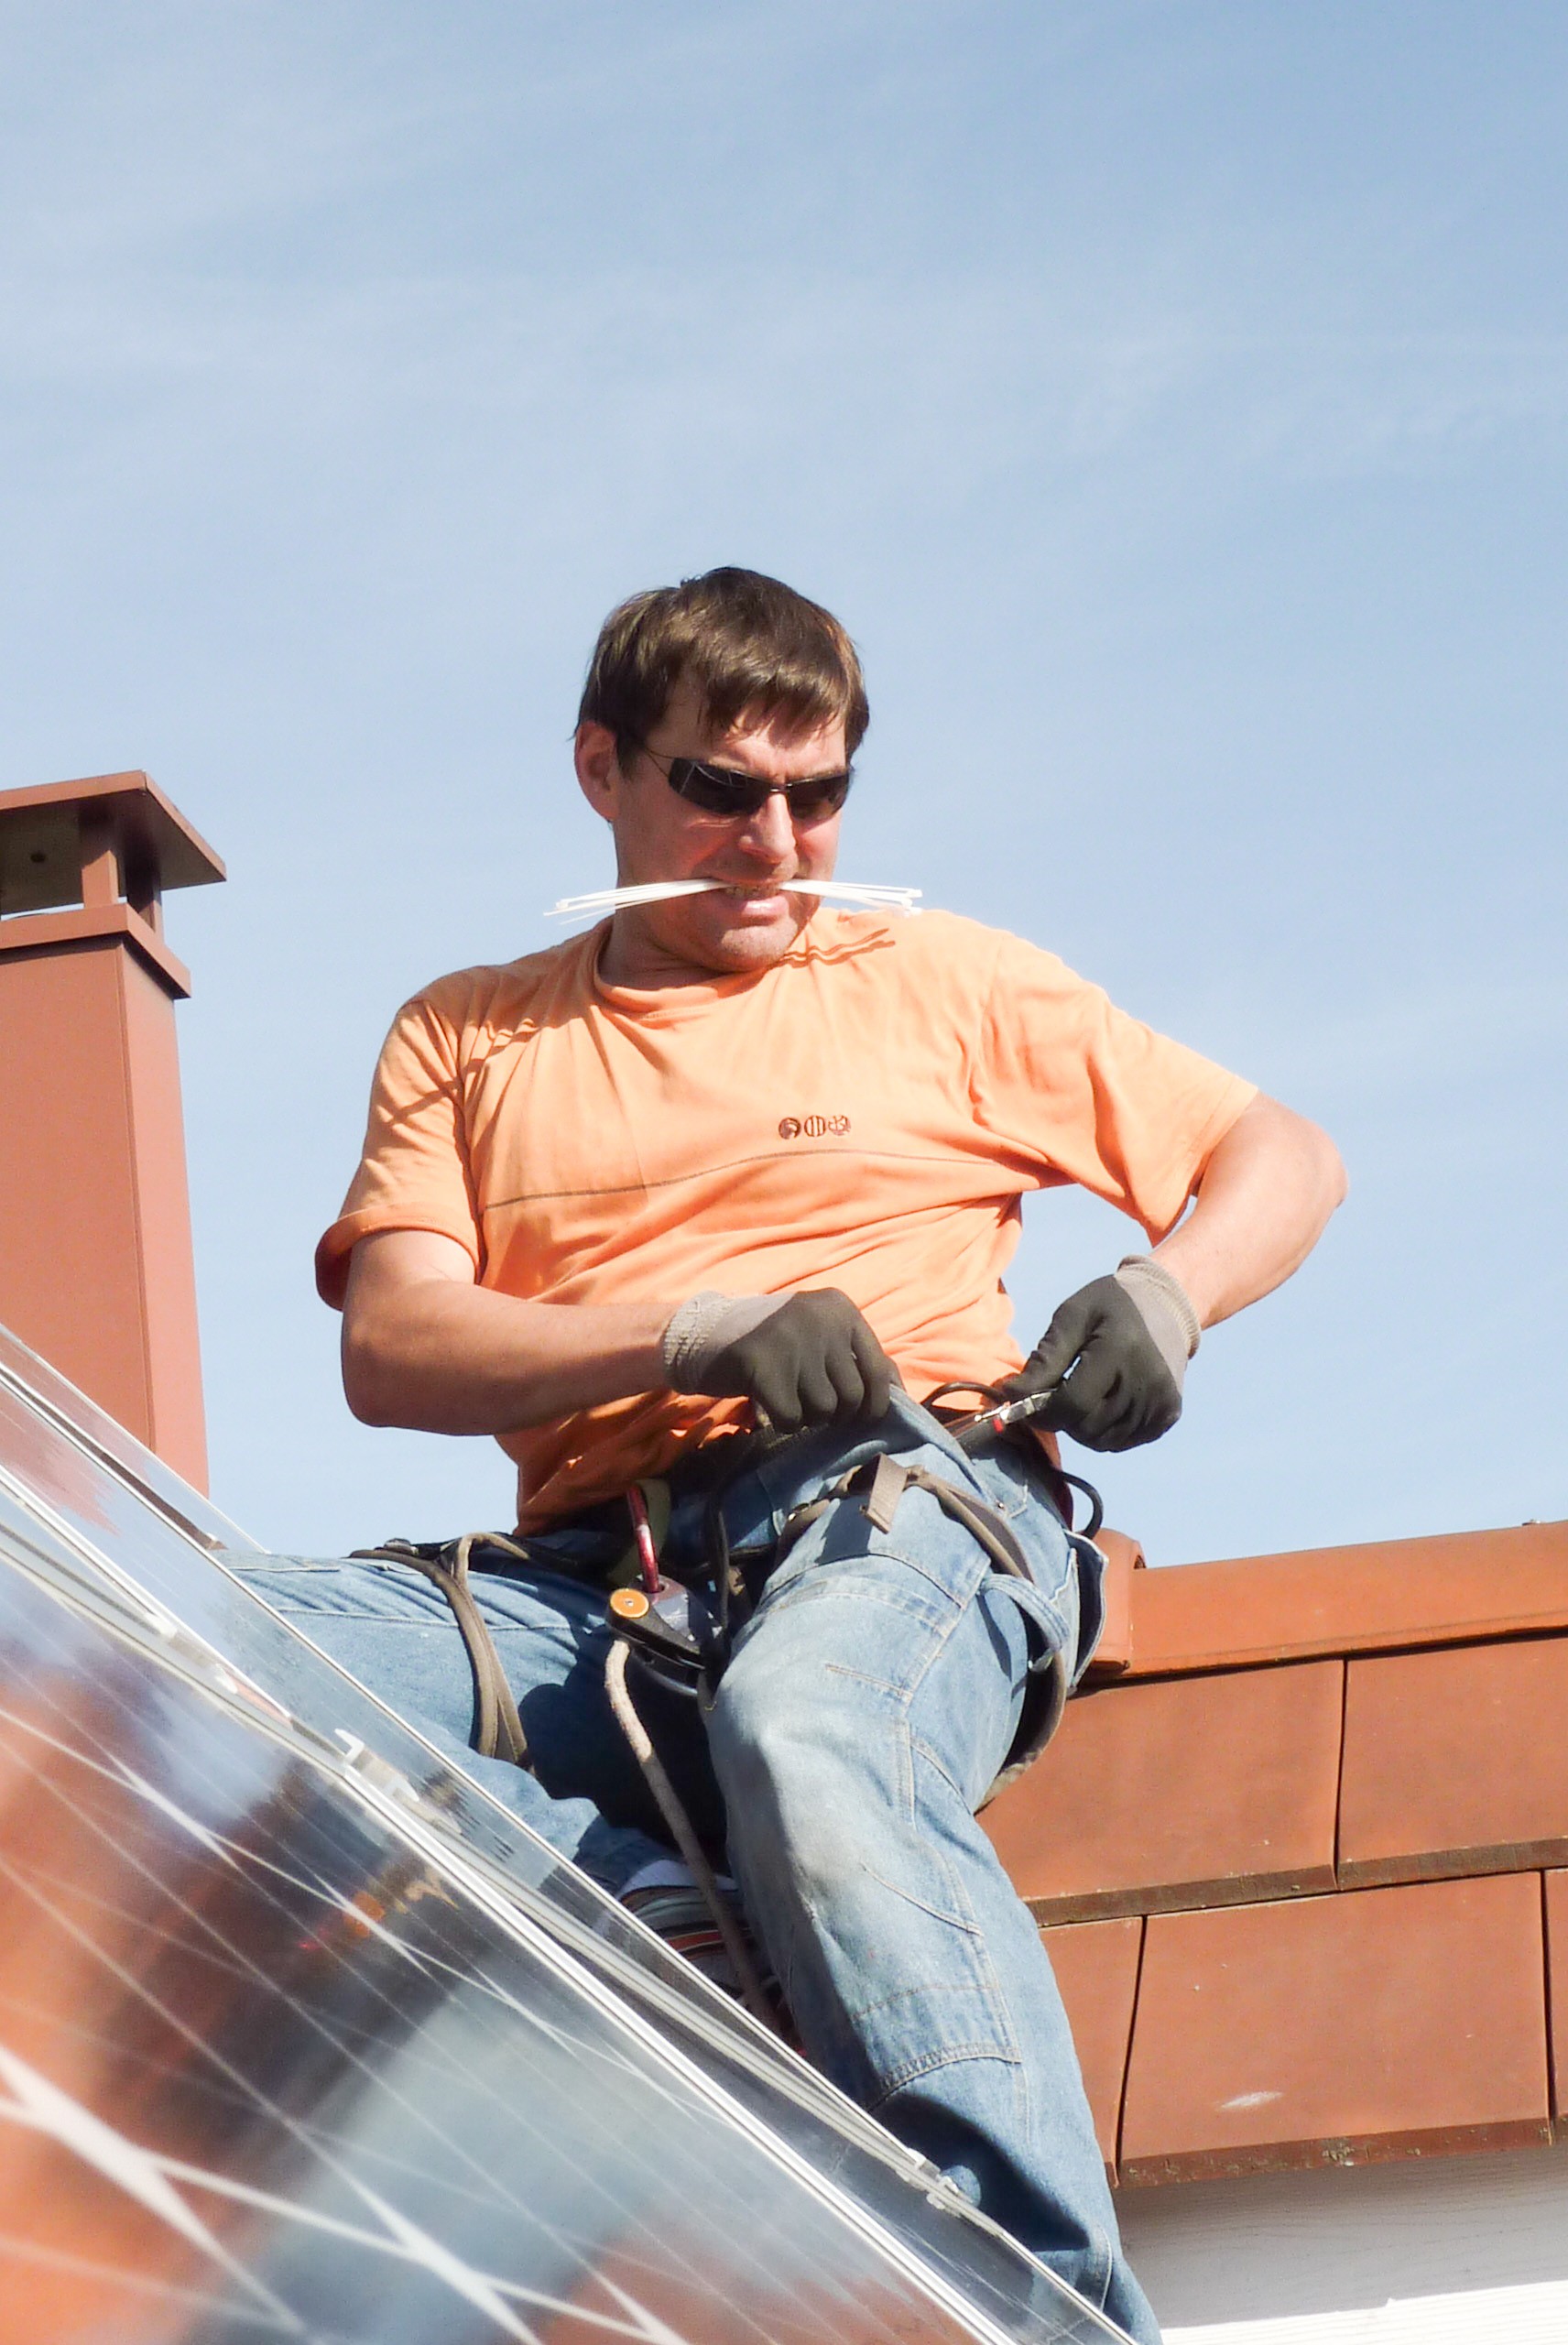
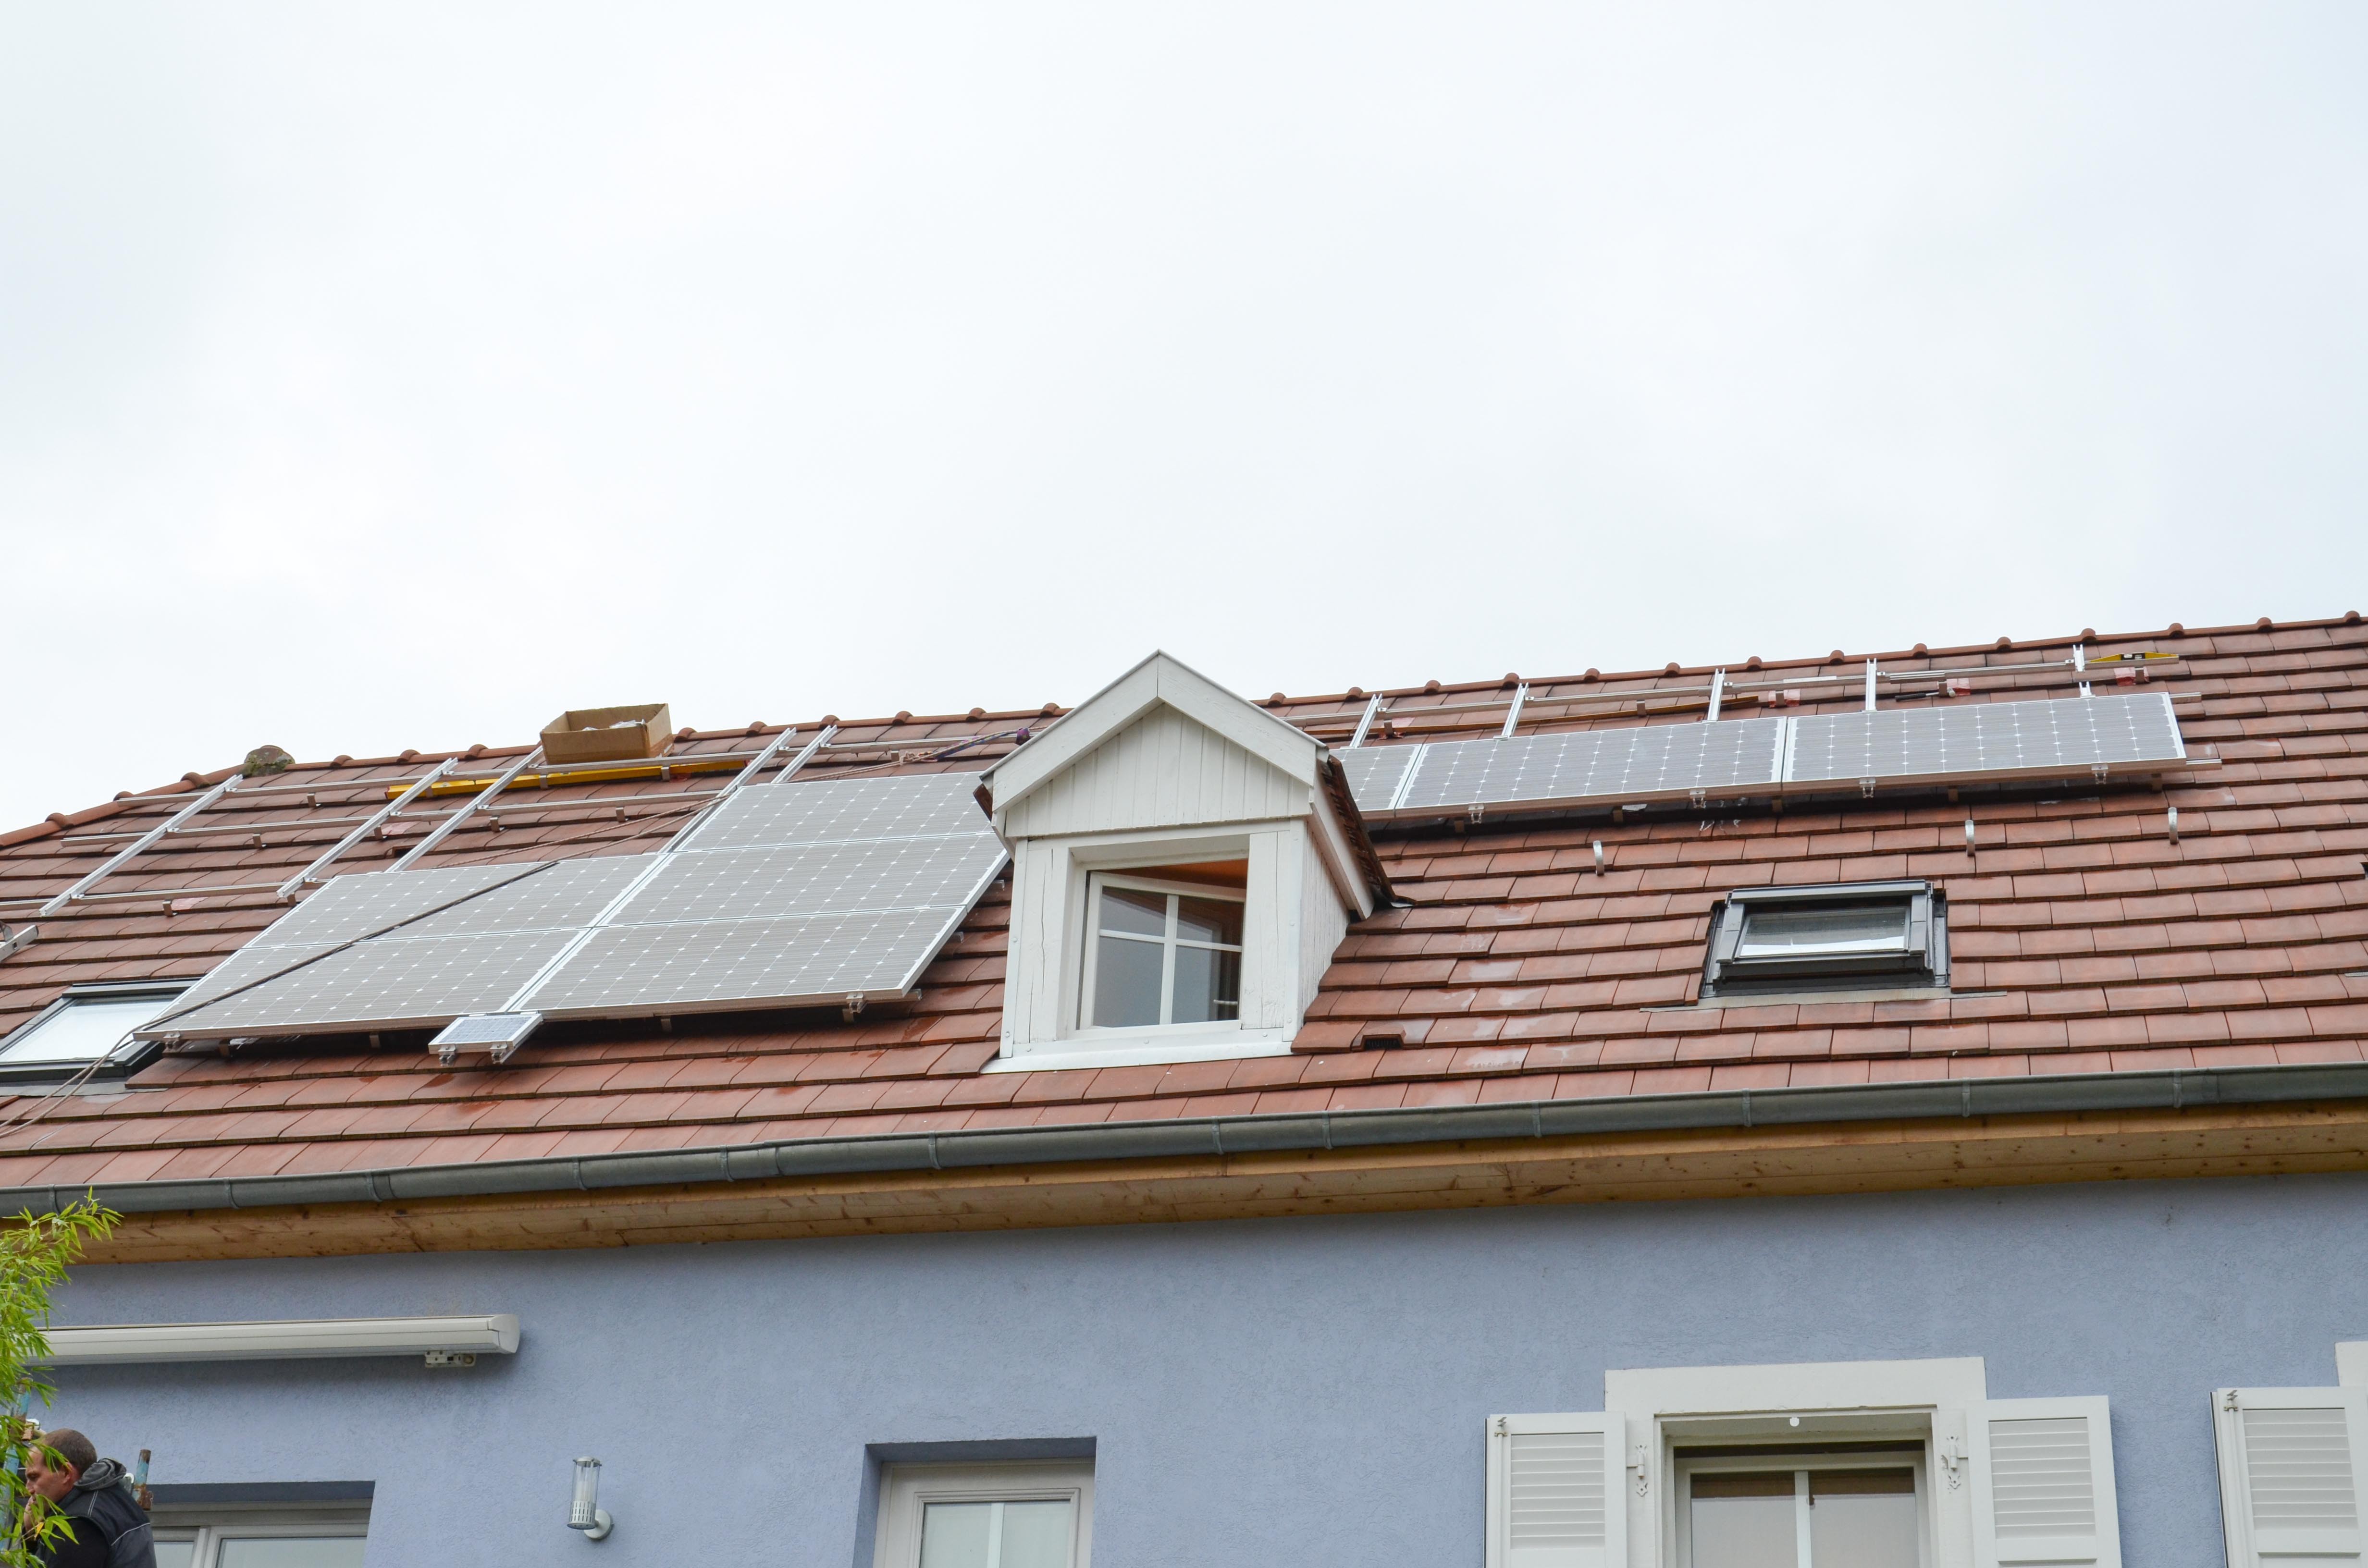
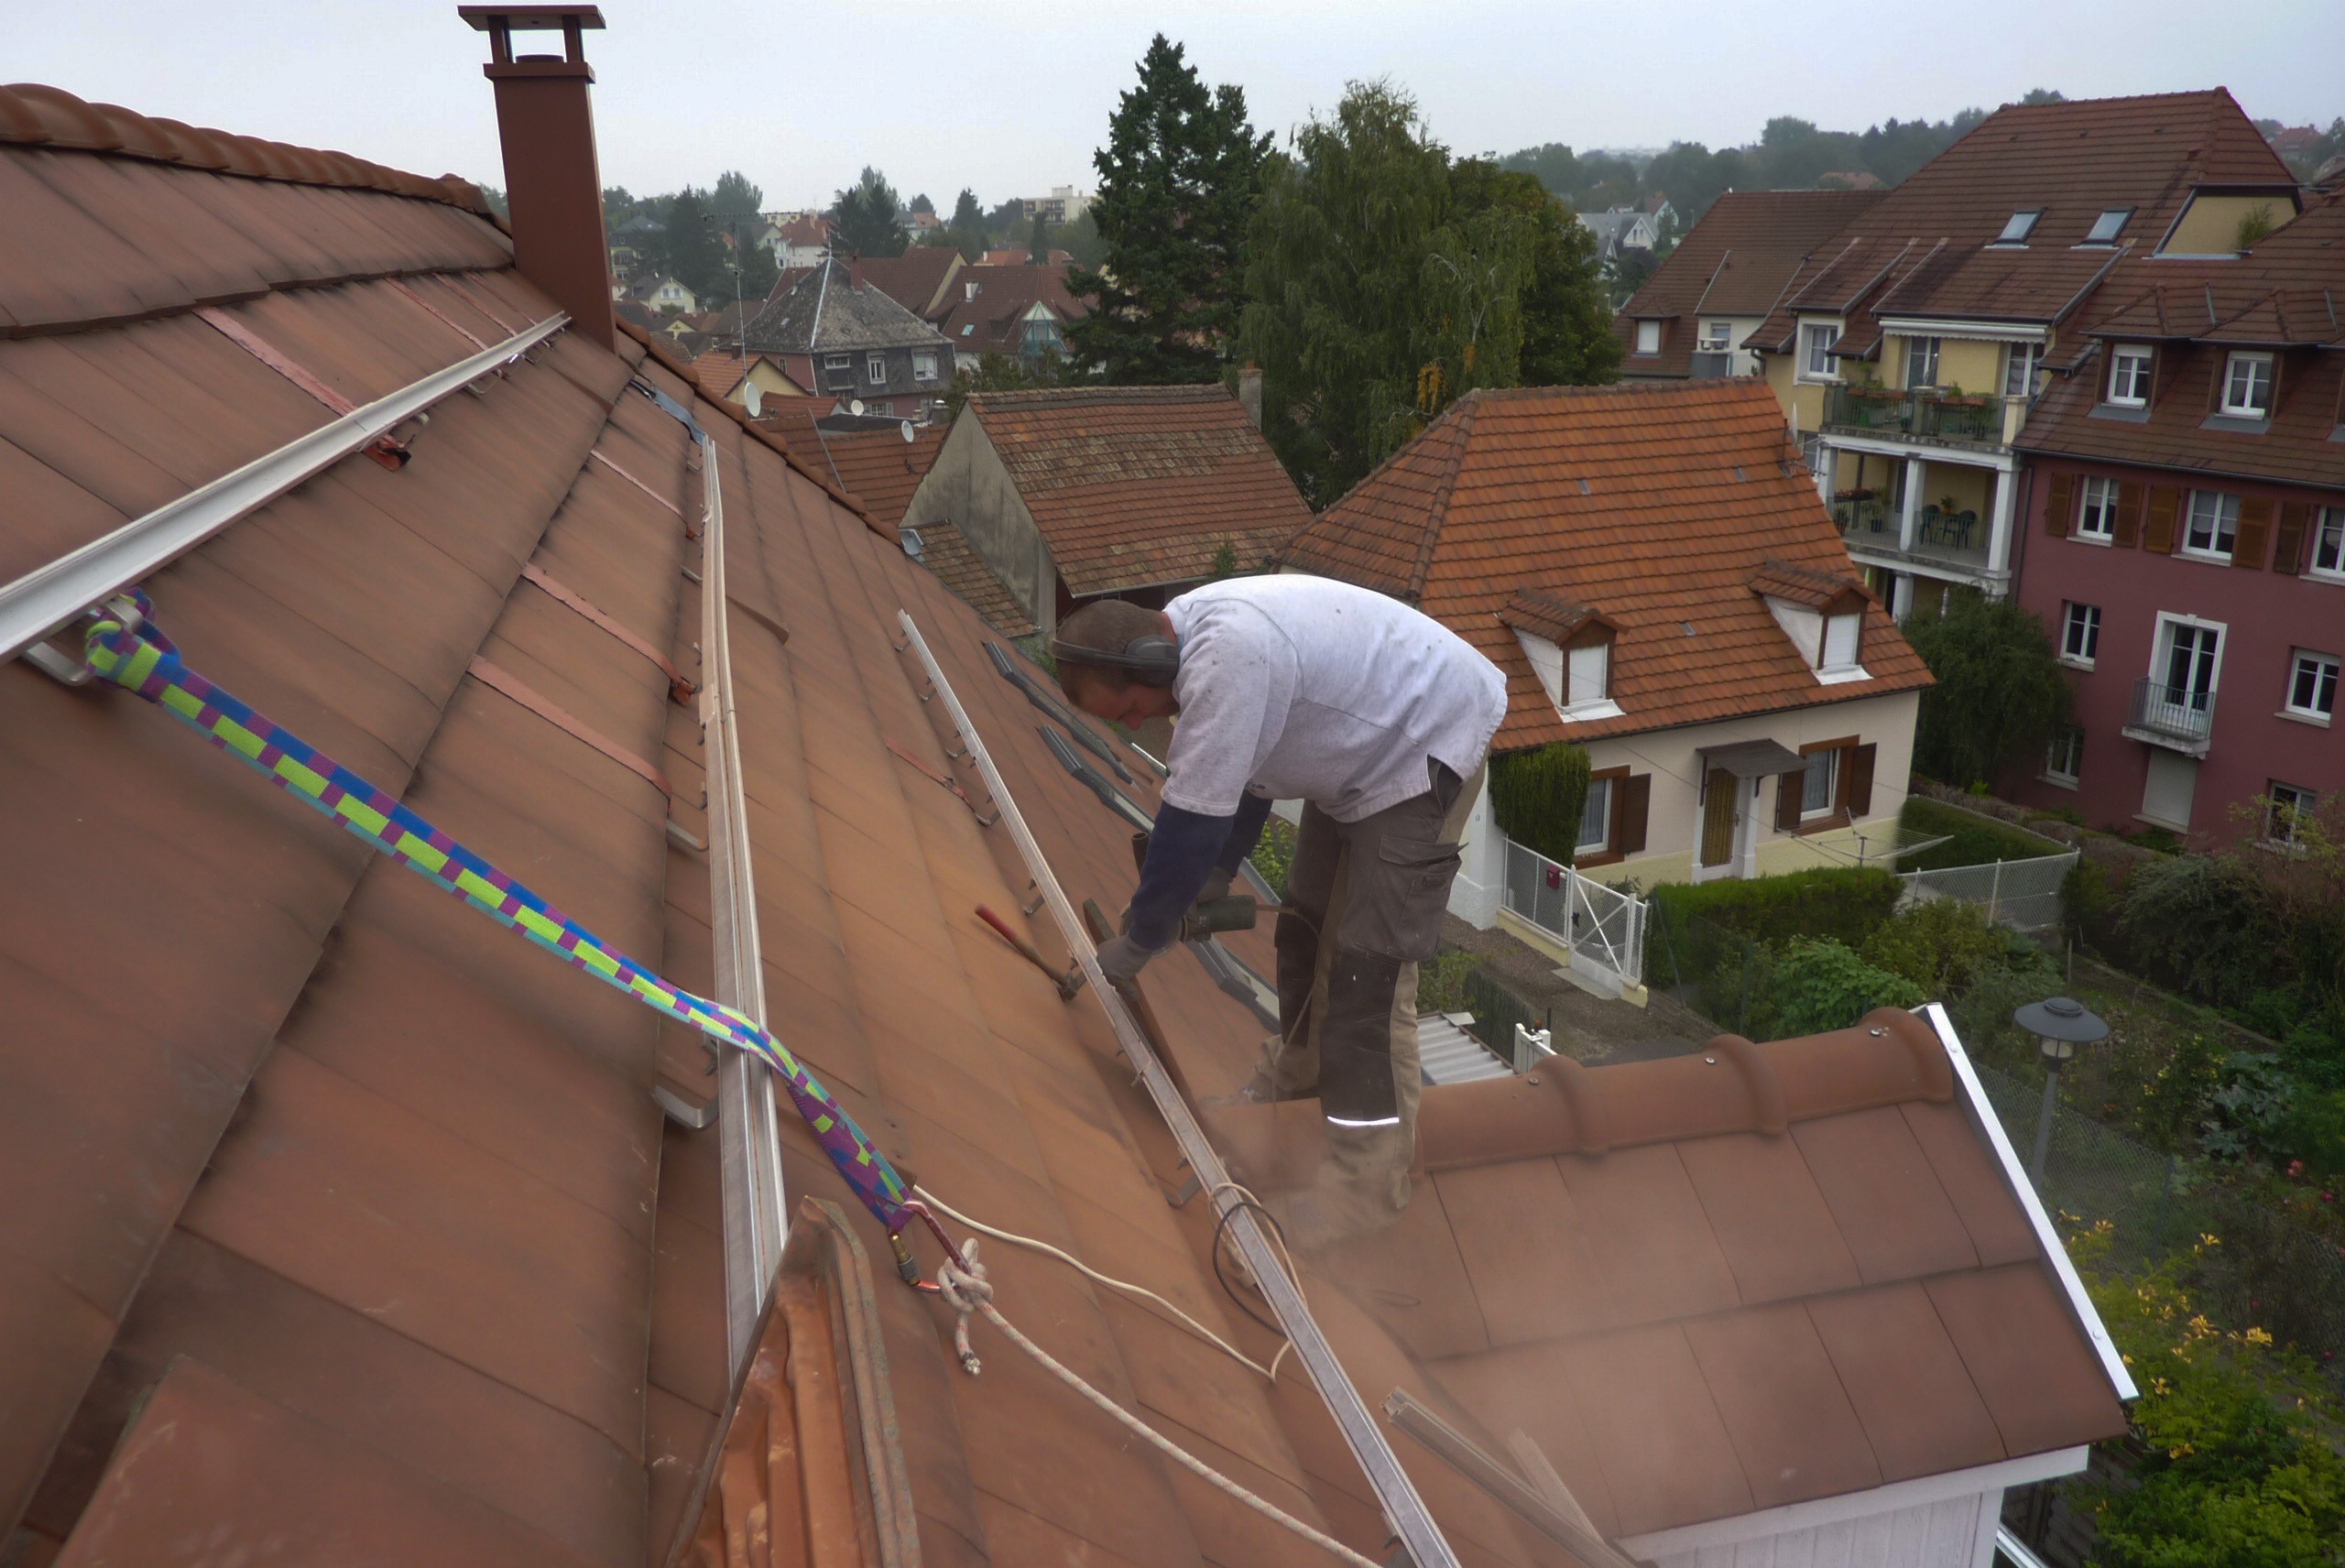
October 26th, 2013: Panel installation finished
Securing some wires. ![]()
One gets used to the height after a while. ![]()
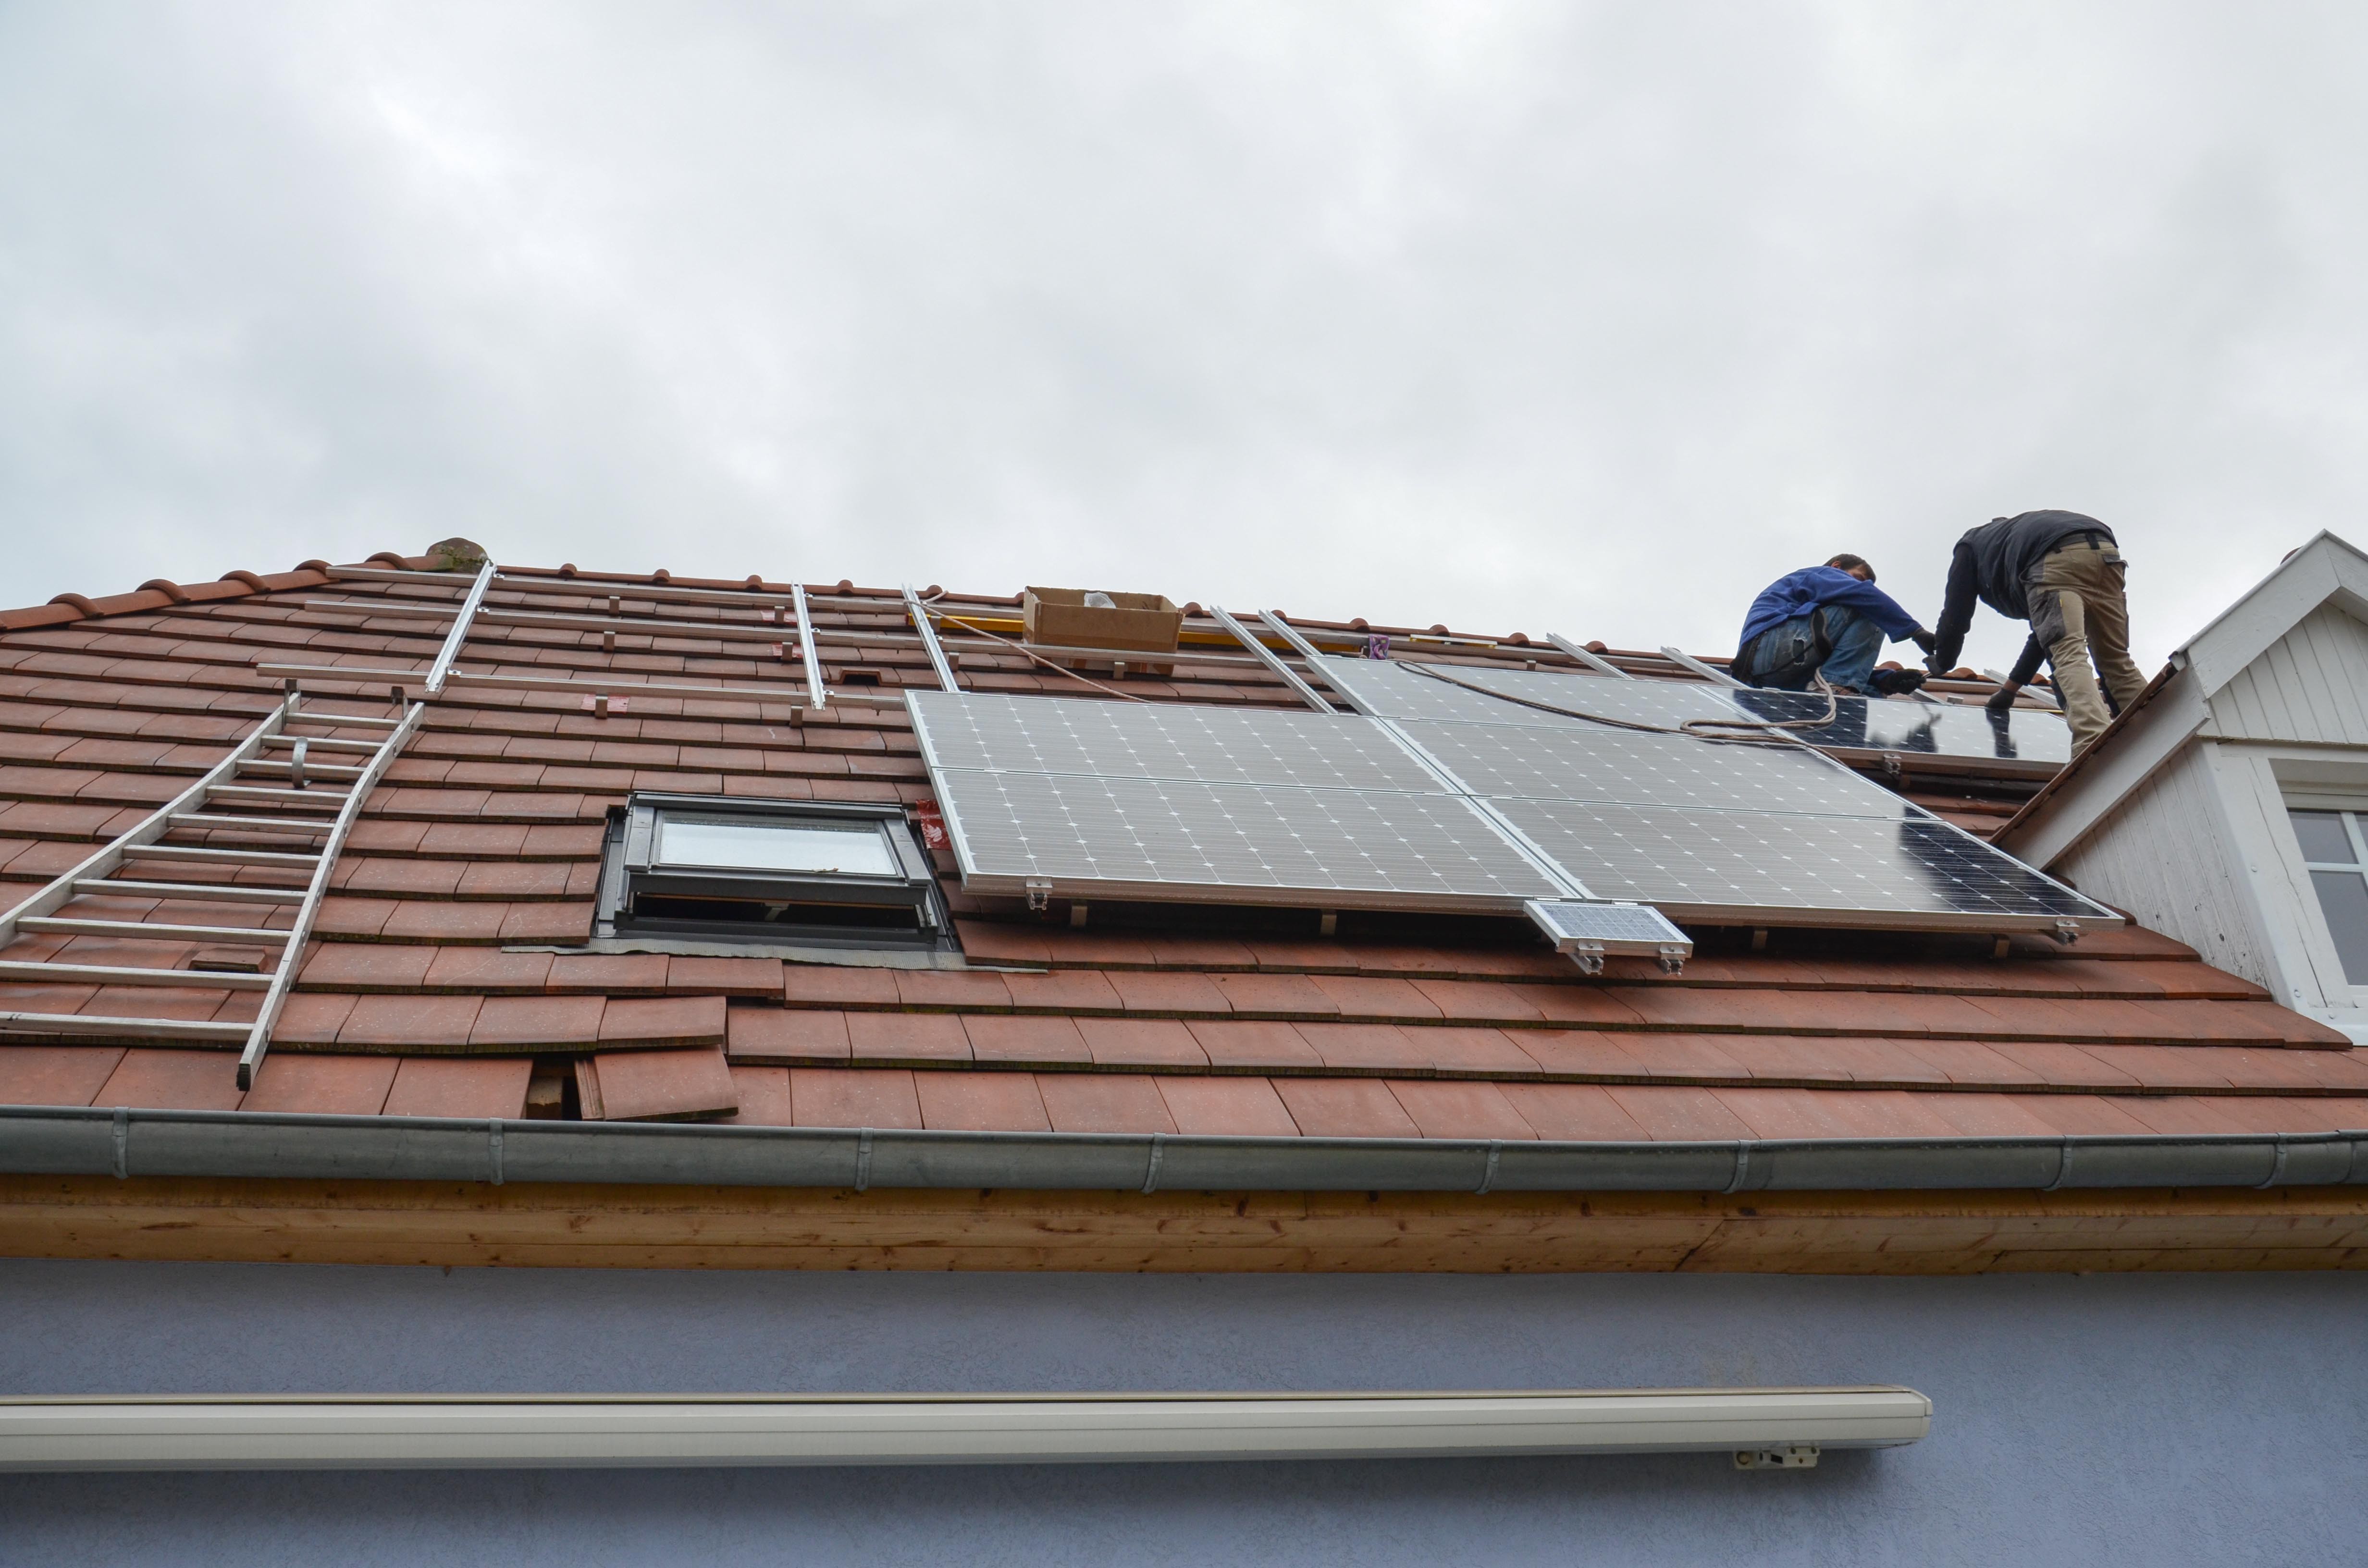
October 10th, 2013: Panel installation in progress
Panel installation has begun by a dull autumn day.
![]()
Panel installation in rapid progress.
![]()
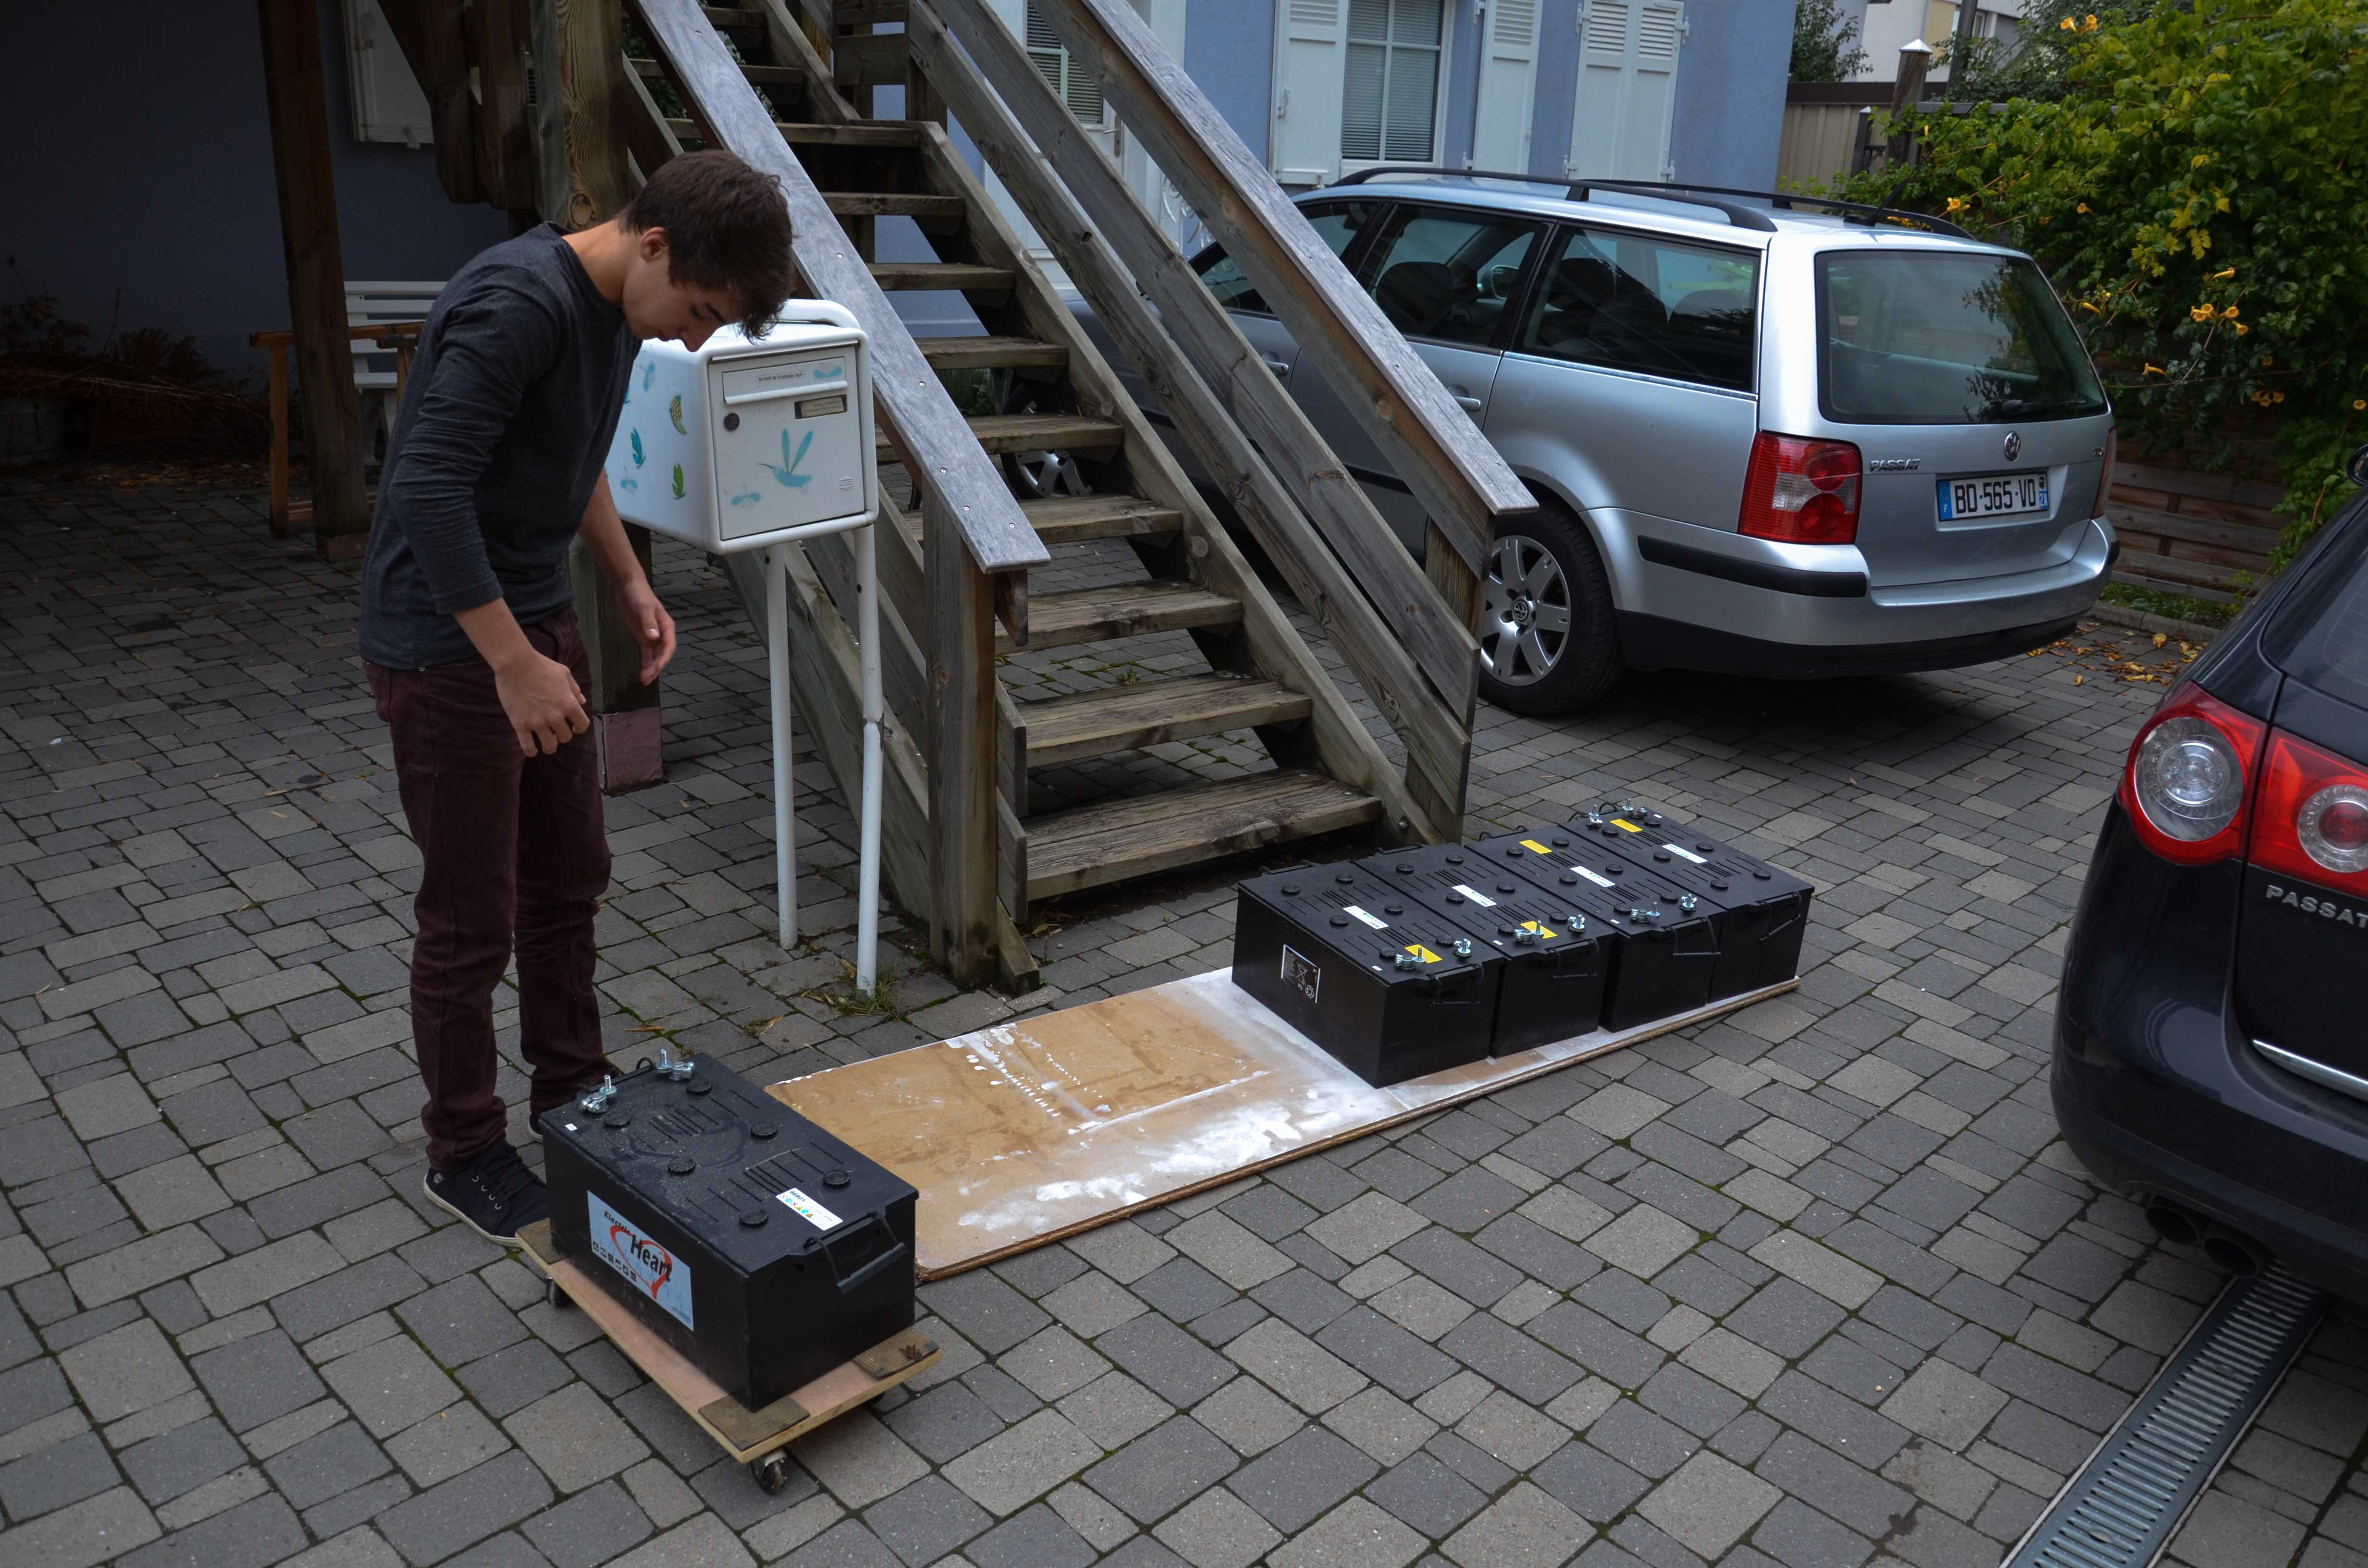
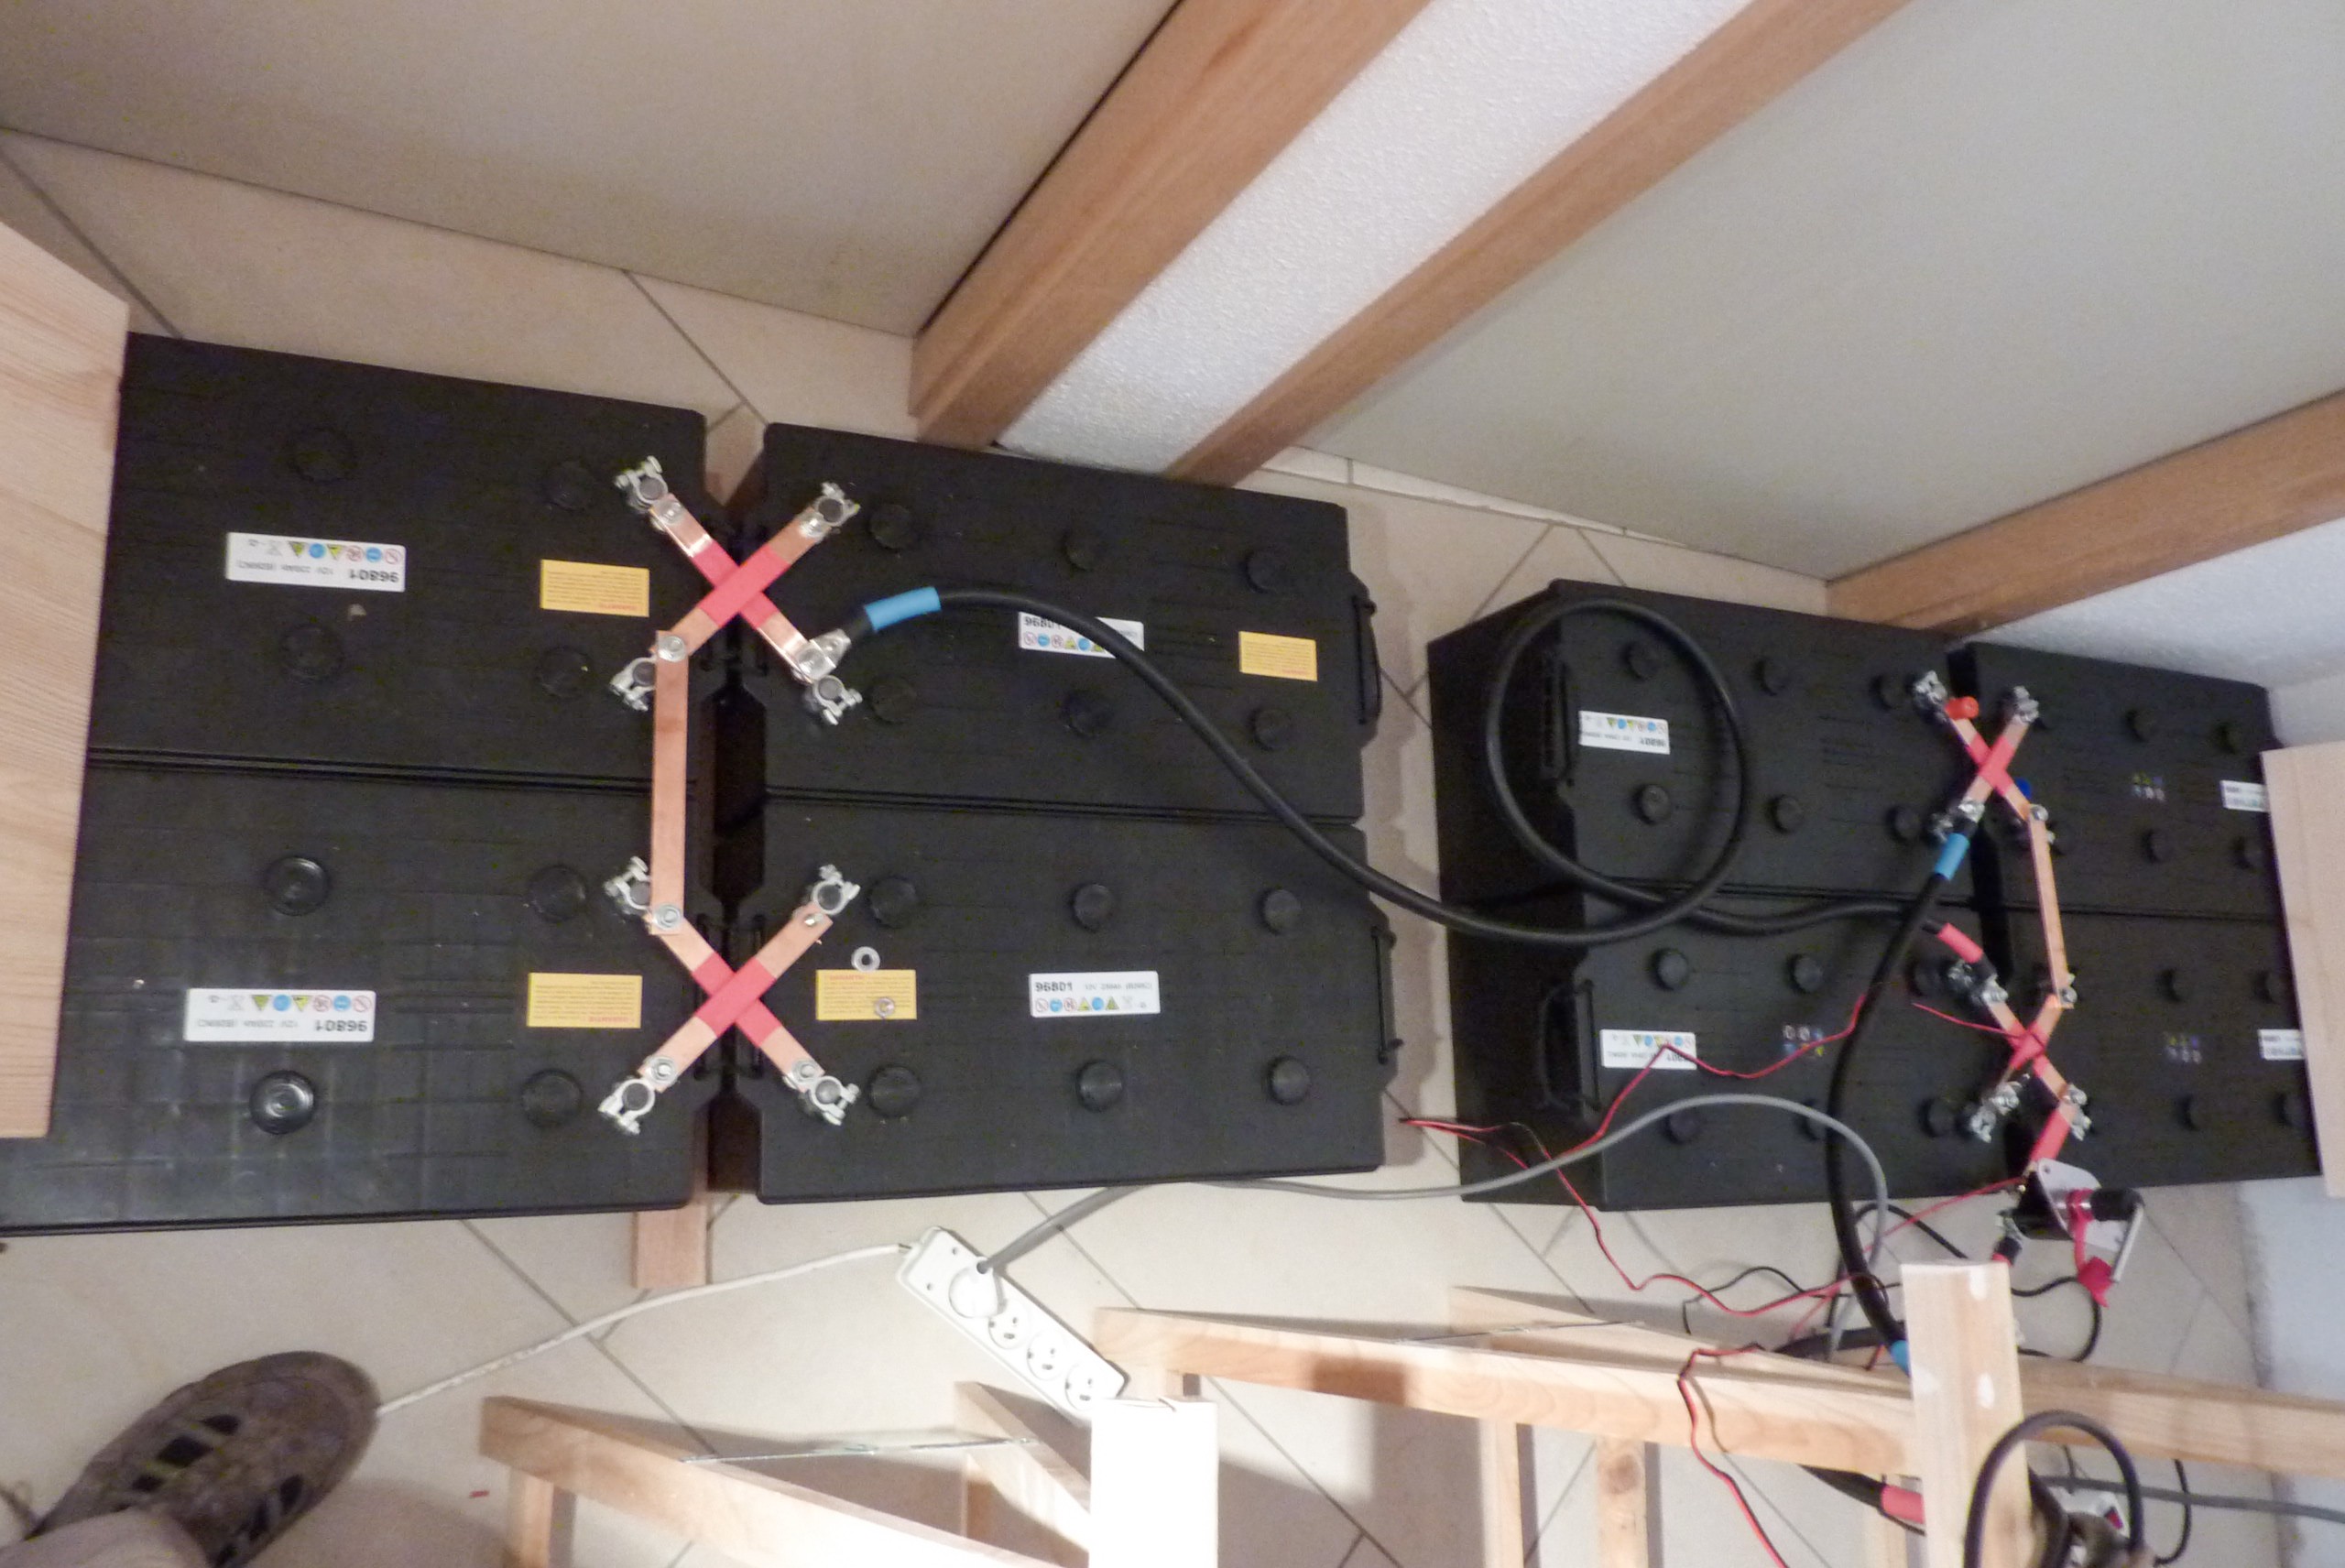
October 6th, 2013: Battery installation
My elder son gives a hand during battery installation.
Each battery weighs 65 Kg (approx. 140 lb).![]()
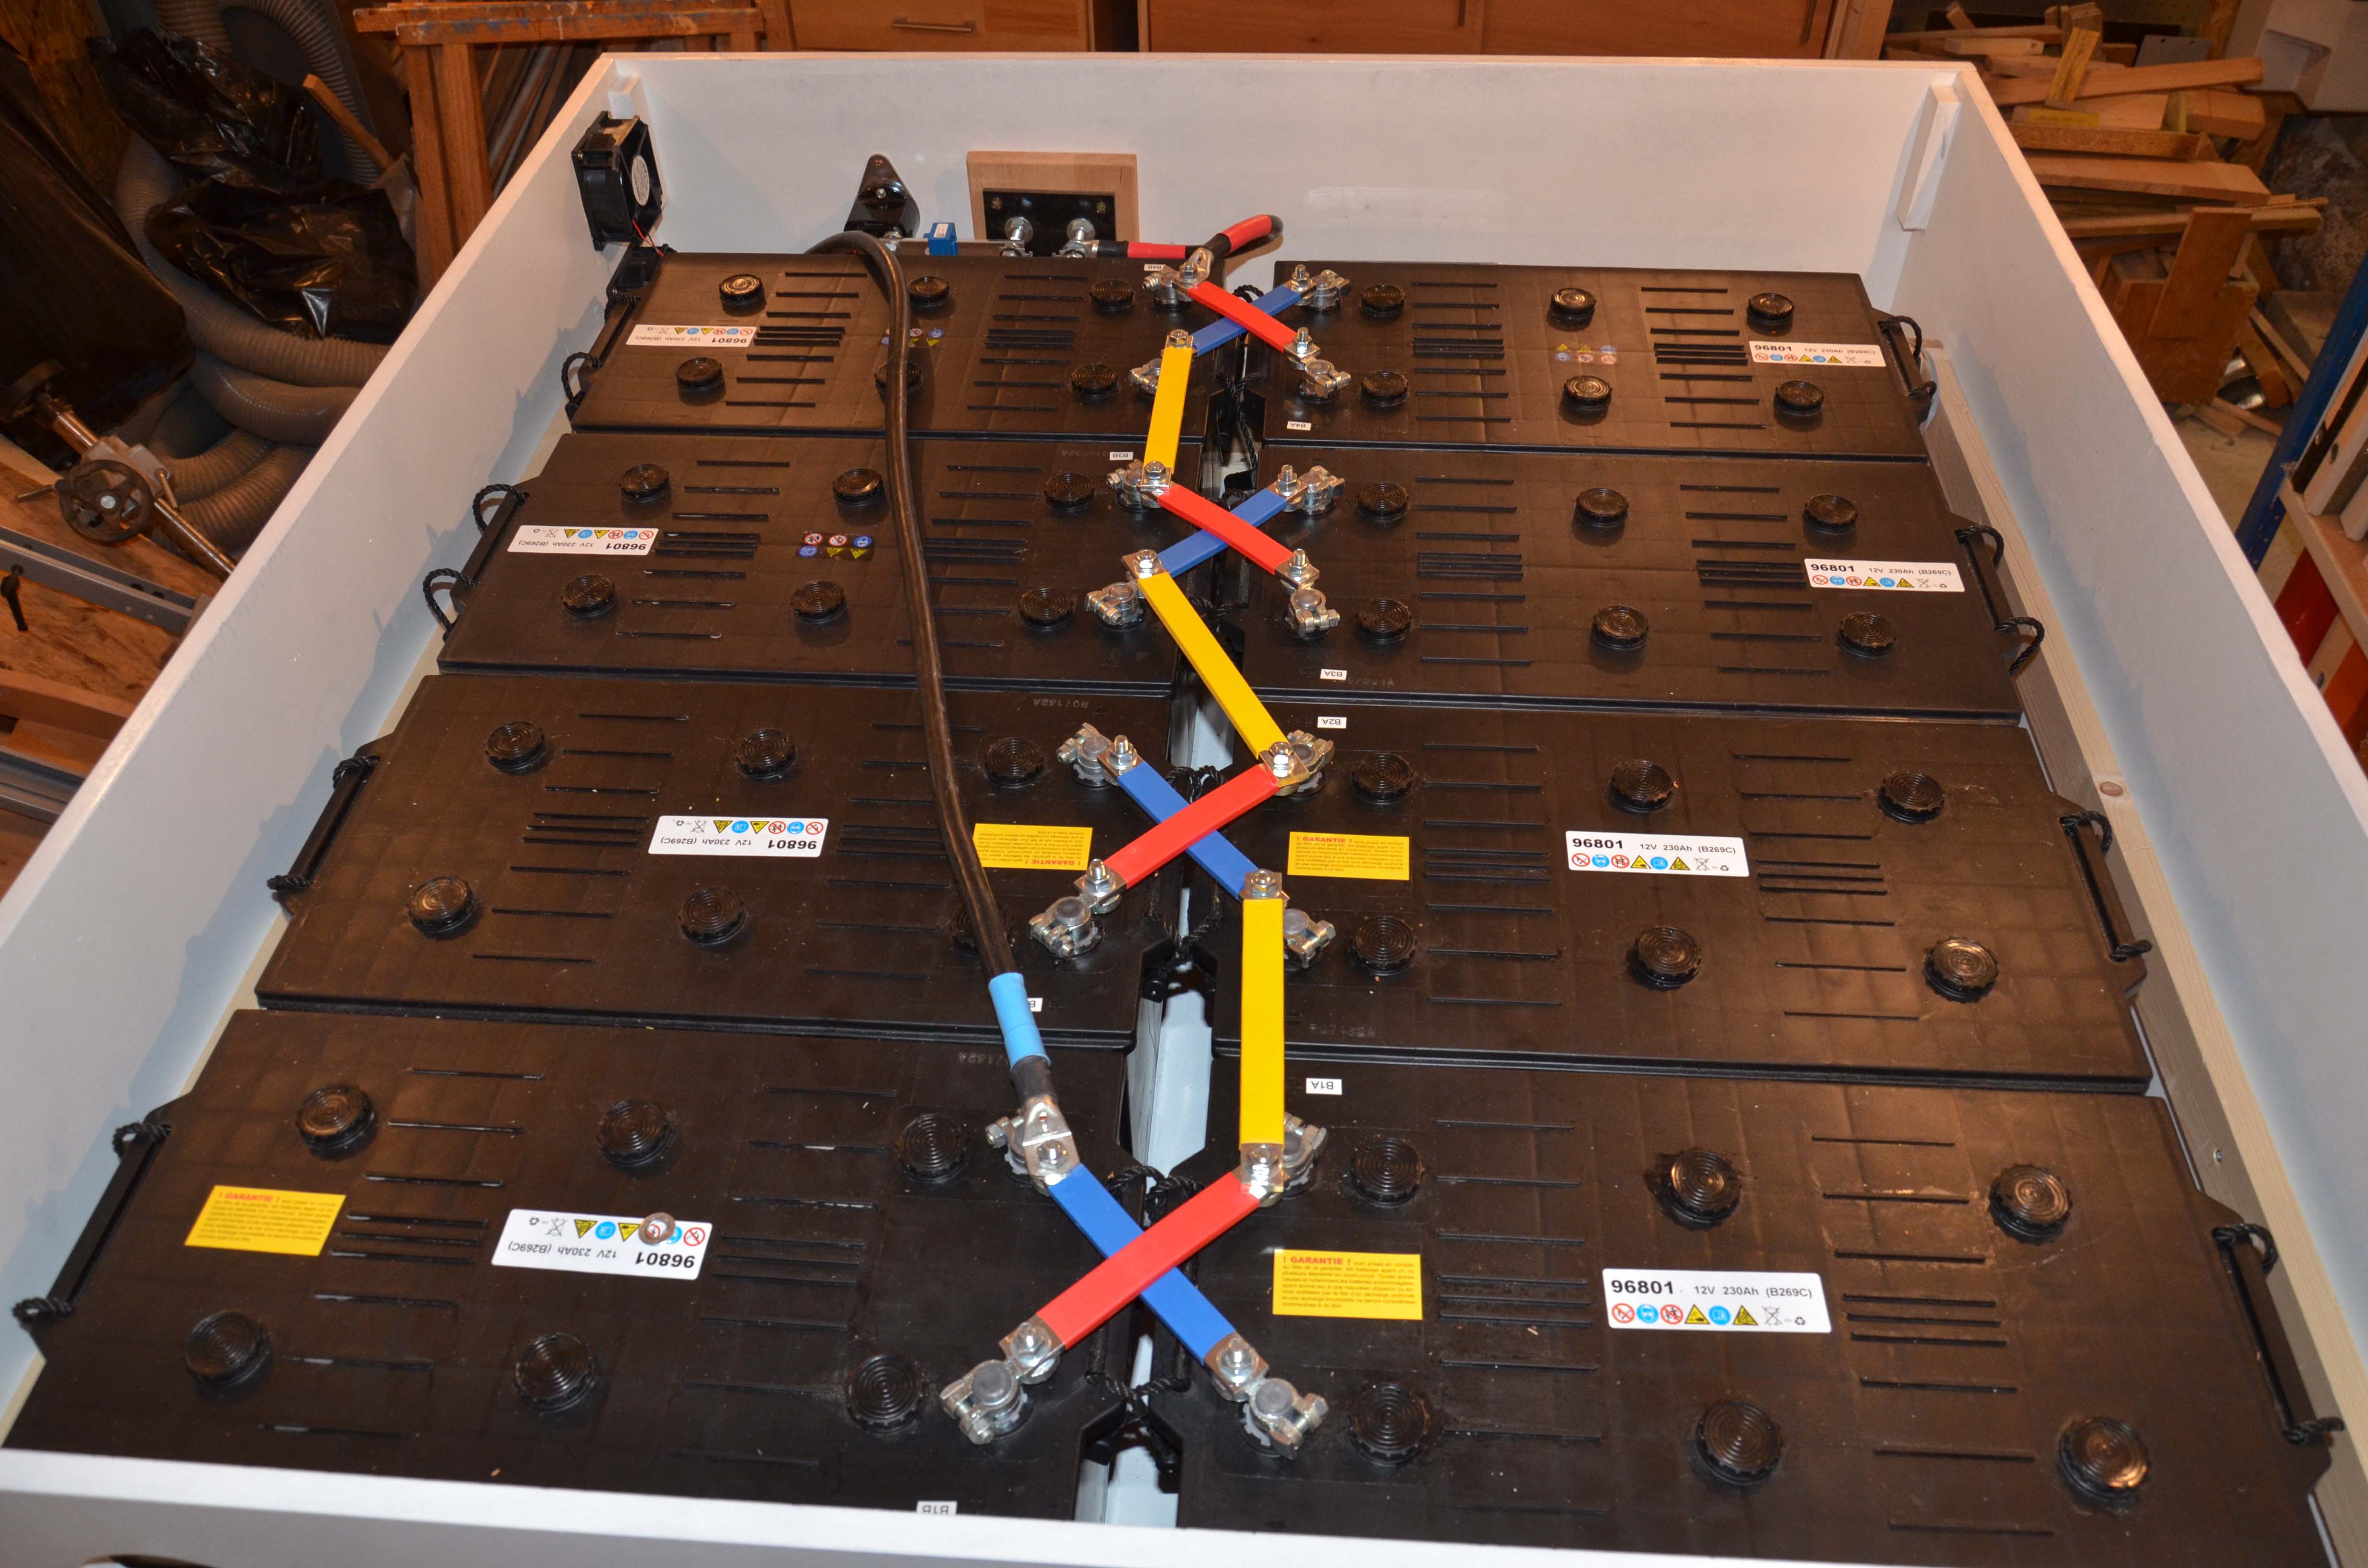
The 8 batteries are interconnected by the means of
heavy gauge copper bars insulated with colored
thermal sleeves. The gauge of the black cable on
the left is 95 mm².![]()
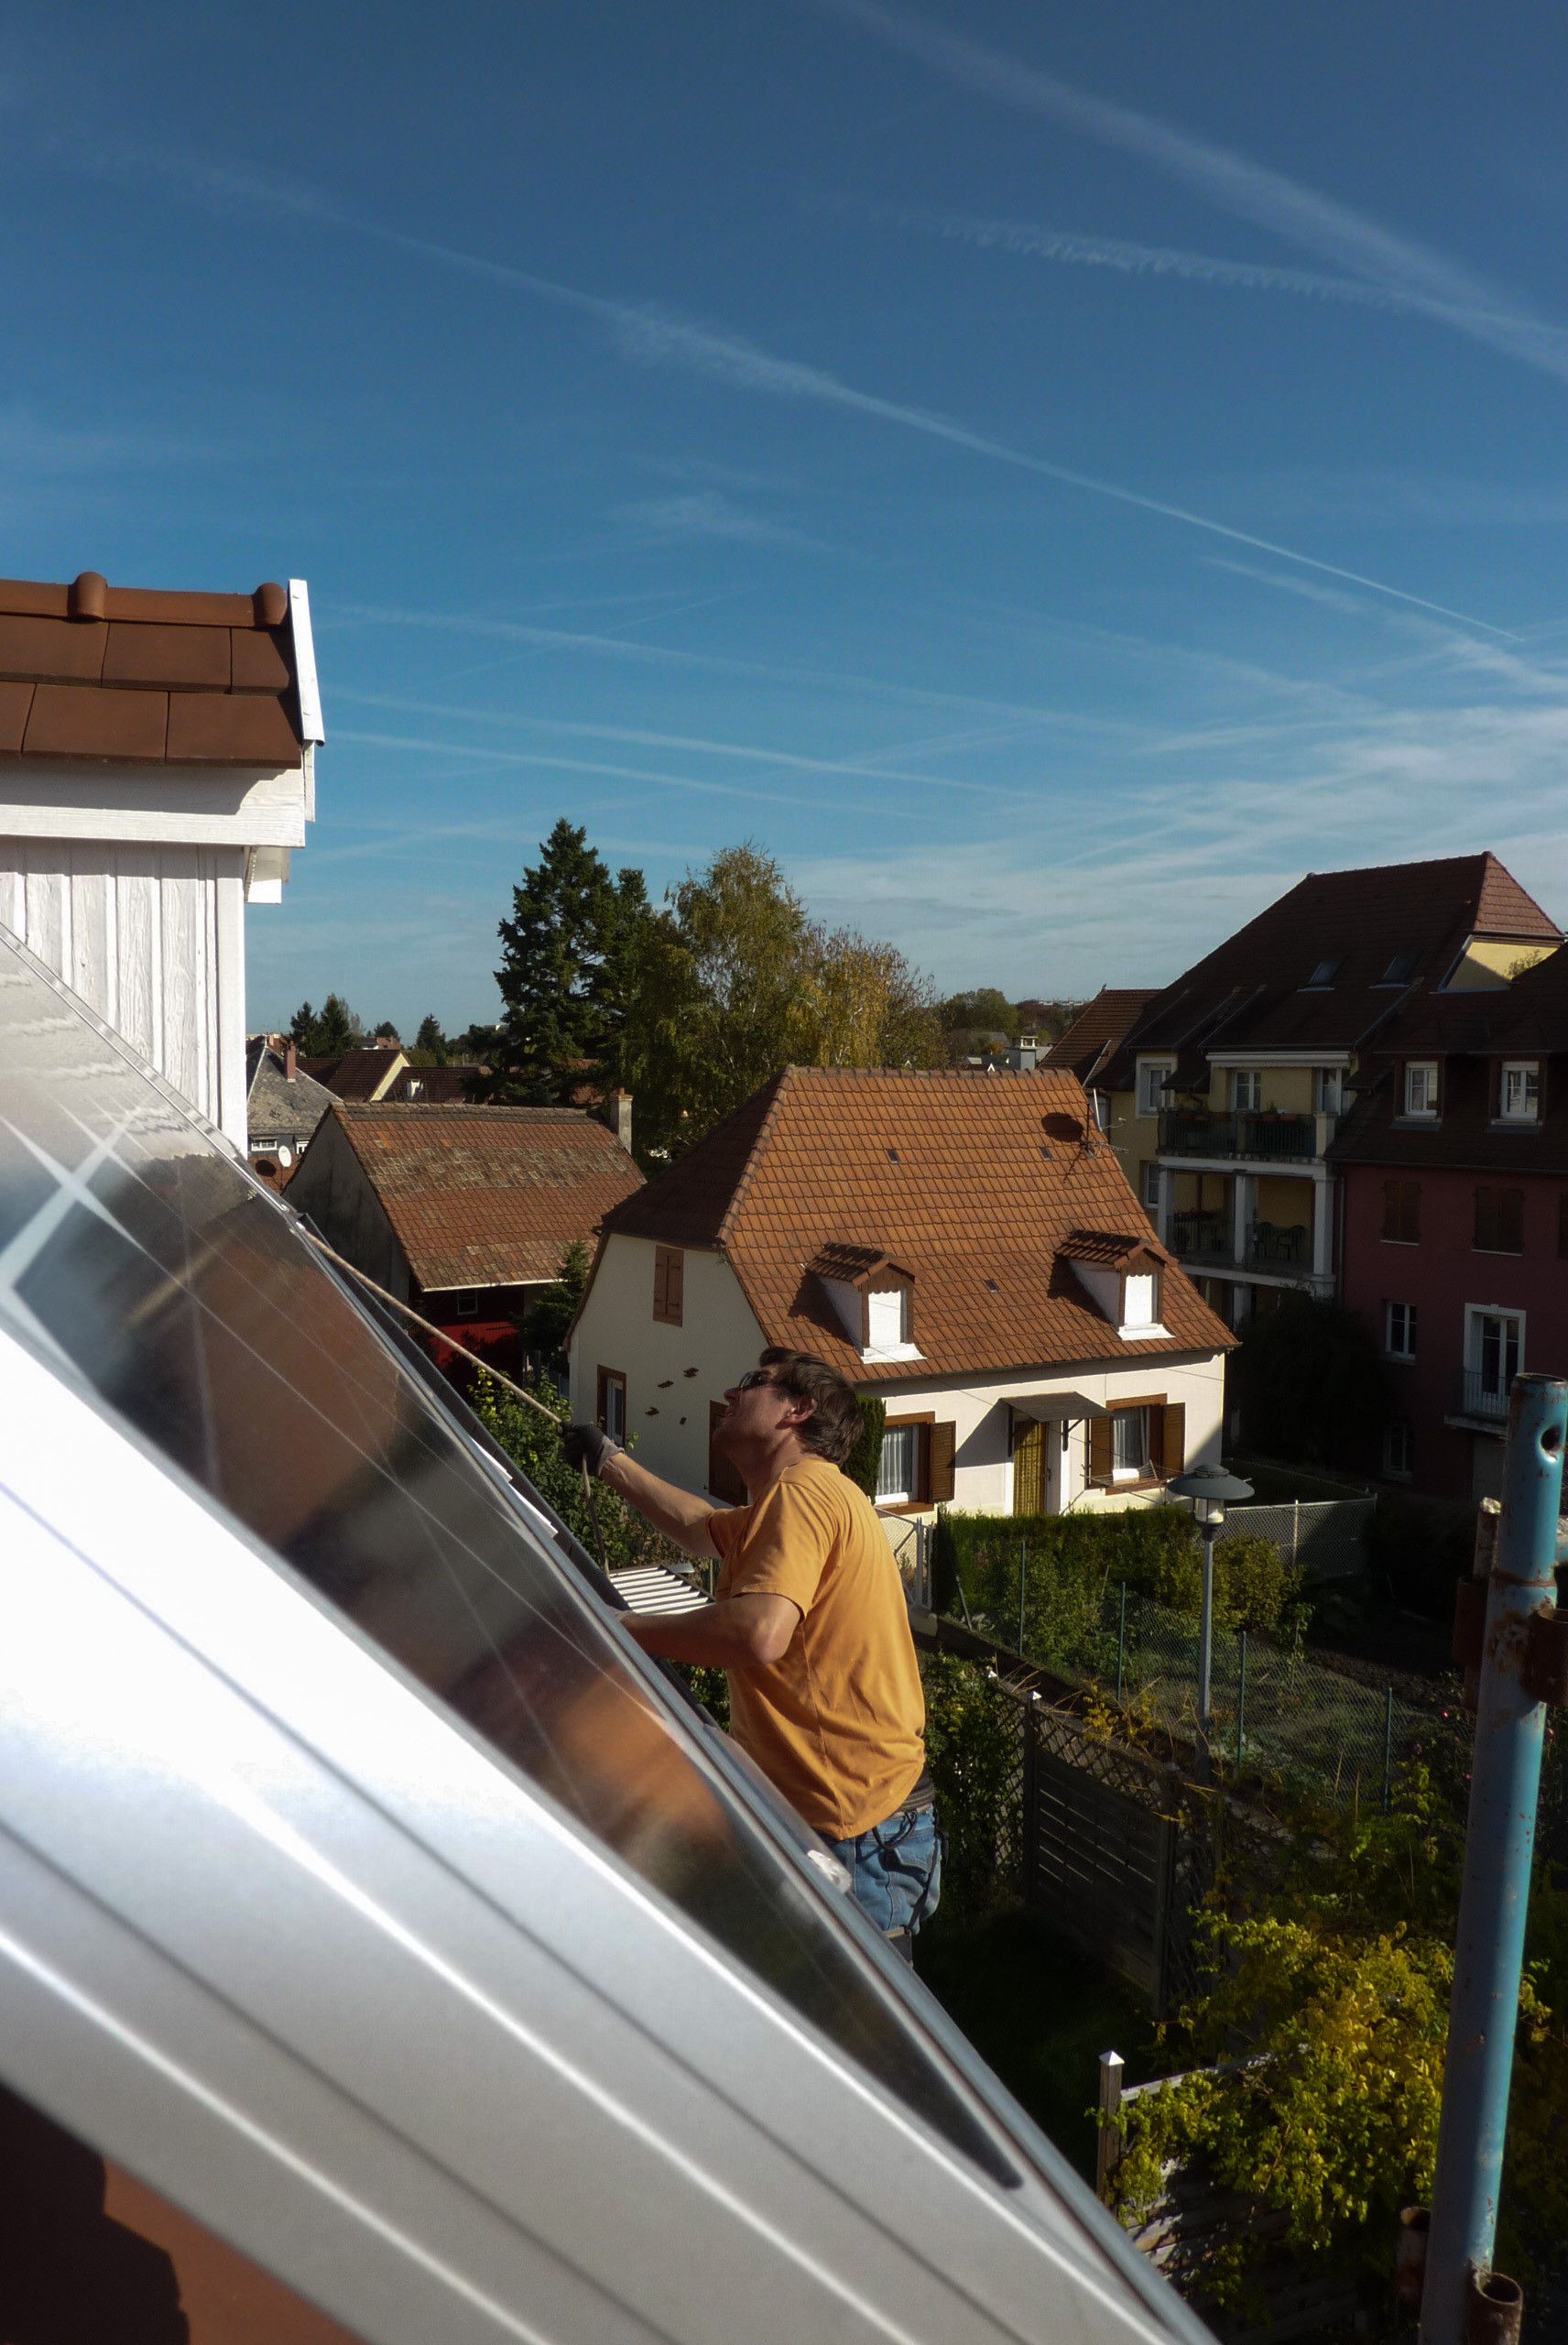
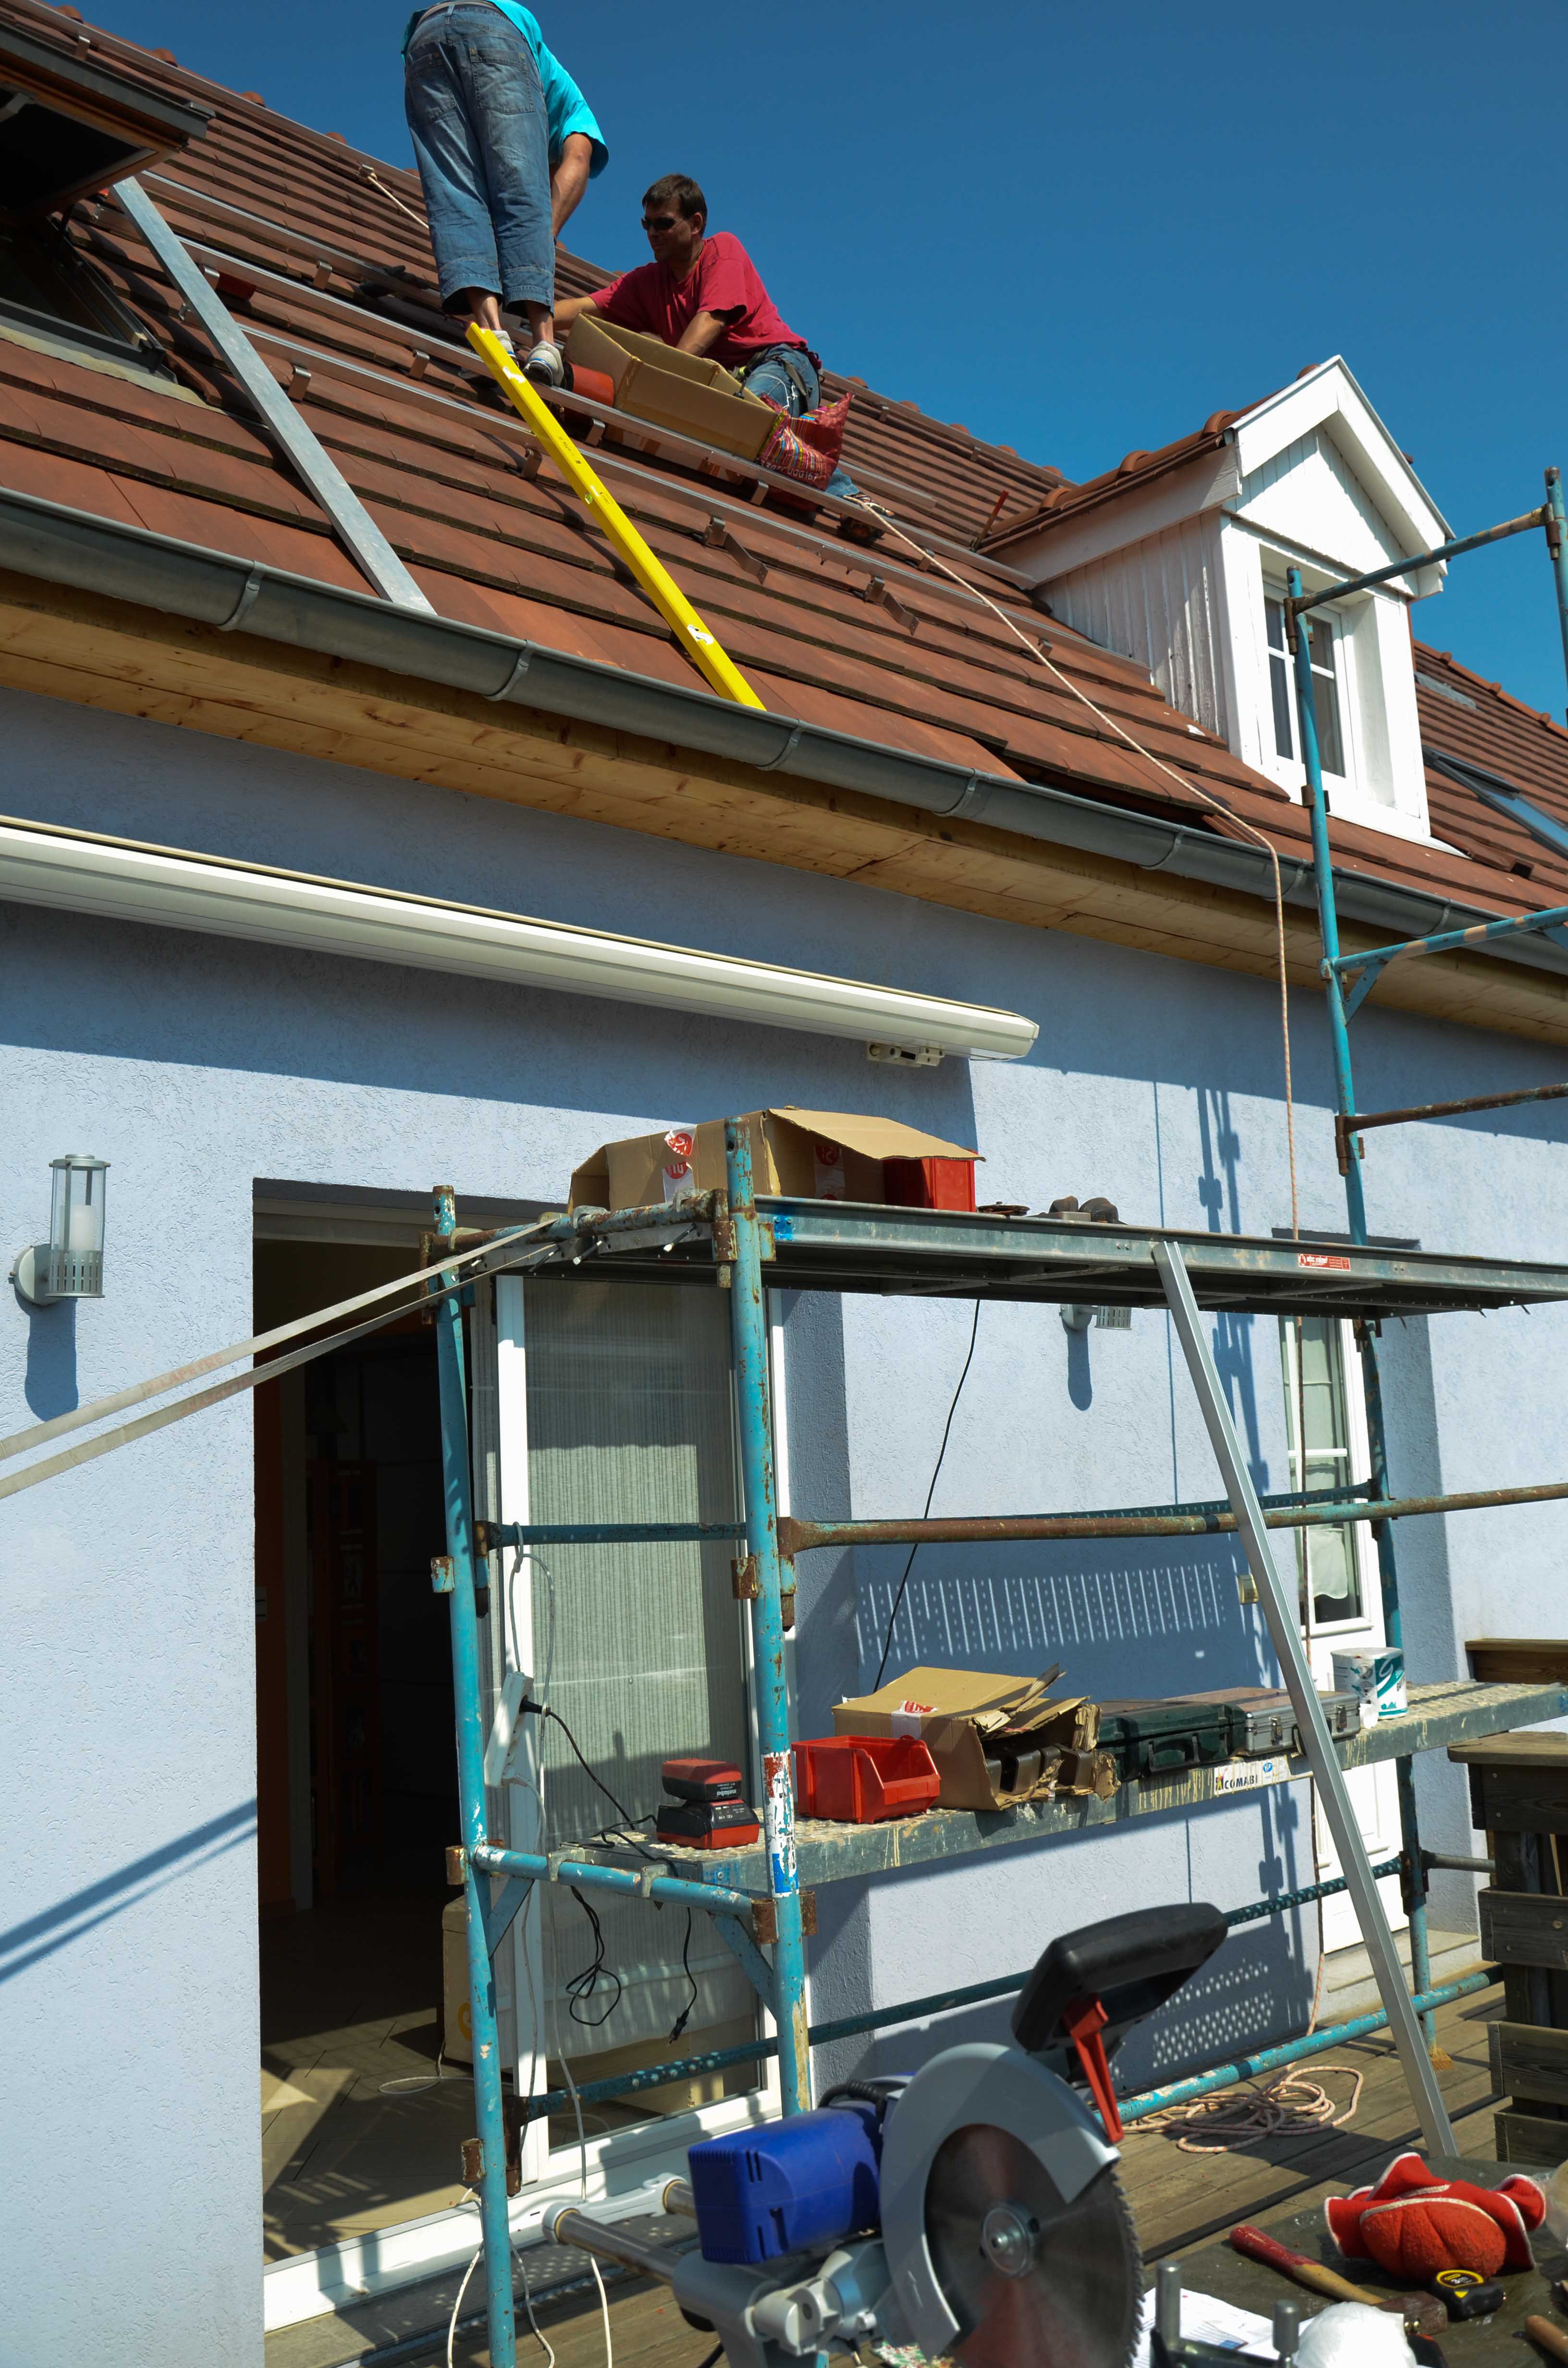
September 28th, 2013: On the roof again
Some tiles need to be adjusted to fit the big stainless
steel hooks that secure the rails to the wood frame.![]()
Rail mounting will son be finished.
![]()
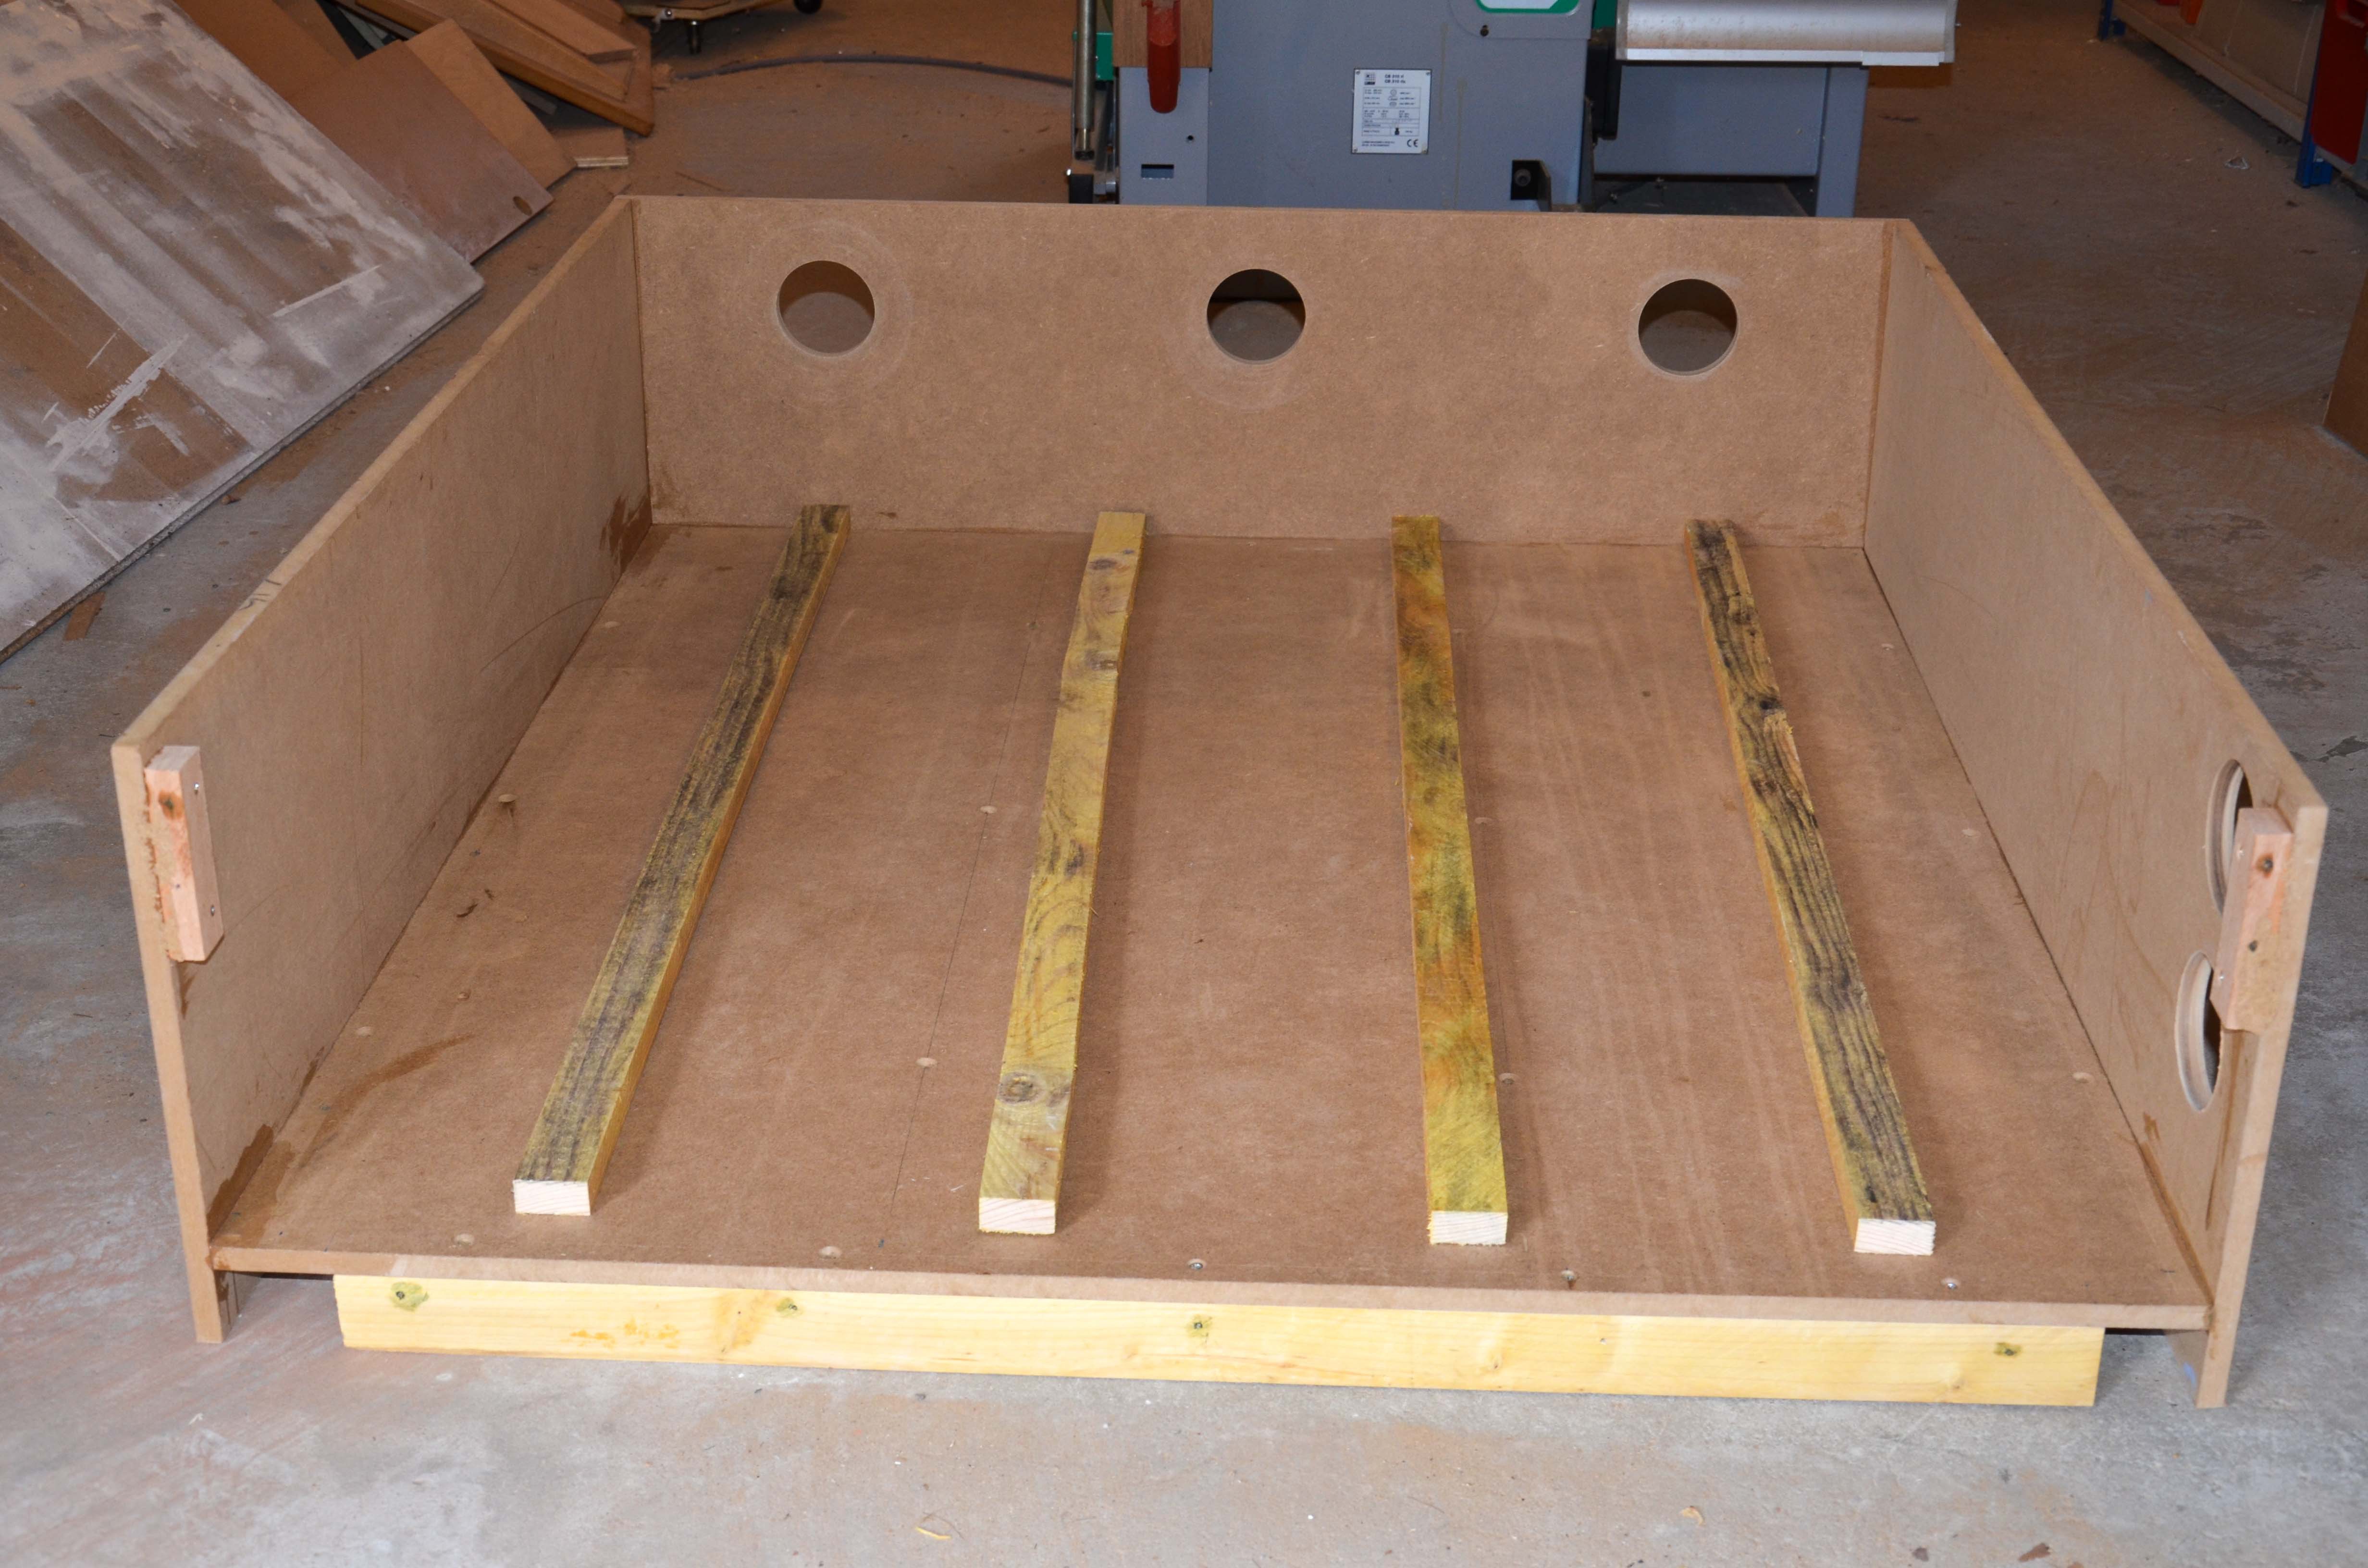
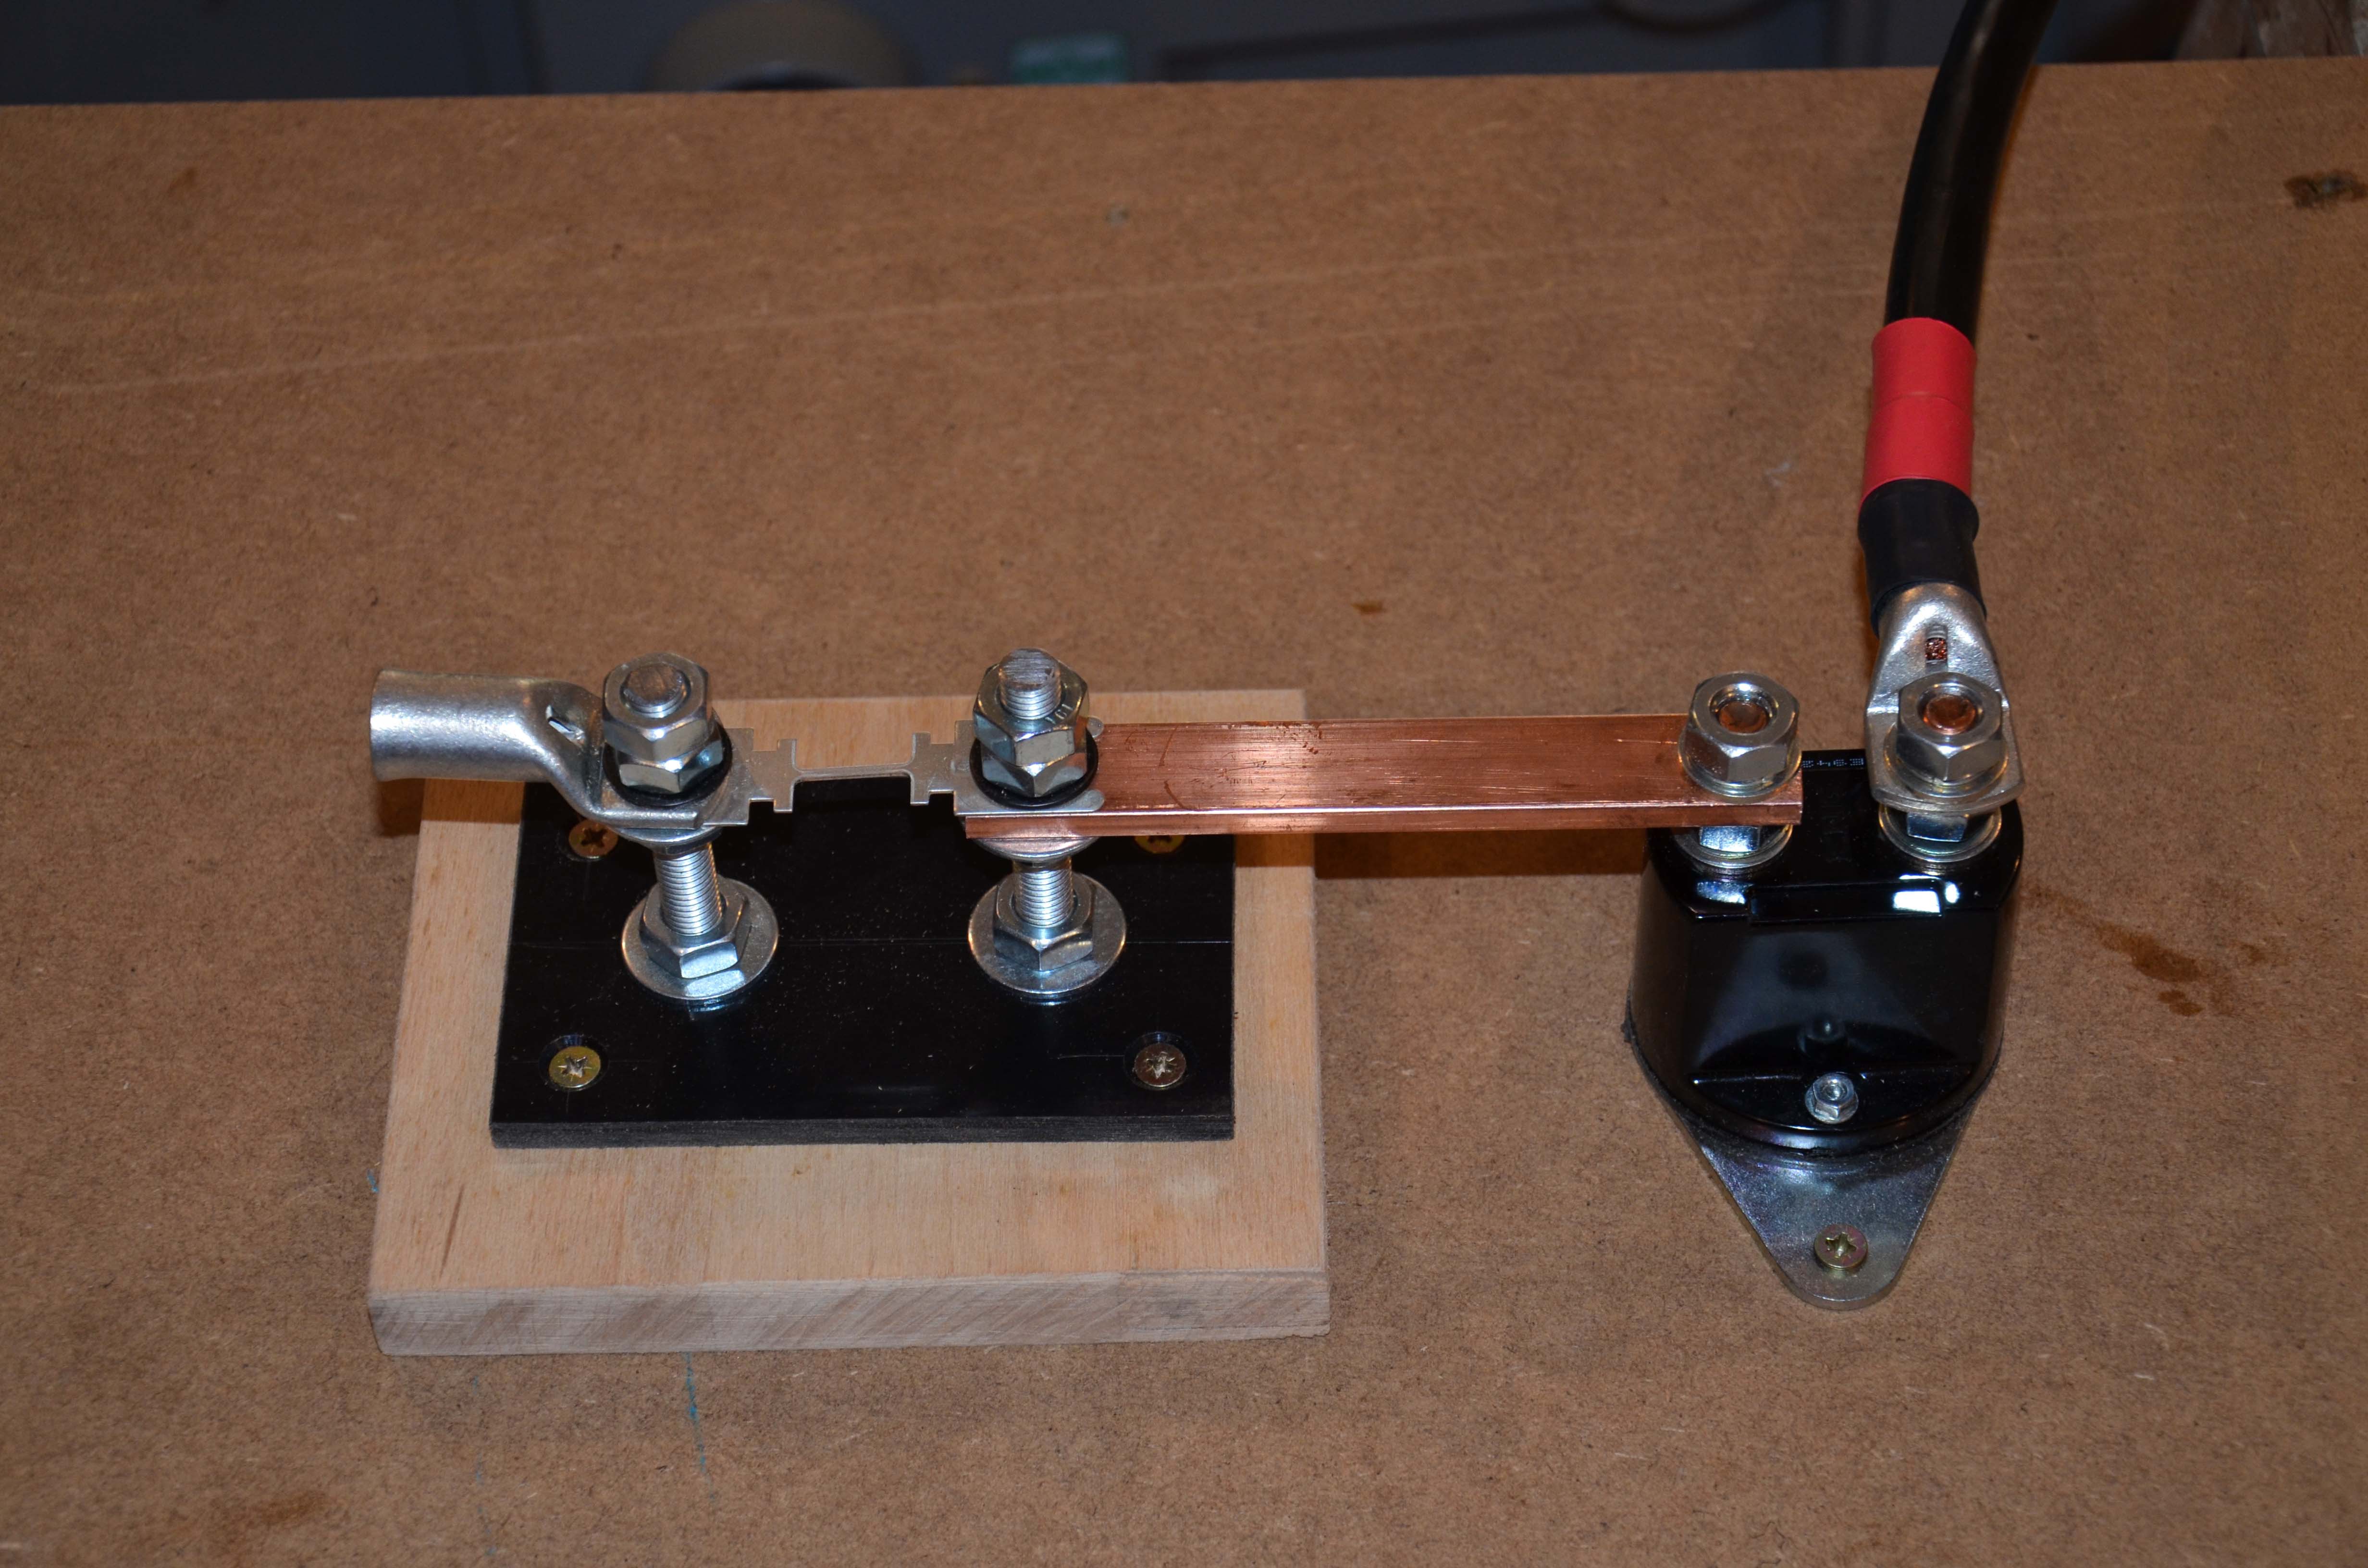
August 25th, 2013: Battery Box and 200 Amps fuse
The battery box. It will be equipped with a liner
to protect the floor in case of a battery leakage.![]()
A 200 Amp fuse, an heavy duty switch and heavy
gauge cables are necessary to avoid losses.![]()
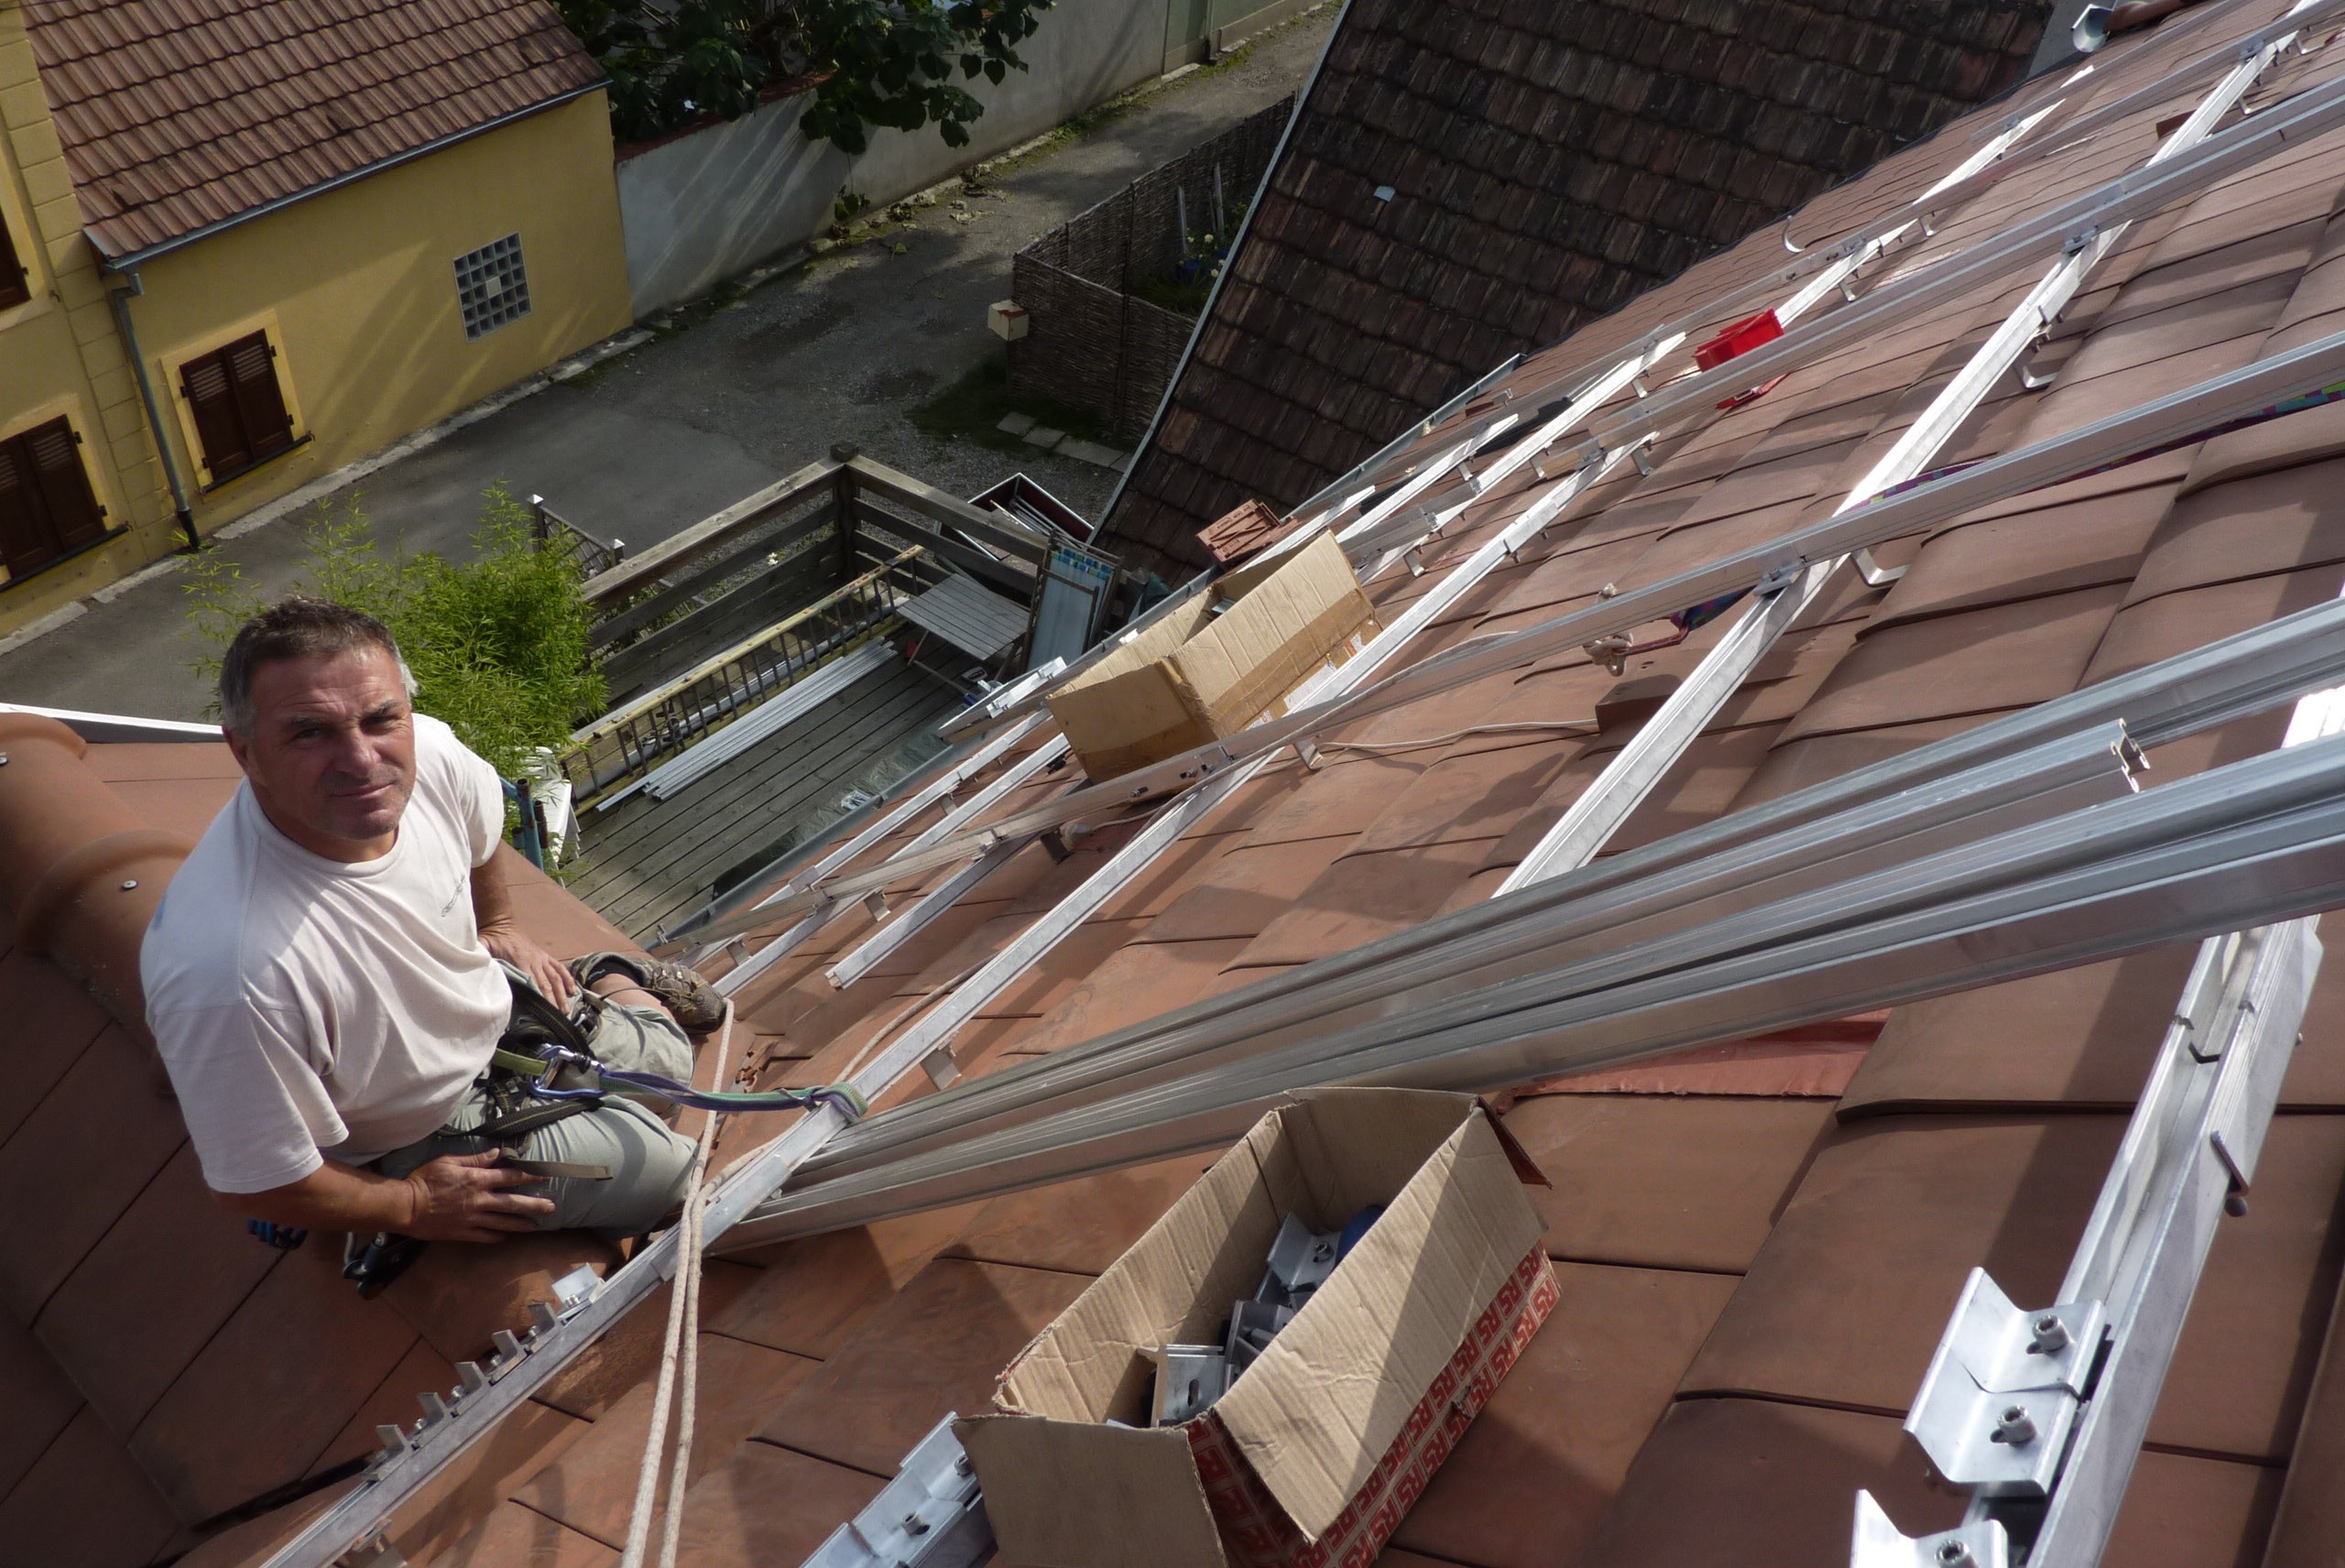
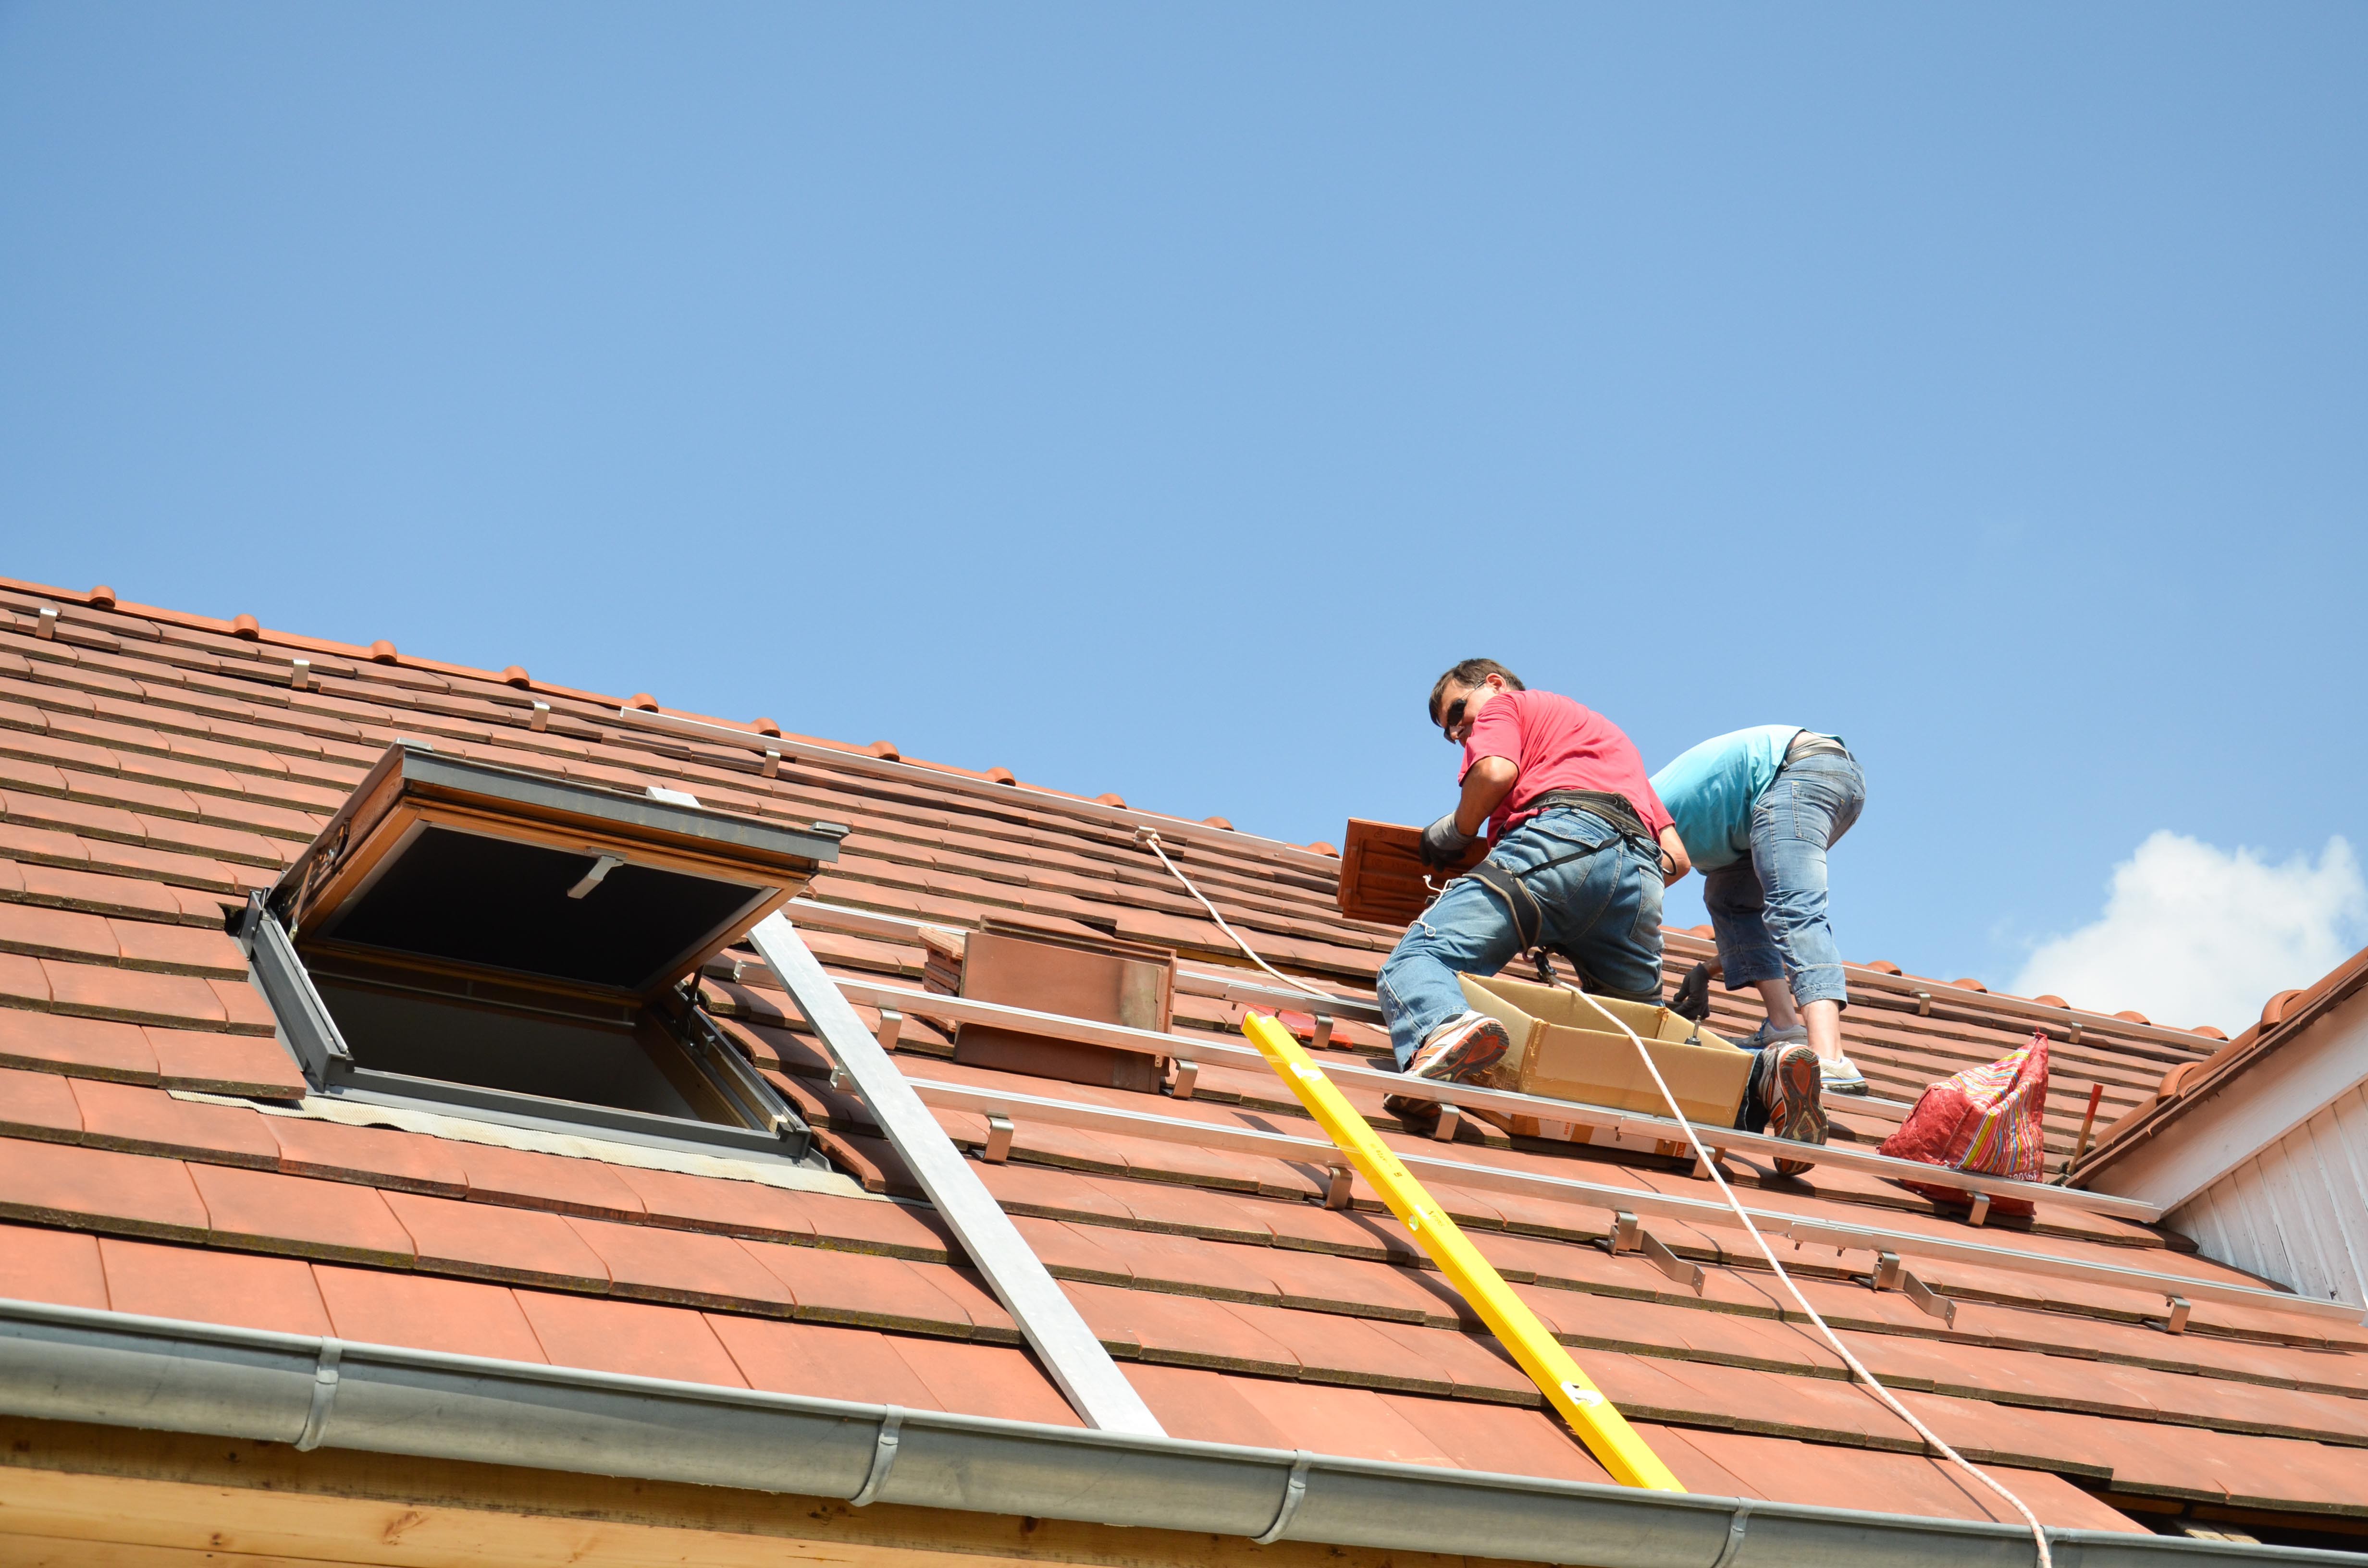
August 8th, 2013: Started to mount the rails on the roof
The toughest part of the project: to mount the modules on my old house's uneven roof.
![]()
A lot of rails have to be secured to the roof before one can mount the panels.
![]()
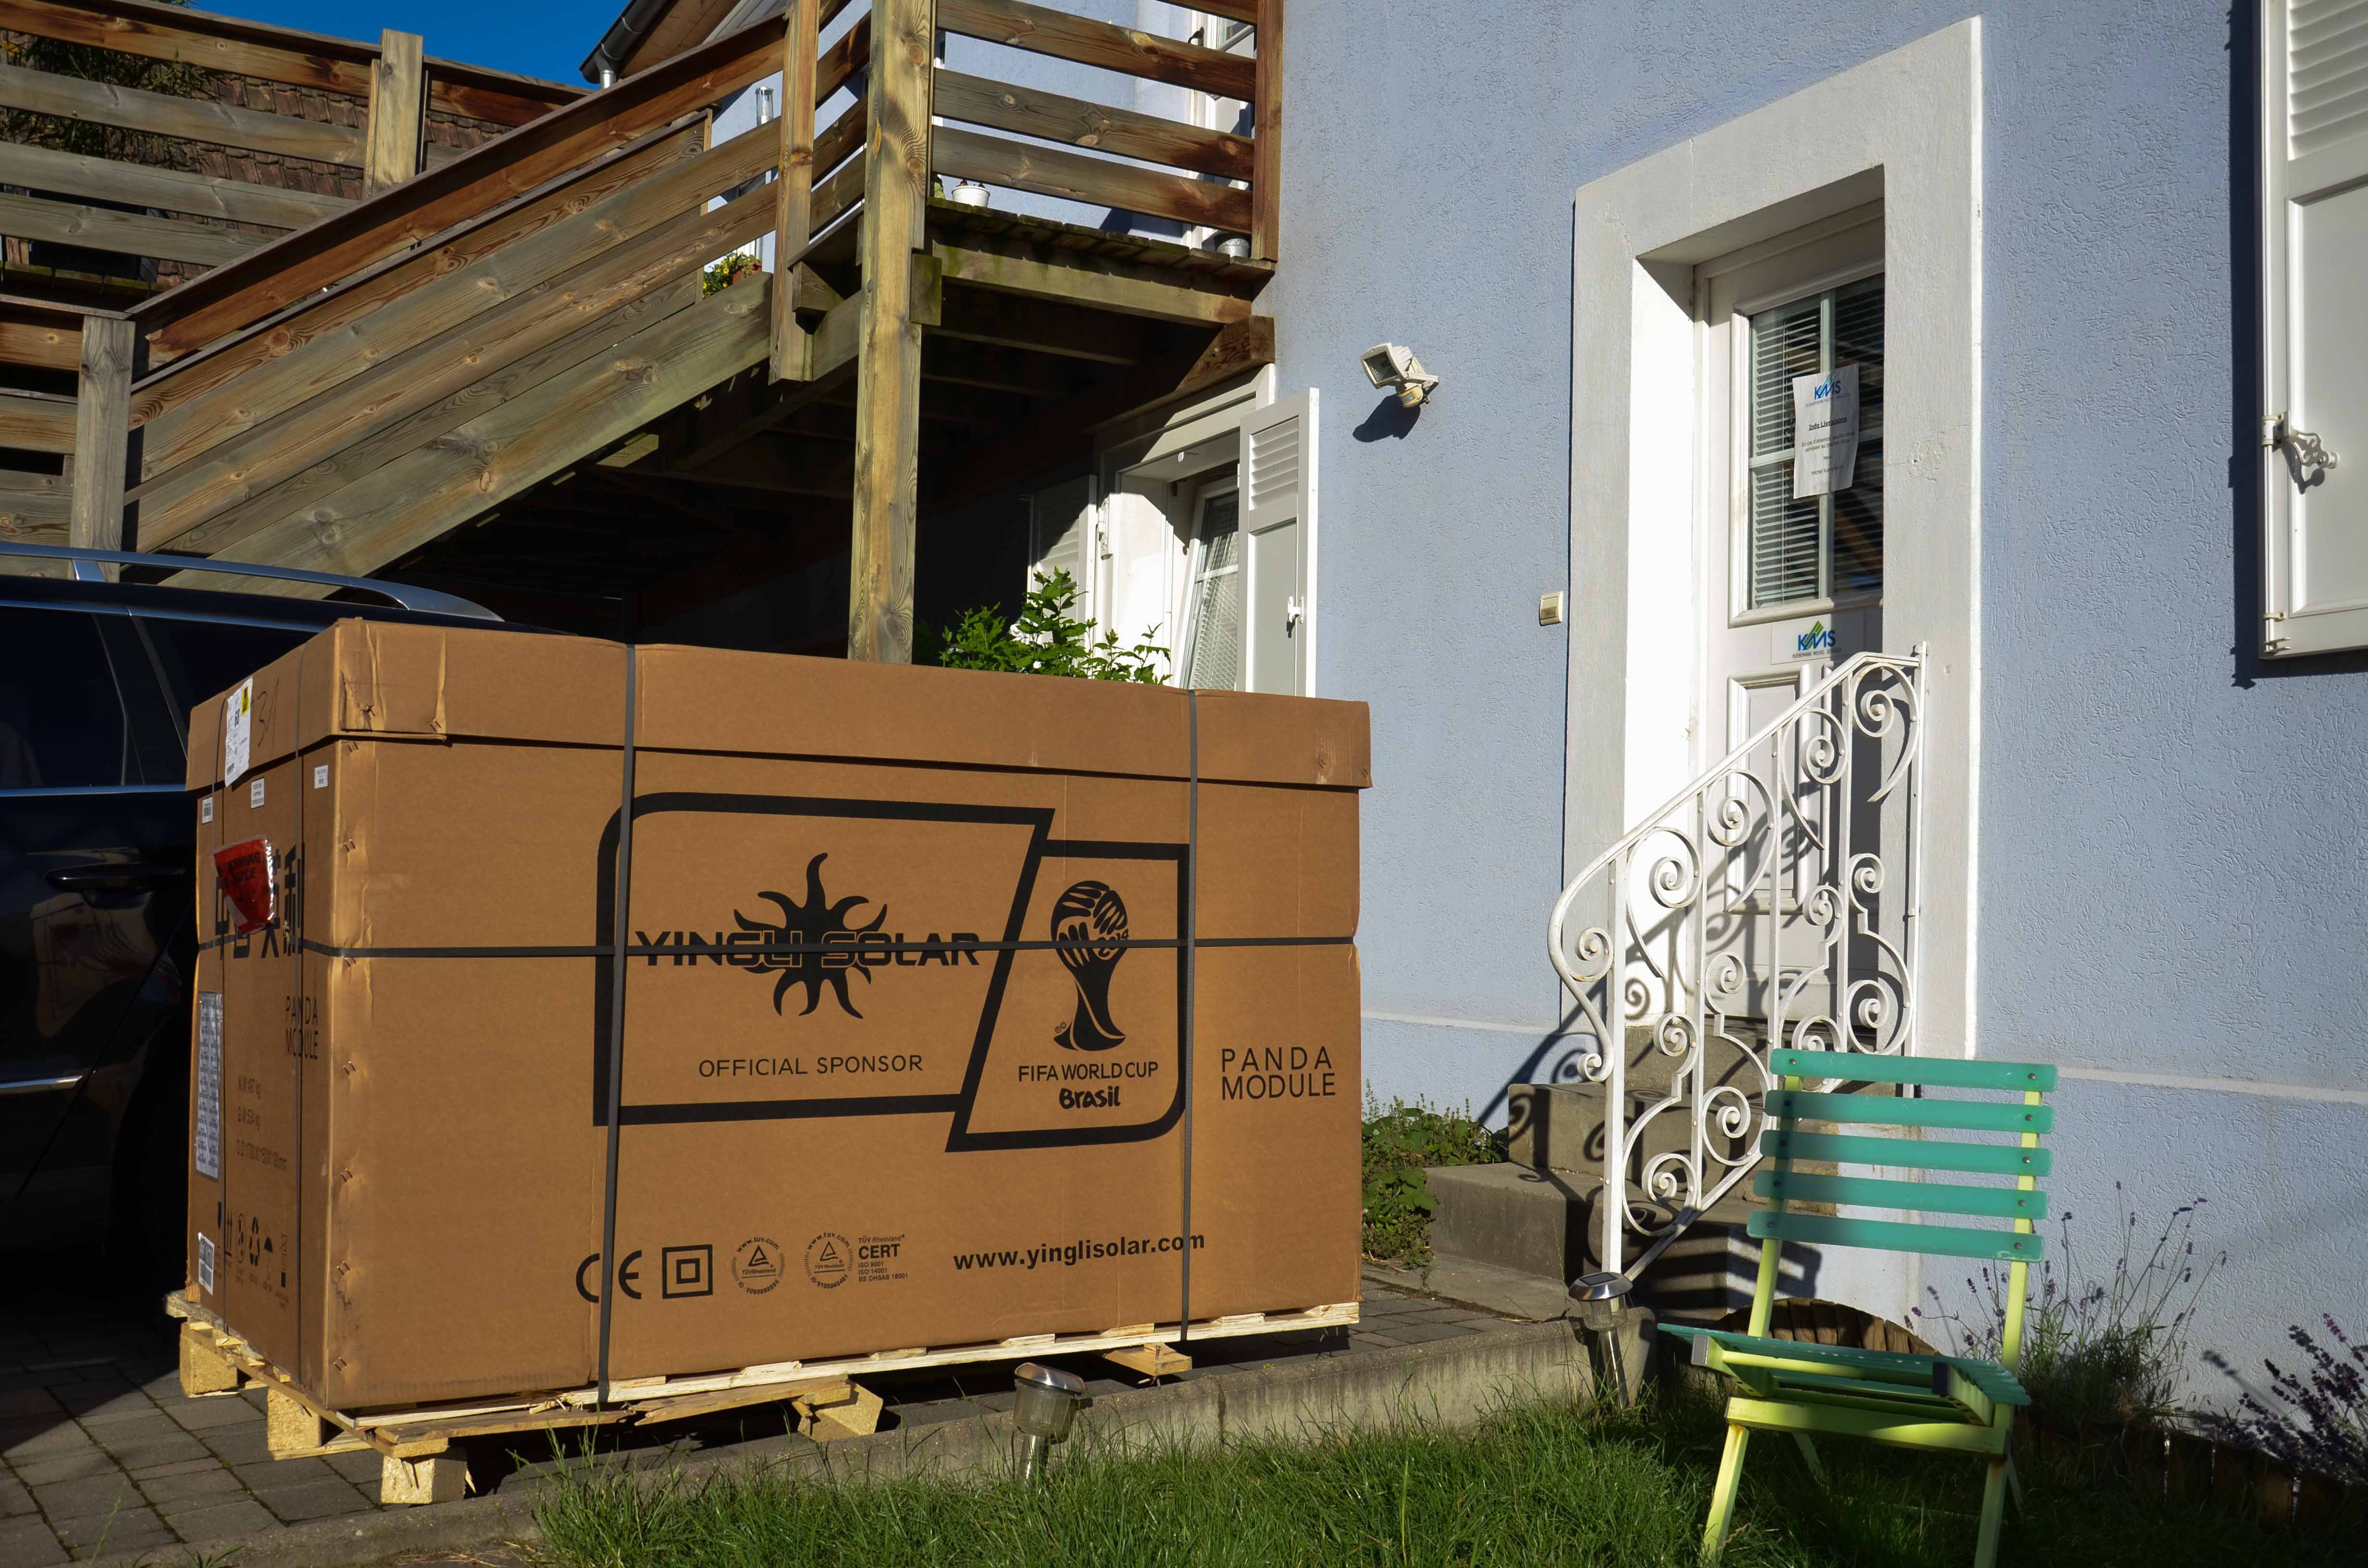
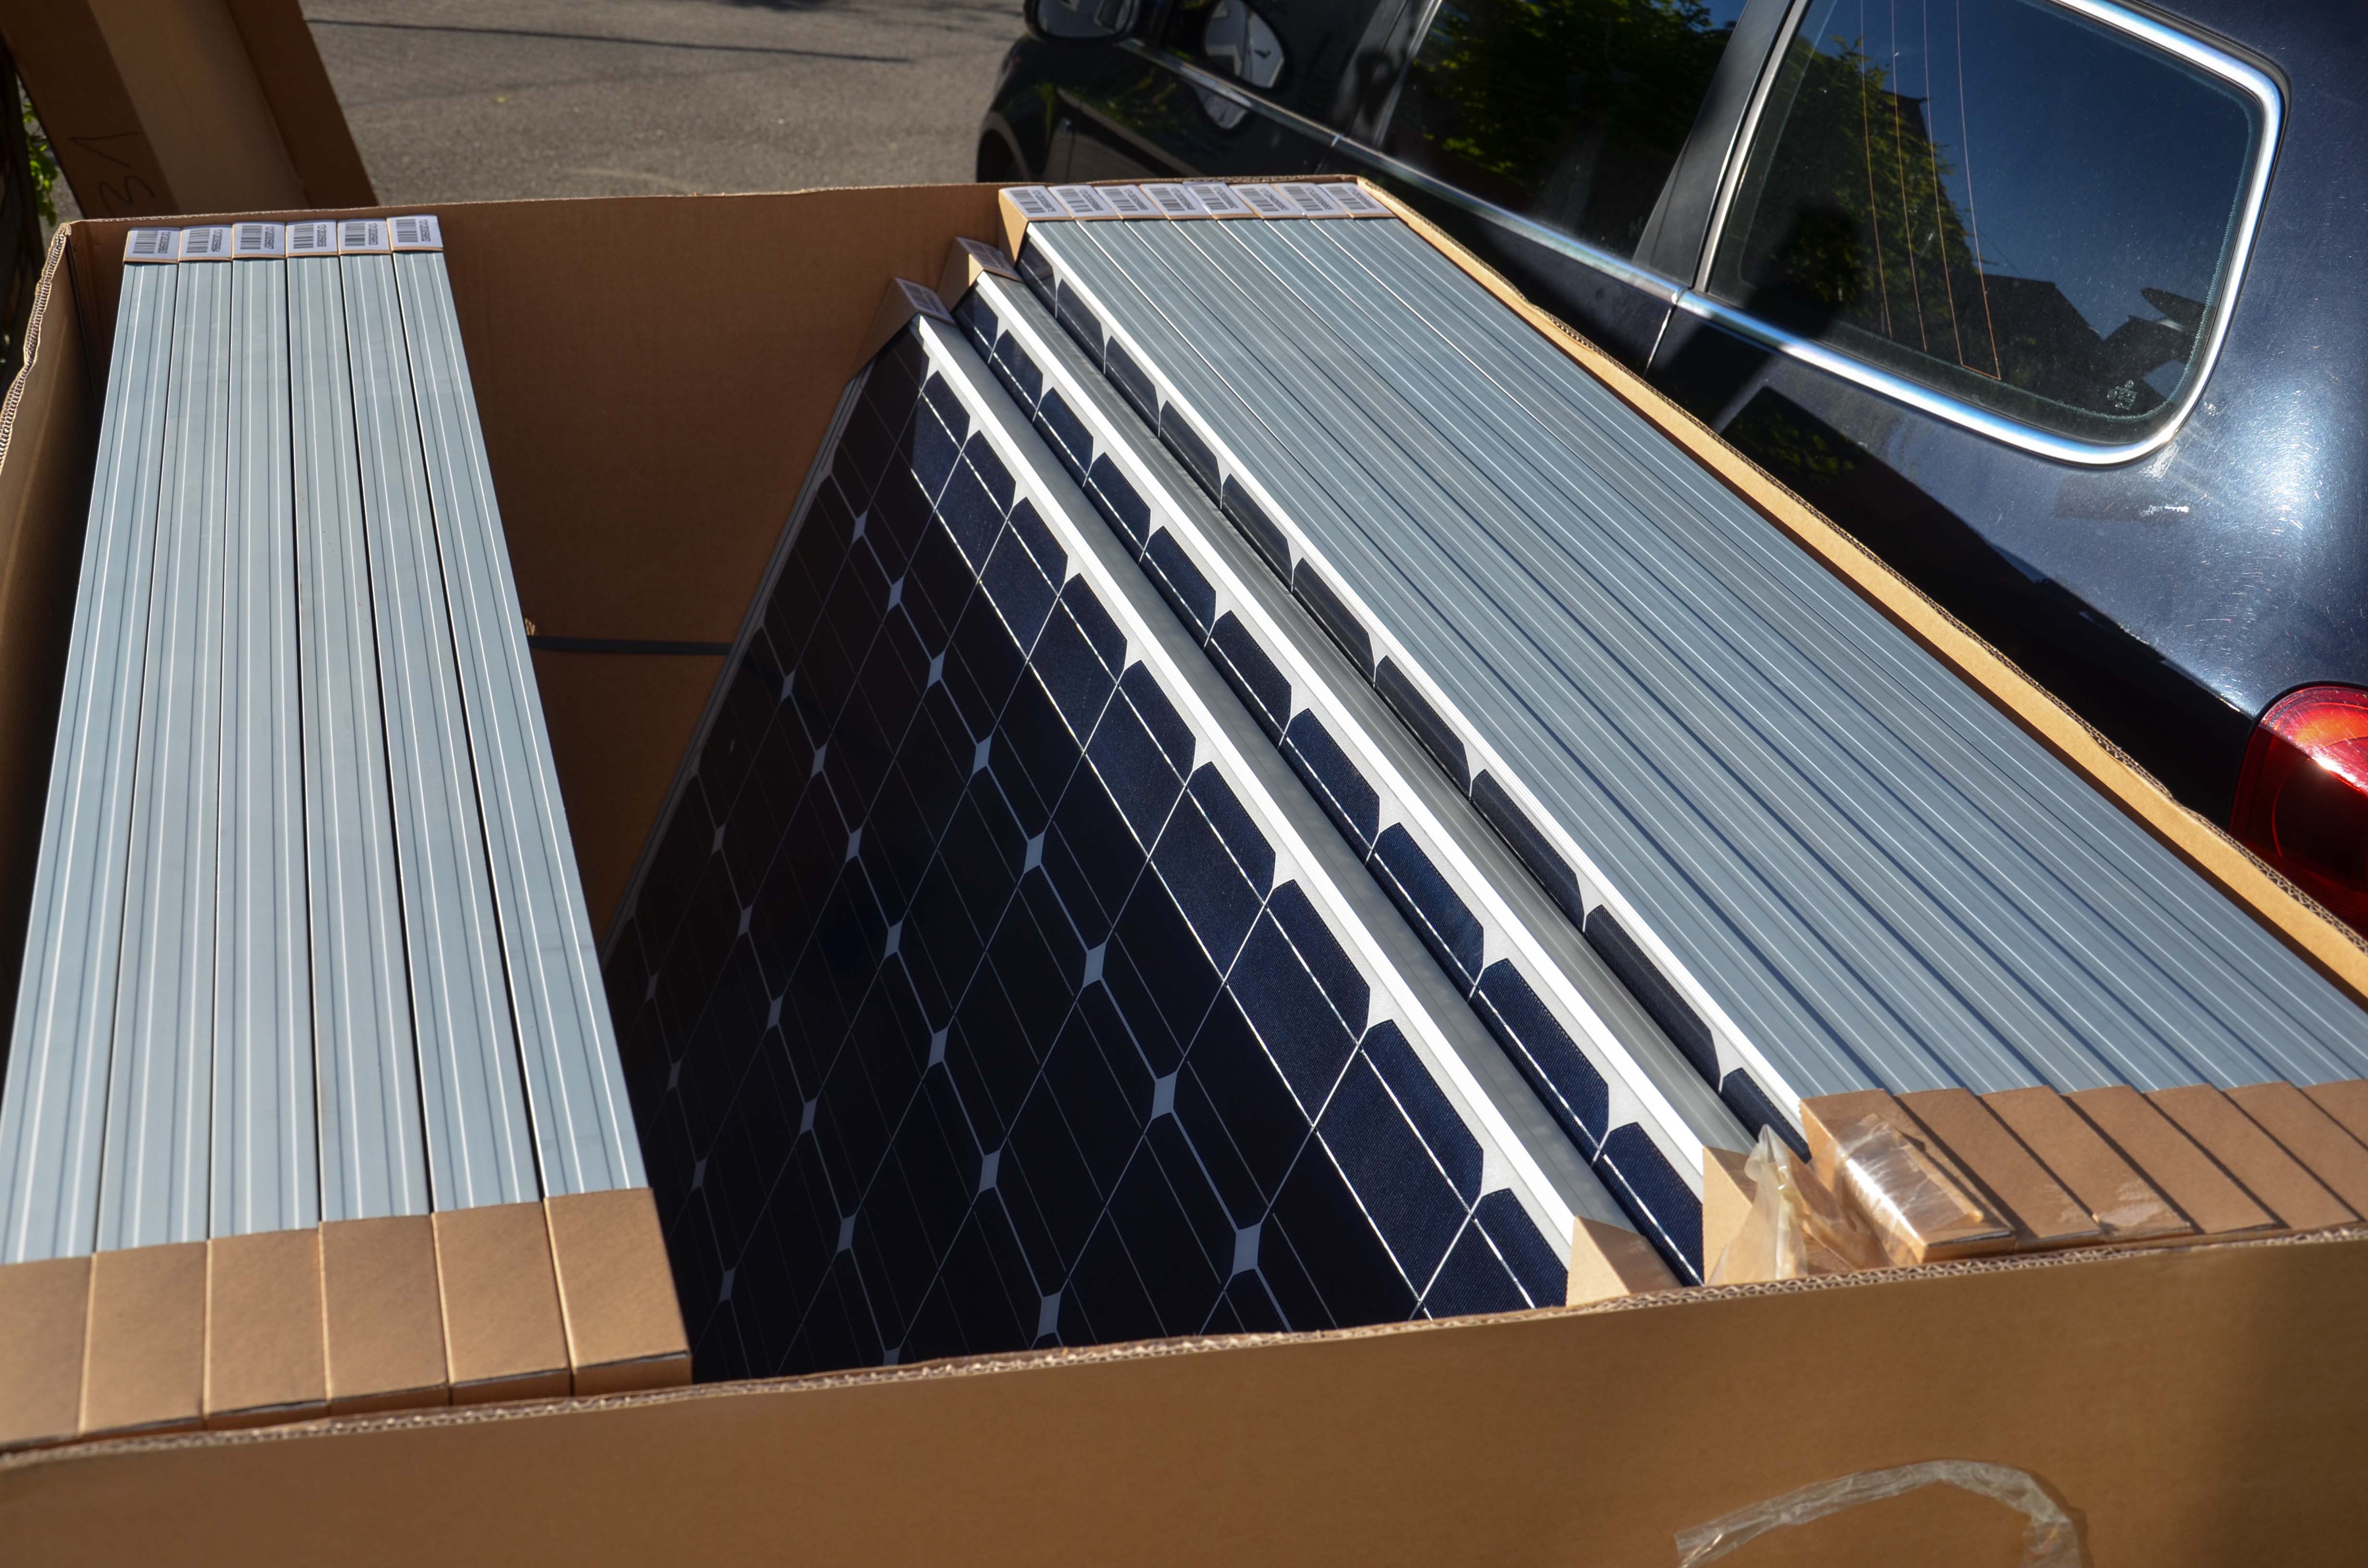
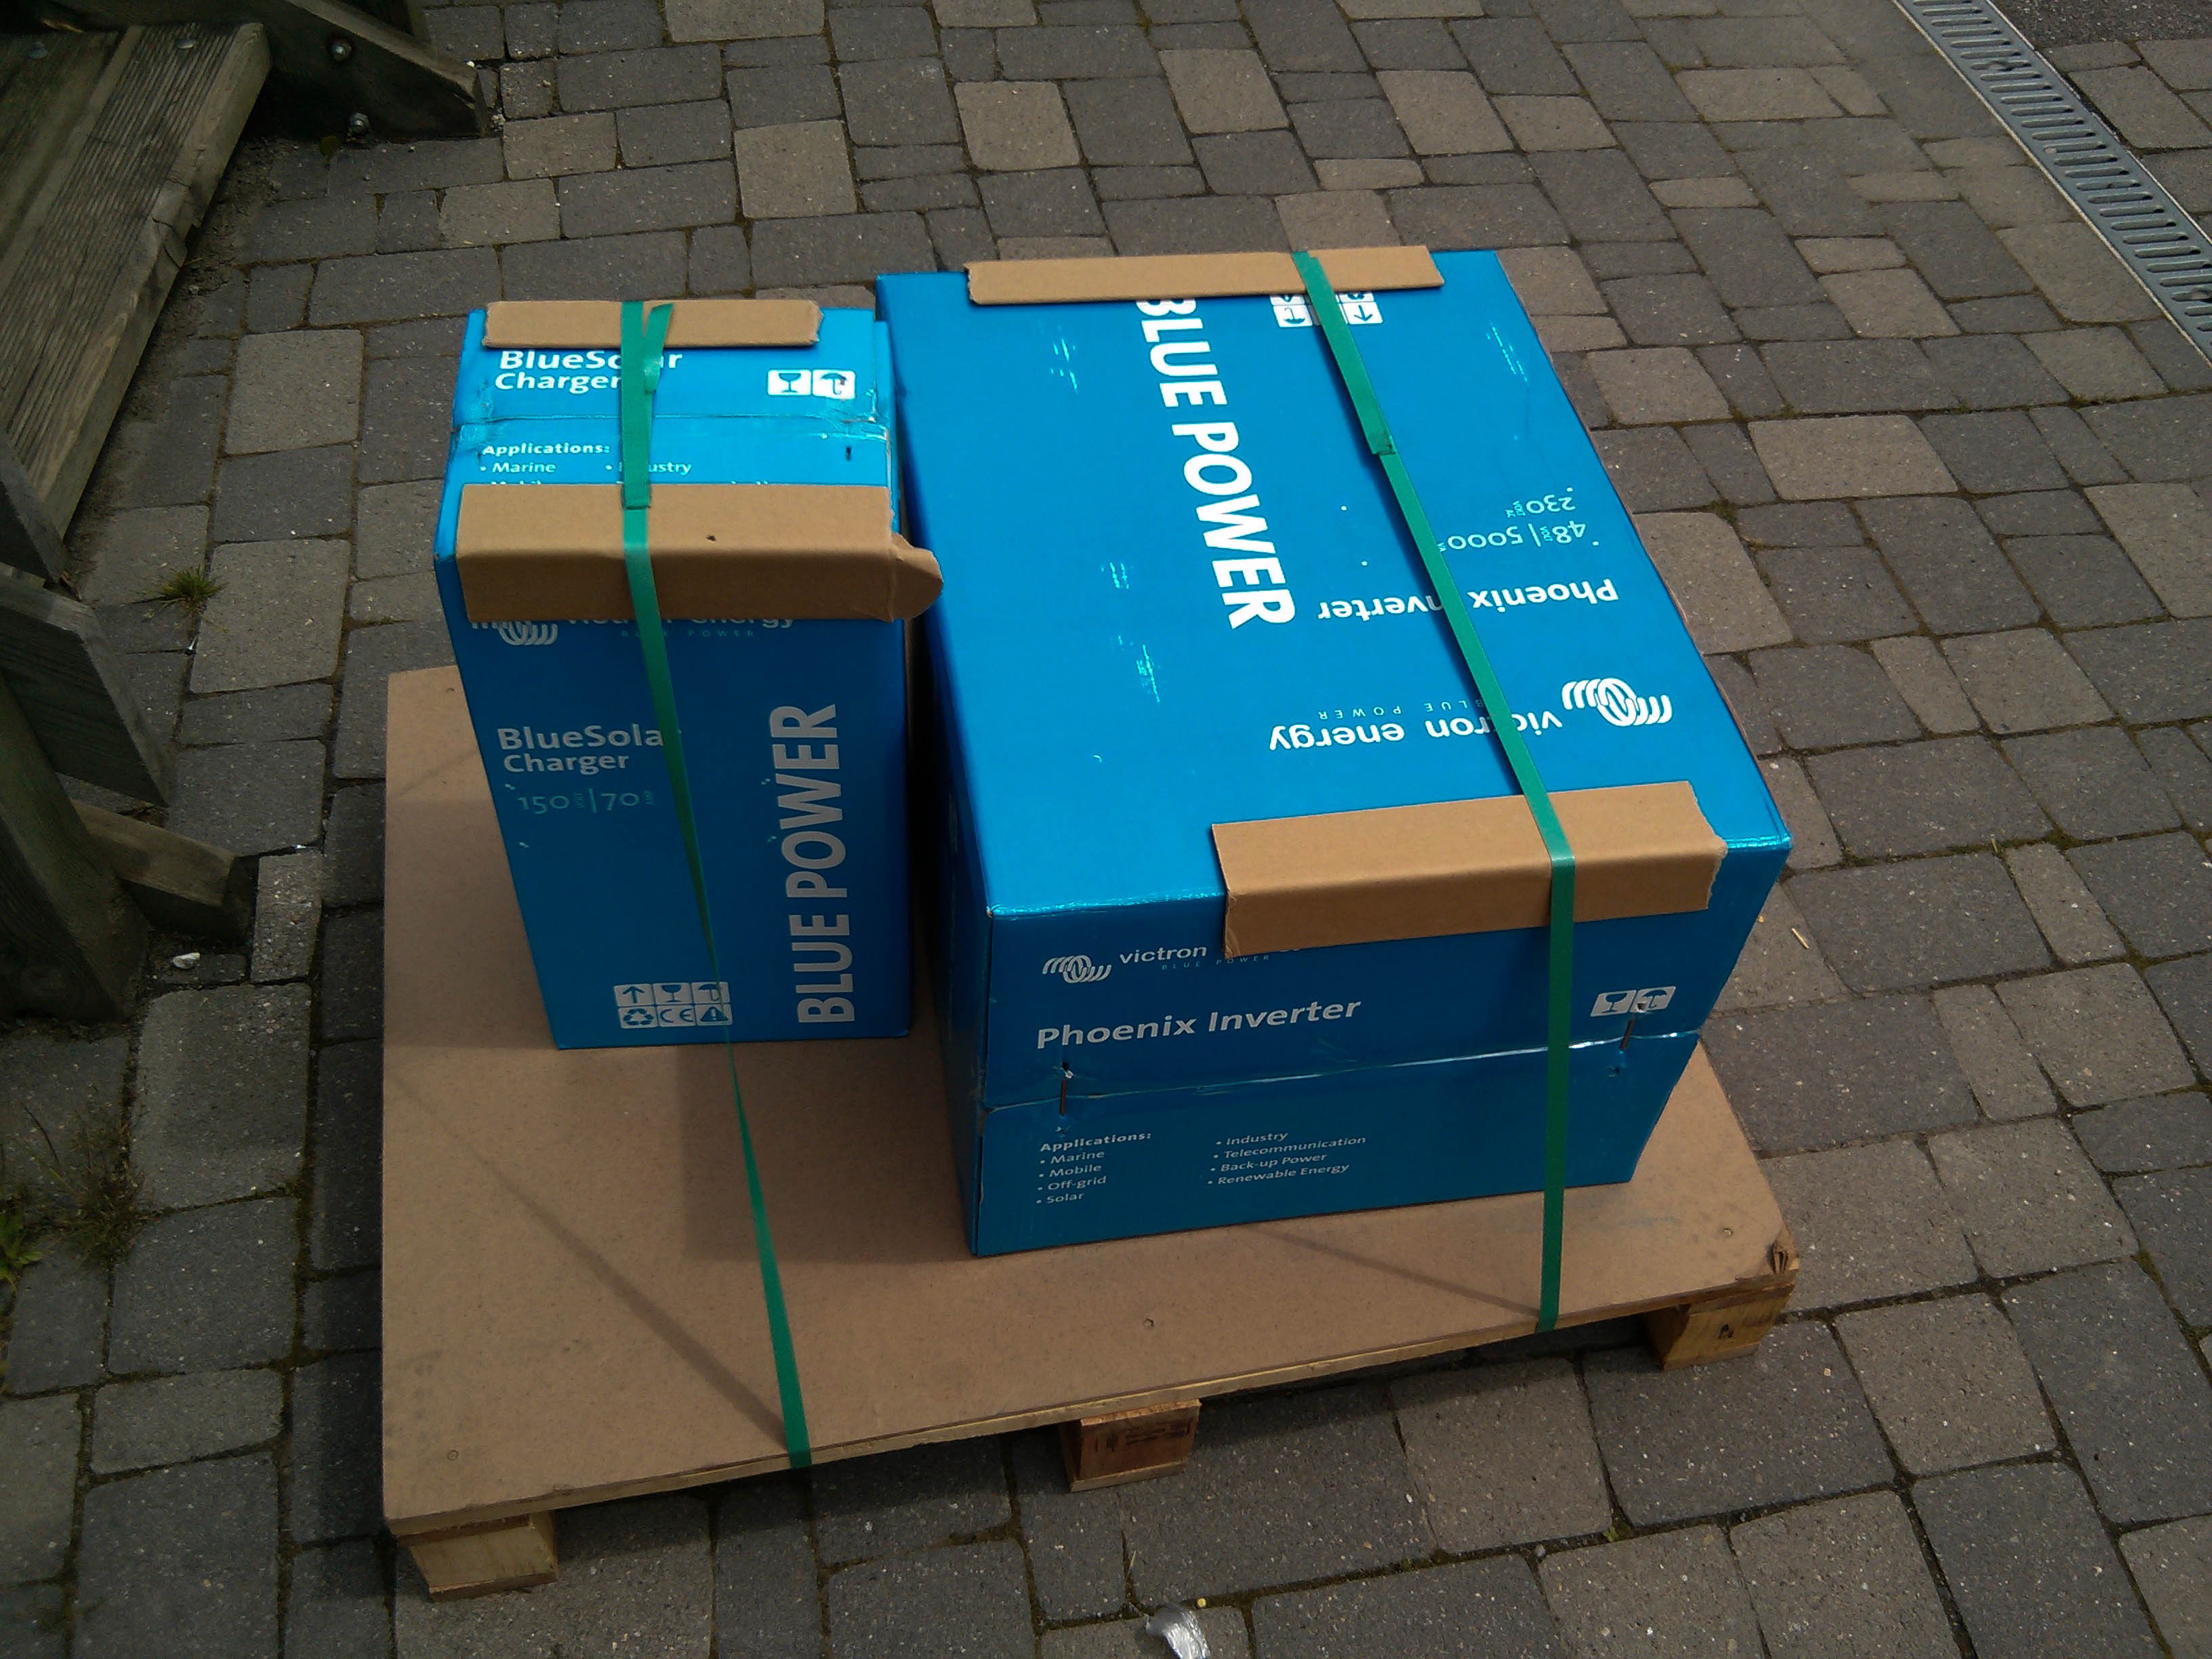
June 21st, 2013: Solar Modules delivery
The pallet containing the 16 modules looks great.
![]()
The 16 modules are capable of delivering 270 Watts each.
![]()
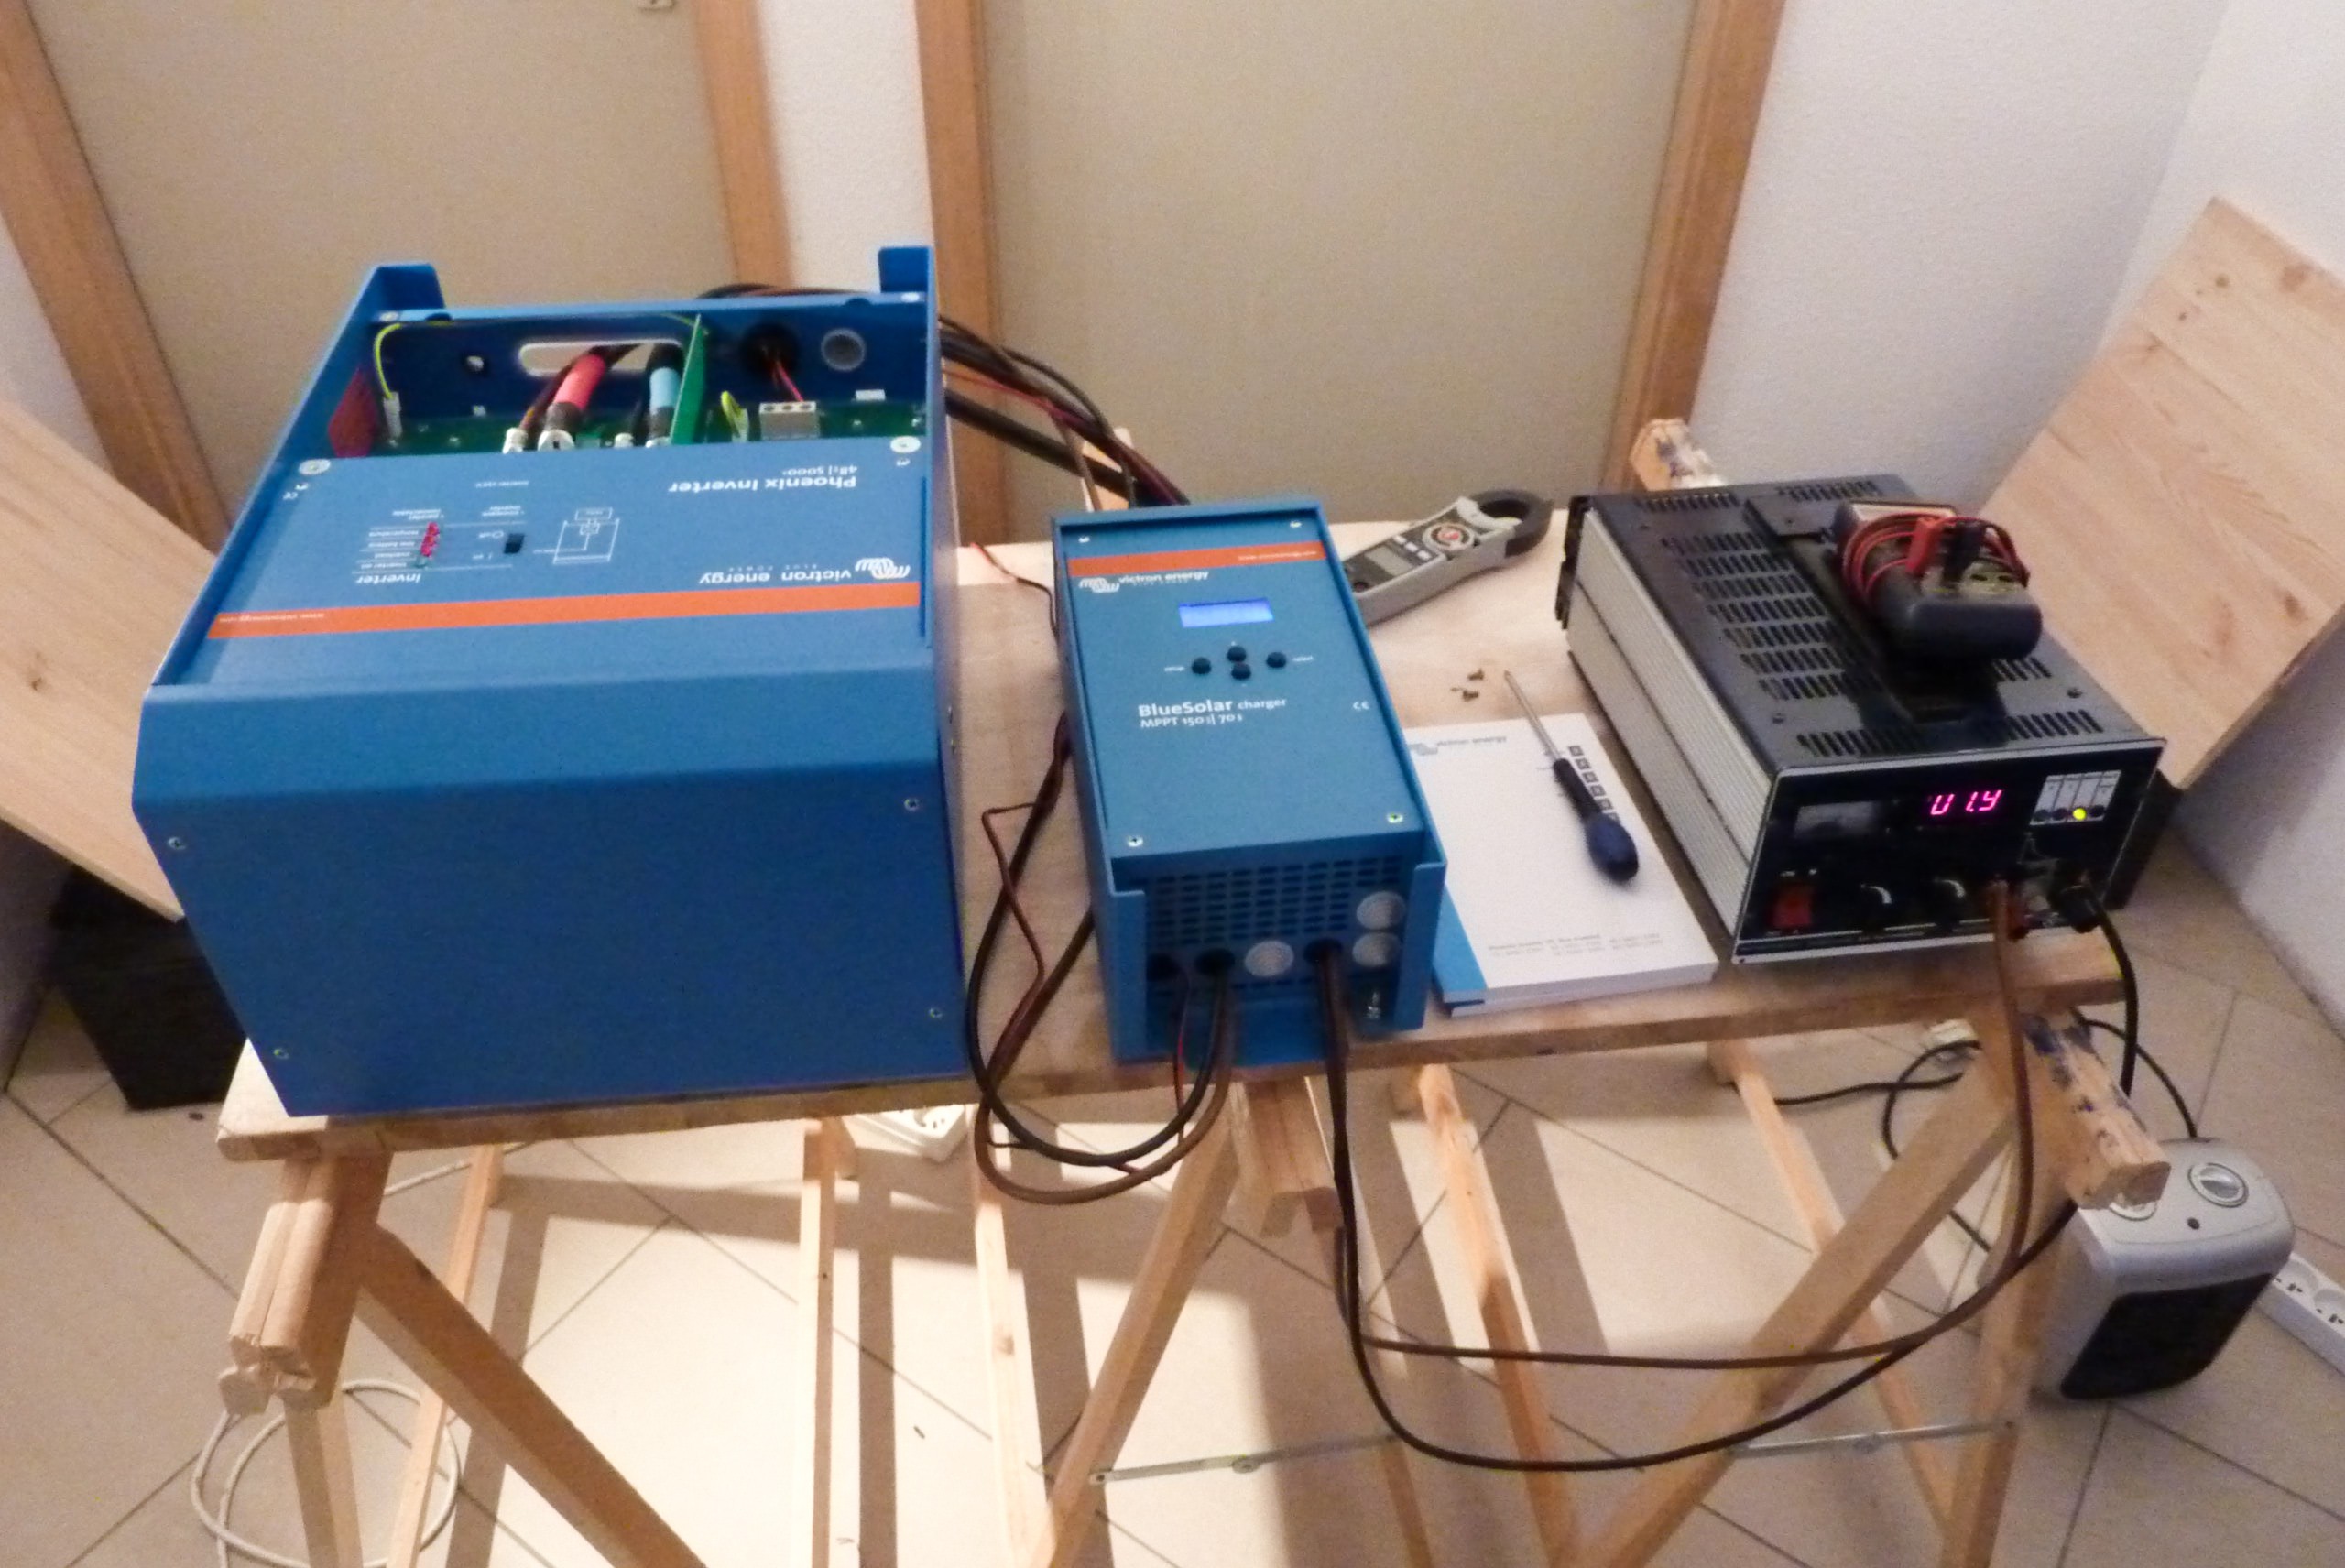
June 15th, 2013: Lab tests with the batteries
During these tests I could evaluate the future
yield of the system.![]()
The batteries are "draft" wired.
![]()
June 14th, 2013: Solar Charger and Inverter Delivery
The charger and the inverter are designed in Holland, manufactured in India and I have bought them in France.
![]()
-
My PV System Yield Review
08/15/2014 at 04:54 • 0 commentsProduction review between mid March 2014 and mid July 2015 (16 months)
Solar production: 4075 KWh
Grid consumption: 1954 KWhAutonomy ratio = 4075 / (4075 + 1954) = 68 %
This is less than my target of 80 % of autonomy.
Analysis:
The system had several failures during the first year. These failures had an adverse effect on the production. Nevertheless the autonomy figure is not so bad. My goal is to reach at least 75 % during the next year (July 2015 to July 2016).
Improvements:
- Avoid failures and minimize PV system down time ;-)
- Value the electrical power surpluses thanks to Photovoltaic hot water production
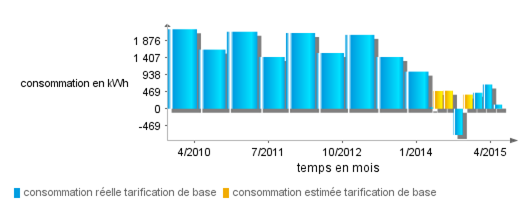
The following chart, captured on my Electricity provider's website shows a strange "negative consumption", due to over estimated consumptions (yellow bars) :
![]()
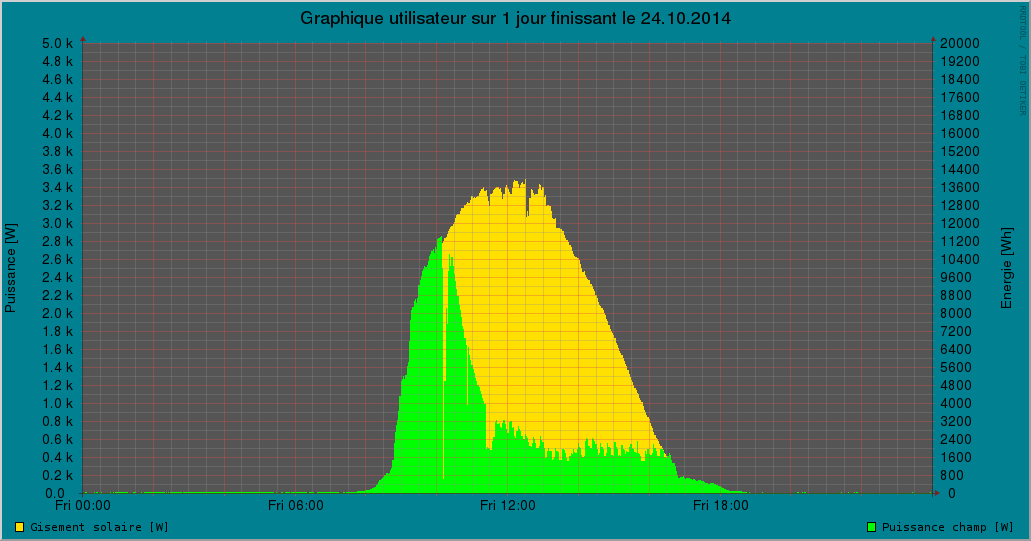
Autumn Sun
Yesterday ( October 25), the weather was fine. The system produced 7500 Wh (green area) while the available power (yellow surface behind the green area) was at least of 22 000 Wh.
![]()
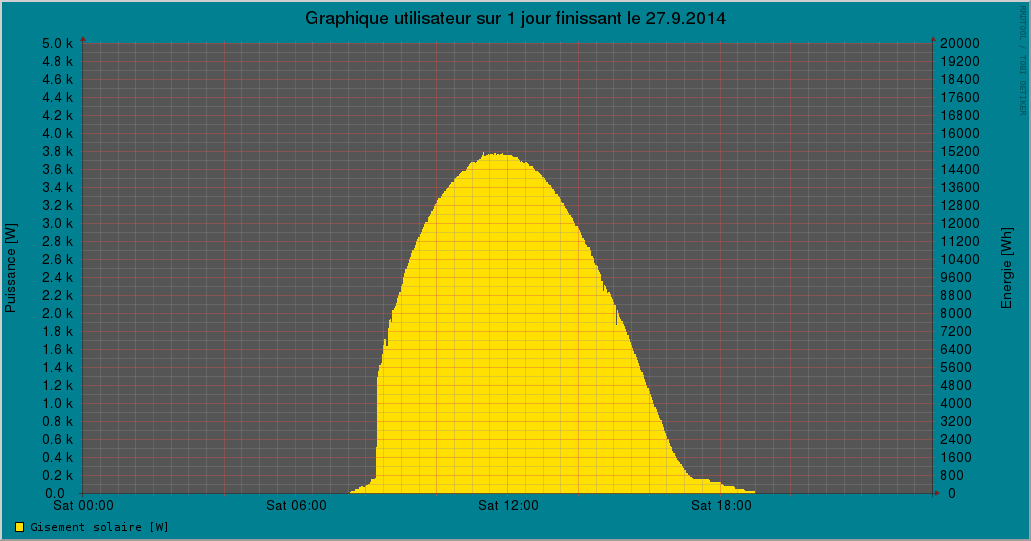
Natural Perfection
The envelope of the yellow area depicts exactly the path of the sun in the sky. On the left side of the curve the abrupt start is due to buildings creating a mask towards the East. The trailing part on the right side is due to a light colored building reflecting light towards my roof in the evening. At noon, the available power was close to 3800 Watts.
![]()
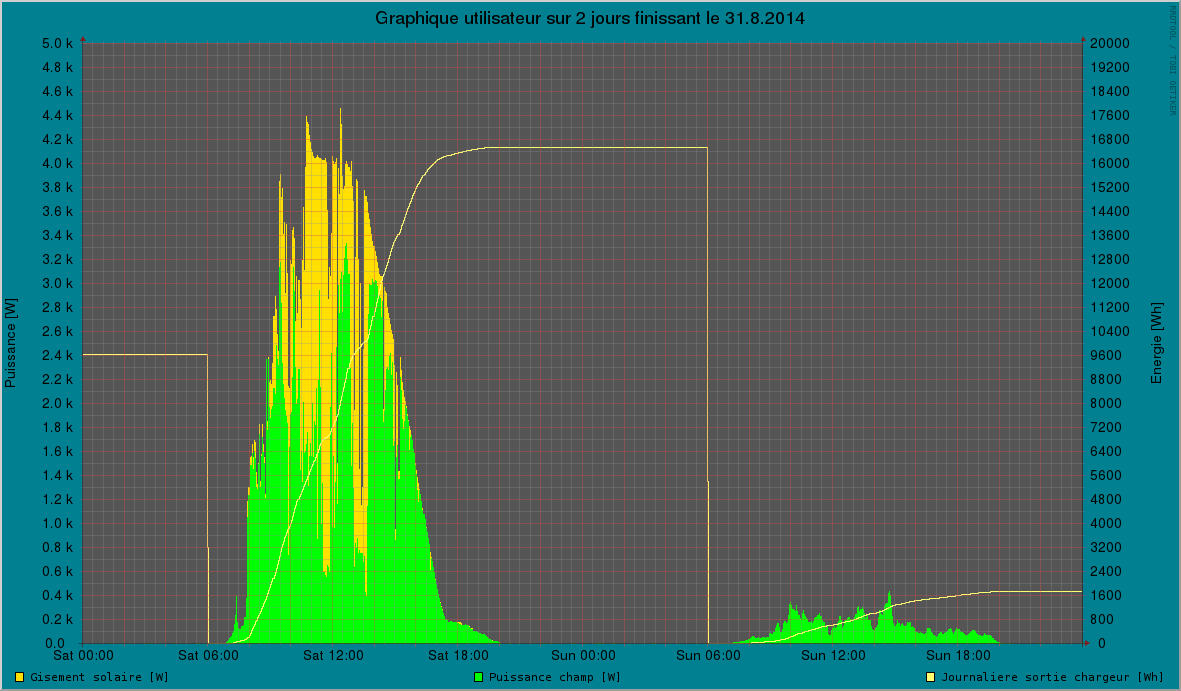
The best day and the worst day
This screenshot shows the productions of the of best and the worst day of the year until the 31st August.
On Saturday, 30th August, MyPV system produced more than 16 KWh (top of the highest yellow line in the middle of the chart).
On Sunday, 31st August, MyPV system produced about 1.6 KWh (top of lowest the yellow line on the bottom right).To be autonomous, I need at least 10 KWh of solar energy each day.
The yellow/green areas show the sun's power evolution during these 2 days.
This illustrates the intermittent aspect of the photo voltaic production.
![]()
Production by end of August 2014
This morning (1st September) , the counters indicate a production of 2010 KWh. This figure is in line with my forecast.
Production review between March and mid August 2014
MyPV Electricity production has really started by the end of January 2014.
Between March, 17th 2014 and August, 18th 2014, the counters indicate following figures :
Solar production: 1471 KWh
Grid consumption: 214 KWh
Total consumption: 1685 KWhAverage monthly consumption: 1685/5 = 337 KWh
Average daily consumption: 1685/154 = 11 KWhAutonomy ratio: 1471/1685 = 87 %
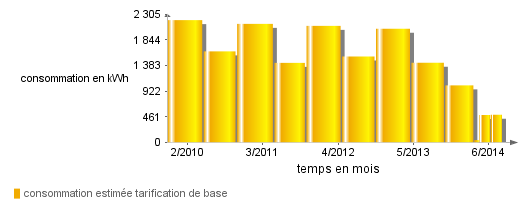
The following chart, captured on my Electricity provider's website shows a dramatic decrease of Grid electricity consumption :
NOTE: the last column is an estimated figure - The real figure is far less than displayed.
![]()
My Off-grid Solar System Monitoring
How I did to remotely control and monitor my home made Off-grid Photo voltaic System