Now that the treadmill is working and can be controlled from my PC, there is one more feature I need, logging how long I use my treadmill everyday and what distance I walk.
This feature requires modifications both on the Arduino and python code:
- The Arduino should give more information about the status of the treadmill, running or not, and about its speed.
- The Python script should store the time and the speed when the treadmill starts and log everything in a file when it stops.
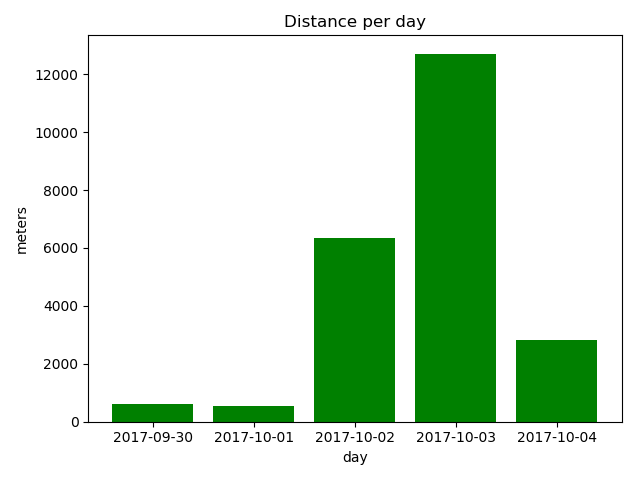
- A new script should draw a bar chart of the data
Let's not reinvent the wheel and use CSV to store our data. But wait, there is one problem: in what format will we store the date?
I was going to store it in the European format, dd/mm/yy, but what if an American user (imaginary user of course, I'm not sure anybody else than me will use this) wants to import the data in LibreOffice or Excel?
Well, according to Stack Overflow, it looks like there is an unambiguous format that works with every locale : yyyy-mm-dd
So even if it doesn't matter for this project, I learned a useful trick next time I need to deal with both sides of the Atlantic.
Here is a line of my CSV file:
#   date   ,hours,minutes,seconds,distance, duration,calories
2017-10-04, 10  ,   44  ,   42  ,  1845  ,    23   ,  53
Now to draw the chart, I had a look at the web based solutions, but for now I think I'll stick with Python, I don't want to use JS for this project. So here is what it looks like with matplotlib

I could just bind a key to generate this graph and display it with eog, but I'd rather serve it through a web page, so I think it will be the next step.
 PixJuan
Discussions
Become a Hackaday.io Member
Create an account to leave a comment. Already have an account? Log In.