Introduction
Many people have dogs, yet the average dog owner does not have a wide enough knowledge base regarding dog training to really know if their dog is well trained. When taking a dog for a walk it is hard to know if the dog is being obedient because no one really knows what force pulls resonate as disobedience and which ones still lie in the range of good behavior. What are the acceptable forces a dog can pull when going for a walk?
The purpose of this experiment was to find a standard for compliance that can be used as a point of comparison while walking a dog. The standard can be used to tell when a dog is being obedient, and how well they are doing in their training. In order to find the acceptable force exerted by the dog, it was necessary to find a way to constantly measure the force of the dog’s pulls during a walk and a way to record this data.
In order to solve this problem, I built a strain gauge leash. The leash consists of a strain gauge (a device for indicating the strain of a material or structure) attached to a microcontroller (a computer present in a single integrated circuit) able to measure and record the force of a dog’s pulls. One side of the strain gauge is attached to a wooden block, while the other side is attached to the leash. The strain gauge is attached to the leash in a way in which when the dog pulls, the leash will pull down on that side of the strain gauge at the same angle each time. The magnitude of the bends in the metal of the strain gauge are sent back to the microcontroller which records and stores the data during the walk. The microcontroller takes and records the tension readings from the strain gauge every 181 milliseconds (5.5 times a second).
The leash allows a way in which to record and analyze the data regarding the force exerted by the dog in order to find what obedience looks like. In order to attach a number or graph to obedience multiple trials with different dog walkers are necessary.
There are numerous applications of the strain gauge leash that can be used by dog trainers, families, obedience classes, etc. The leash can be used by a multitude of people that are looking to train their dog or to see where their dog is at training wise. For instance, it could be used when training service dogs or police dogs because these dogs have to be the epitome of obedience since lives depend on their abilities to follow directions and listen. Another application of the leash is within a family to set the expectations of how a dog should behave with each person. The technology can be used to show how a dog acts differently with different people, or different family members. Additionally, the strain gauge leash can act as a teacher by showing the person walking the dog that they are either doing it correctly or need improvement; it allows the person to see what a good walk looks like on a graph and allows them to track their progress towards that goal.
Right now, the level of obedience is measured by the trainer and is subjective to human bias and opinion. It would be very beneficial to have a more standard way of telling if a dog is obedient on a leash. In addition, those that own dogs and are not experienced dog trainers have no idea what obedience really looks like, so they may be thinking they have a dog that is good, when in reality that is not true. In fact, many people allow their dogs to walk in front of them while walking, basically, allowing their dogs to walk them by pulling them along; when, on a good walk there should be very little force exerted between the dog and the dog walker.
Method
Participants
Three participants participated in this experiment by walking the dog, Daisy, with the strain gauge leash. Daisy is a four year old golden retriever mix with moderate training. Participant 1, Michael, is Daisy’s primary trainer who has had a lot of experience training dogs. Participant 2, me, has some experience walking Daisy and training her, but only on occasion. Participant 3, Matthew, has minimal experience with walking dogs and training them.
Procedure
For this experiment, I had the participant walk the dog using the strain gauge leash. They would walk the dog at various times throughout the day, for a few weeks. If the participant felt the dog pulling an unreasonable amount they would press a button on the microcontroller which would later be seen when analyzing the data. I repeated the same experiment with three different people.
In order to standardize the experiment as much as possible, I implemented some rules for the people walking the dog. First of all, it was important to keep a continuous pace while walking the dog because of some variance in tension, created by the apparatus, that would change based on how fast the pace was. And, with sudden changes in pace, some of the tension on the rope would be human fault and not that of the dog, which would ultimately alter the results if not checked. In addition, it was necessary for everyone to hold the leash in the same manner in case that would have an effect on the data.
It was necessary to have a control in which to compare the data from walking the dog. The control in this experiment was essentially going on a walk with the leash and dog, without the dog. Basically, the participant walked on a treadmill with the leash was attached to a pole at the same level the dog would be at, while performing the same arm motions one would make while walking the dog. This allowed me to see the tension on the leash generated by the apparatus and the walking motion or hand motions itself. Furthermore, while comparing the control to another set of data, we could distinguish what tension was just noise from the leash and the person, and what was from the dog pulling.
Furthermore, to make the results span a broader spectrum, I made sure to do a few more tasks. First, there were a few different routes in which we walked the dog. The routes used were chosen at random, so the dog was not walking the exact same pattern each time. And, data was collected from every time throughout the day: morning, afternoon, and night.
Predictions
Before performing the experiment, I expected the dog, Daisy, to behave differently with each person that walked her. With the first participant, I expected Daisy to be very obedient and to pull on the leash the least. This is because Participant 1 is training Daisy on a regular basis and walking her, so she has already been trained to listen to him. For the second participant, I expected Daisy to be semi-obedient because I only walk and train her on occasion. And, for the third participant, I expected Daisy to be fairly disobedient because his experience with dogs is very limited. I predict the maximum acceptable force would be just below the the threshold of hurting either the dog or the person walking the dog.
Results
Similar to what I had expected, the dog was most obedient with Participant 1, moderately obedient with me, and quite disobedient with Matthew. When the dog walked with Michael, the dog behaved really nicely, and I was able to get a baseline for what an experienced dog trainer thought was good behavior versus bad behavior. In order to view the results, I put the tensions for each walk on a tension versus time graph and a spectrogram, to show the time and frequencies of the forces recorded. On the tension versus time graphs, the tension on the leash is recorded in blue, while the period of reference (which is reset by the walker by pushing the button when they feel an unacceptable pull) is shown in green. And, the non-compliance factor, shown as a green star on the graph, is recorded every time the force exceeds what is deemed acceptable. The non-compliance factor allows for the calculation of the non-compliance rate, which is the number of times the force exceeded what was acceptable divided by the duration of the walk. Basically, the higher the non-compliance rate is, the less obedient the dog was during that walk, and vice versa.
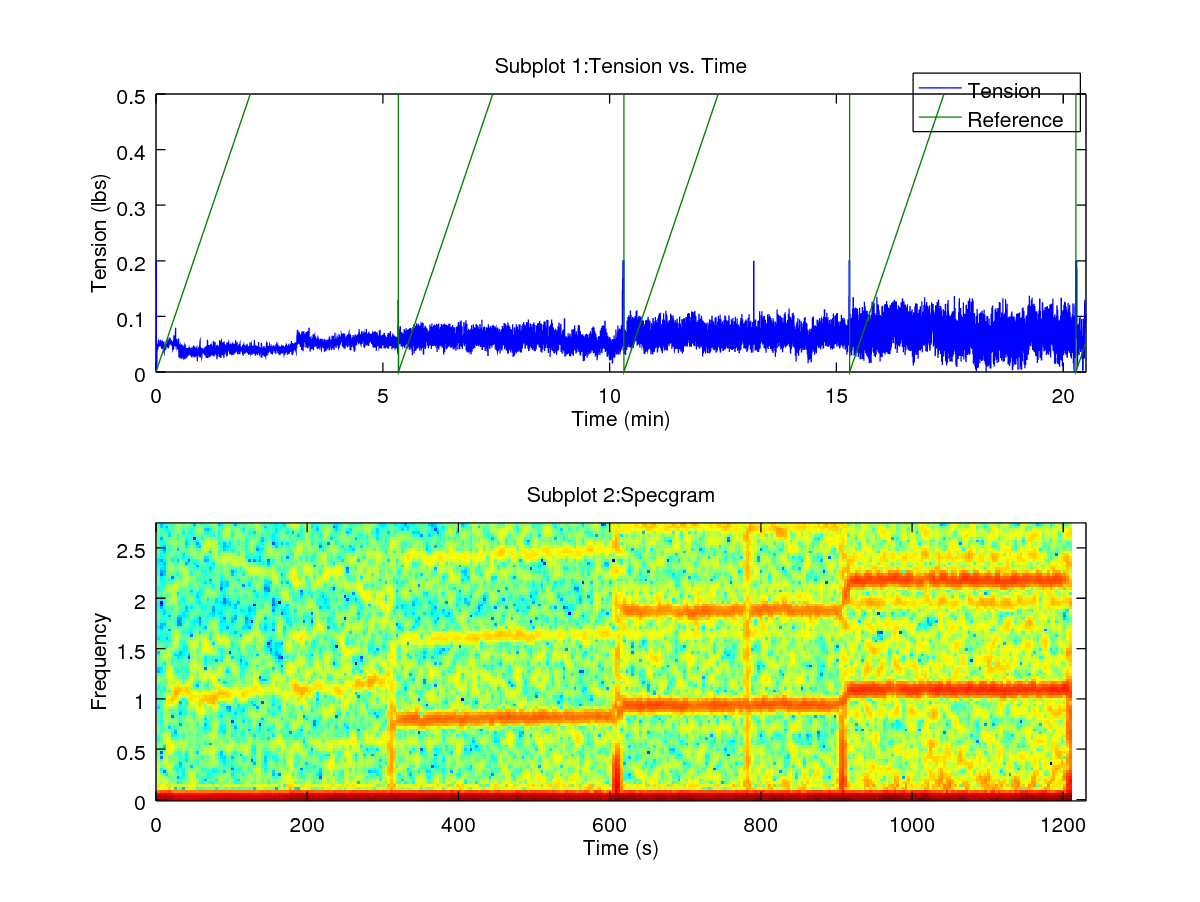
Figure 3. Control.
The data received from the control, walking on the treadmill without the dog, showed how much tension is caused by the just the apparatus. The participant walked on the treadmill for five minutes at one mile per hour, five minutes at two miles per hour, five minutes at three miles per hour, and five minutes at four miles per hour. The average tension stayed roughly the same for each speed. However, by looking at the graph we are able to see that the faster one walks, the greater the standard deviation for the average tension.
In addition, the non-compliance rate was zero since there was no dog pulling. In addition, you can look at the spectrogram and see lines that represent the frequency of motion that was going on during the walks. The primary and harmonic frequencies associated with walking and swinging one’s hand back and forth can be seen on the spectrogram as trend lines. As one walks faster, the primary and harmonic frequencies move higher up and when one walks slower, they will be lower down. Furthermore, with this knowledge, the data can be used to predict the pace, or rate of steps, that are being taken by an individual when they are walking their dog. More importantly, if one is walking at a consistent pace and the dog is not pulling, trend lines will be apparent in the spectrogram for that walk.
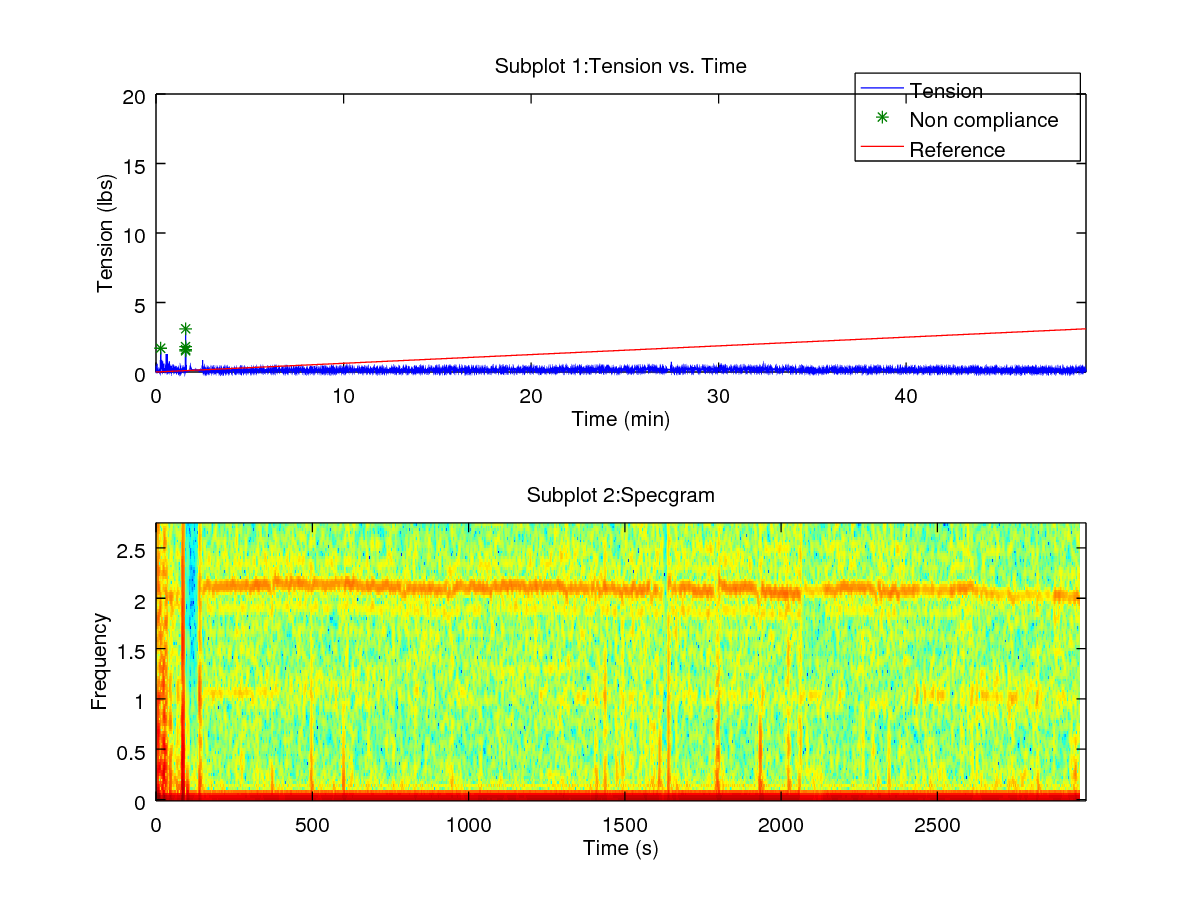
Figure 4. Participant 1 on 2017-04-08.
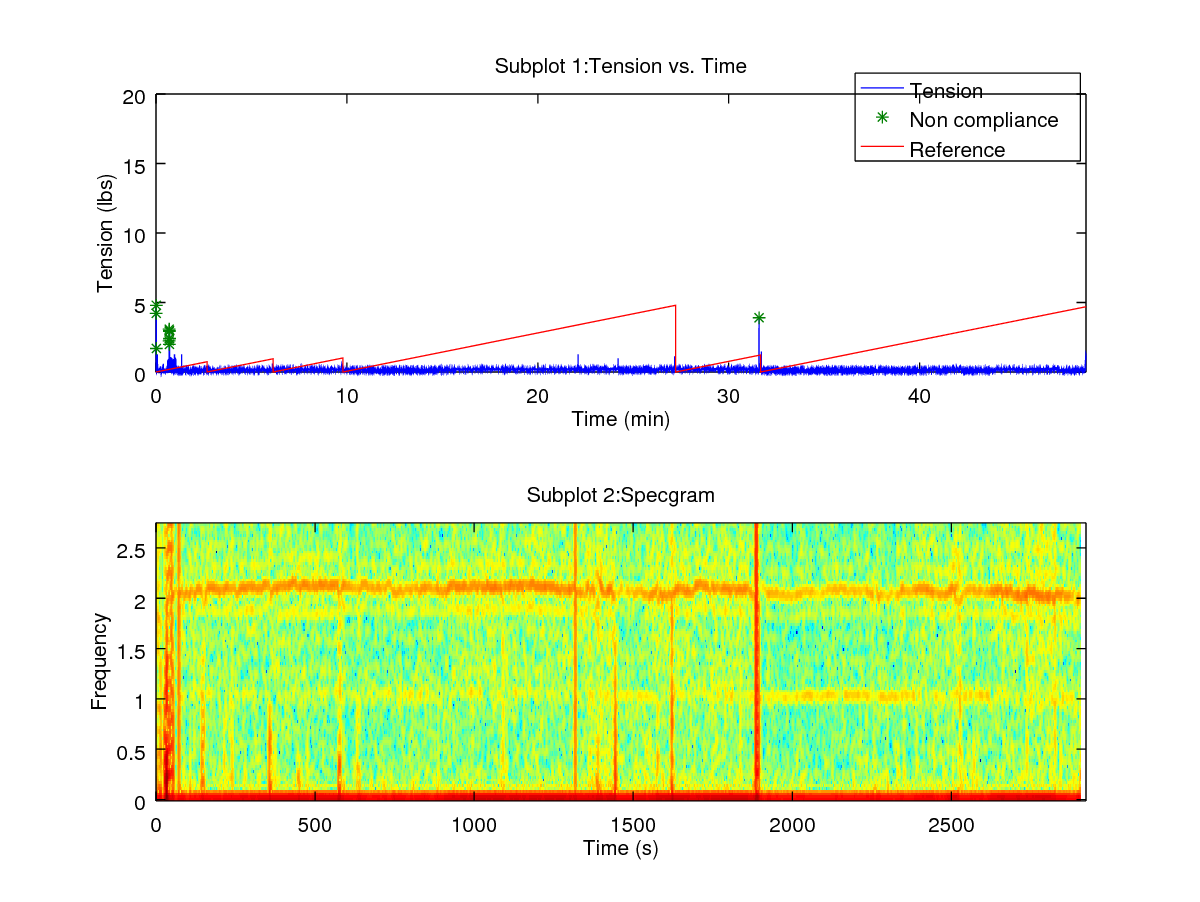
Figure 5. Participant 1 on 2017-04-09.
To start off, the first participant is Daisy’s primary caretaker who has trained her and walks with her on a daily basis. The data received is in line with what one would expect when a well trained dog is walking with the person that trained the dog. In fact, the data from Participant 1 was not far off from the control because Daisy pulled very little, if any, throughout the walk. A clear line can be seen across the spectrogram showing the frequencies of the walking motions. And, the vertical lines shown from when the dog pulled unexpectedly. During Participant 1’s walk, Daisy only pulled a few times and never over five pounds.
On the April 8th walk (e.g. figure 4), the weights of Daisy’s pulls are (0.16 ± 0.06) lbs with the largest pull being 3.11 lbs. And, on the April 9th walk (e.g. figure 5), the weights of Daisy’s pulls are (0.16 ± 0.1) lbs with the largest pull being 4.8 lbs. For the majority of both of the walks, tension remained below 0.5 lbs which may be partly due to the weight of the apparatus and walking motion; for the control at three miles per hour, the tension on the leash was (0.06 ± 0.02) lbs which is a large enough percent of the force of Daisy’s pulls to make a difference. Also, there was a non-compliance rate of 0.00 for both of these walks, the same rate as the controls where no dog was present.
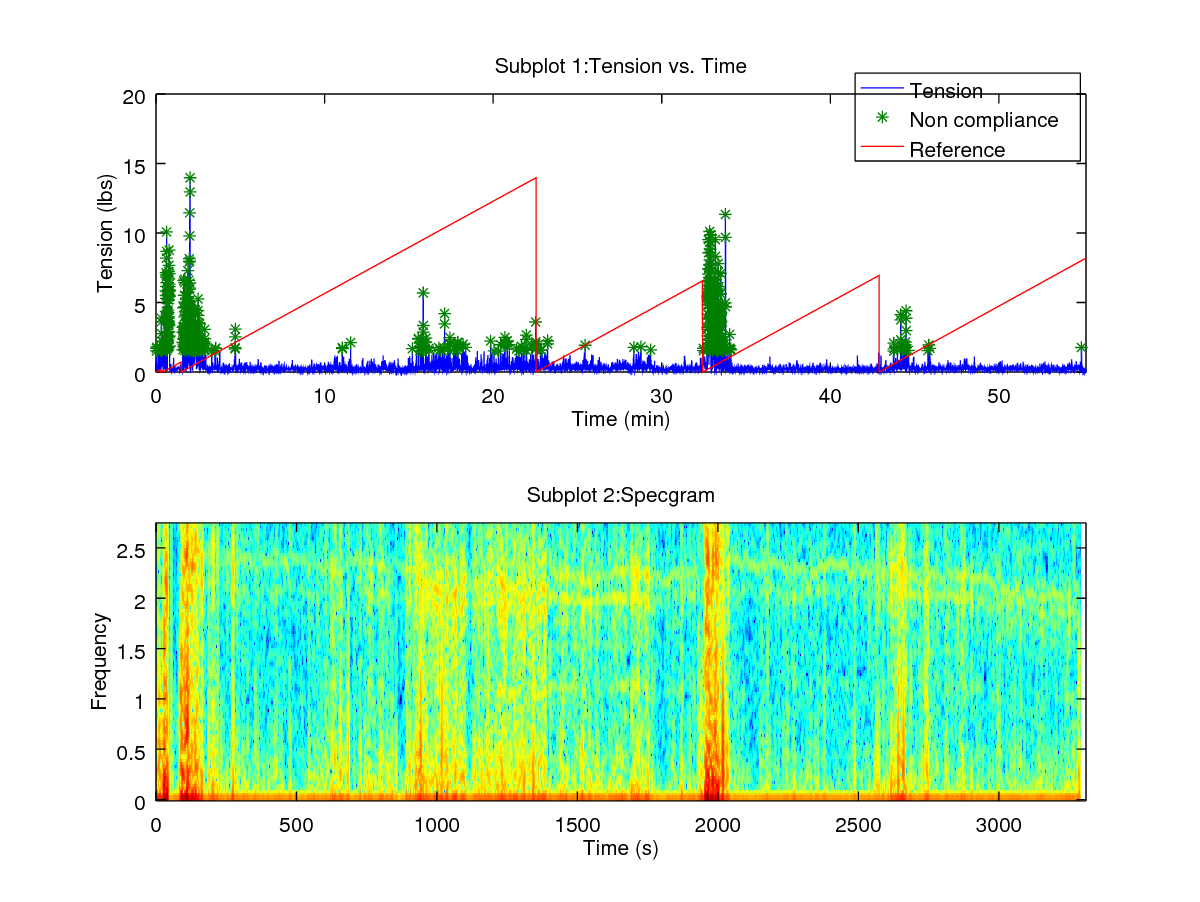
Figure 6. Participant 2 on 2017-04-07.
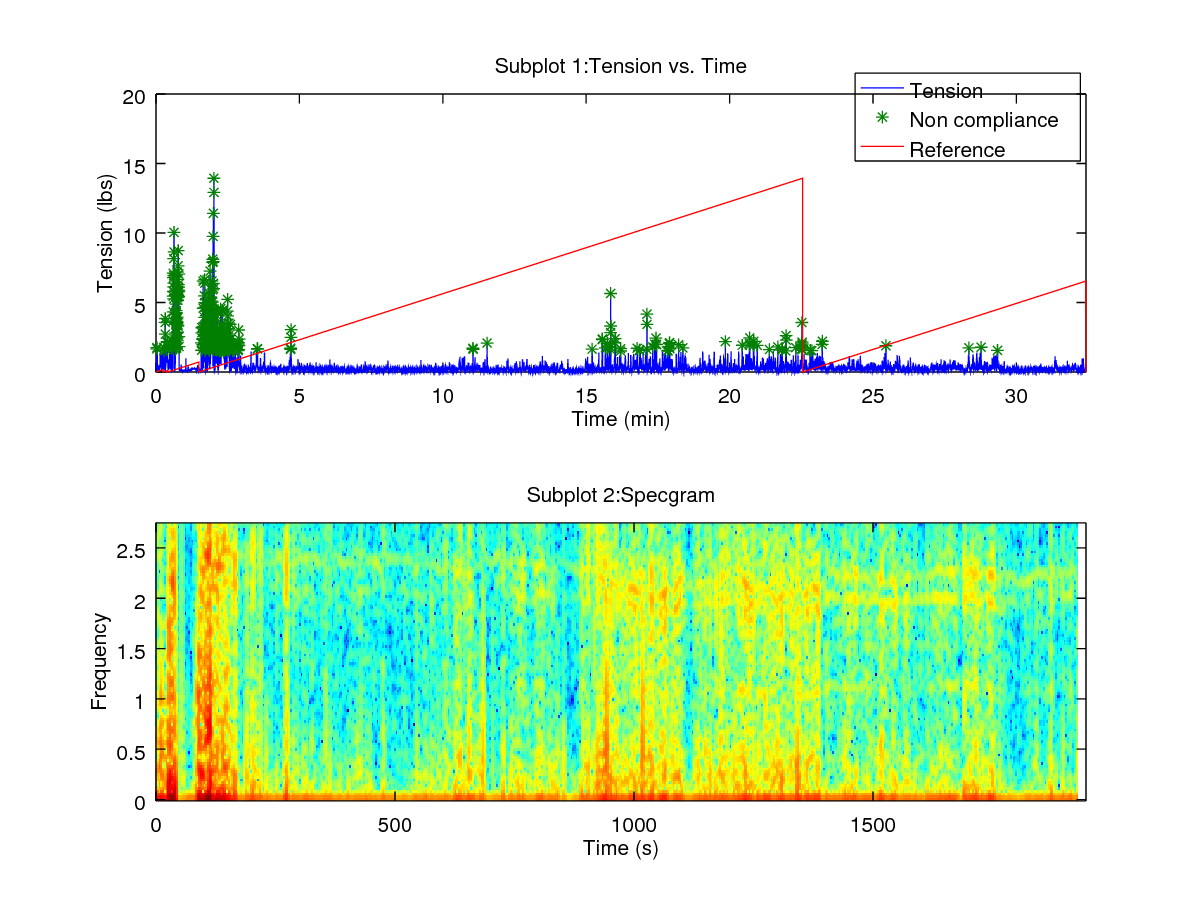
Figure 7. Participant 2 on 2017-04-10.
To continue, with Participant 2, the dog is walking with someone that only walks the dog on occasion, not very often in general. Daisy is most likely taking advantage of the situation and not being as compliant because she knows that she can get away with it. What can be seen when looking at the graphs is that Daisy is pulling harder and much more often than when she pulled with Participant 1. Due to the multiple pulls and the inconsistent speed they caused, the trend lines are much less apparent in the spectrogram.
On the April 7th walk (e.g. figure 6), the weights of Daisy’s pulls are (0.38 ± 0.69) lbs with the largest pull being 13.98 lbs. And, on the April 10th walk (e.g. figure 7), the weights of Daisy’s pulls are (0.36 ± 0.64) lbs with the largest pull being 13.94 lbs. The non-compliance rate of both walks was 0.17; Daisy was pulling above the acceptable force 17 percent of the time. Compared to both the control and Participant 1’s walks the non-compliance rate is a lot greater, showing the dog is much more disobedient when walking with Participant 2.
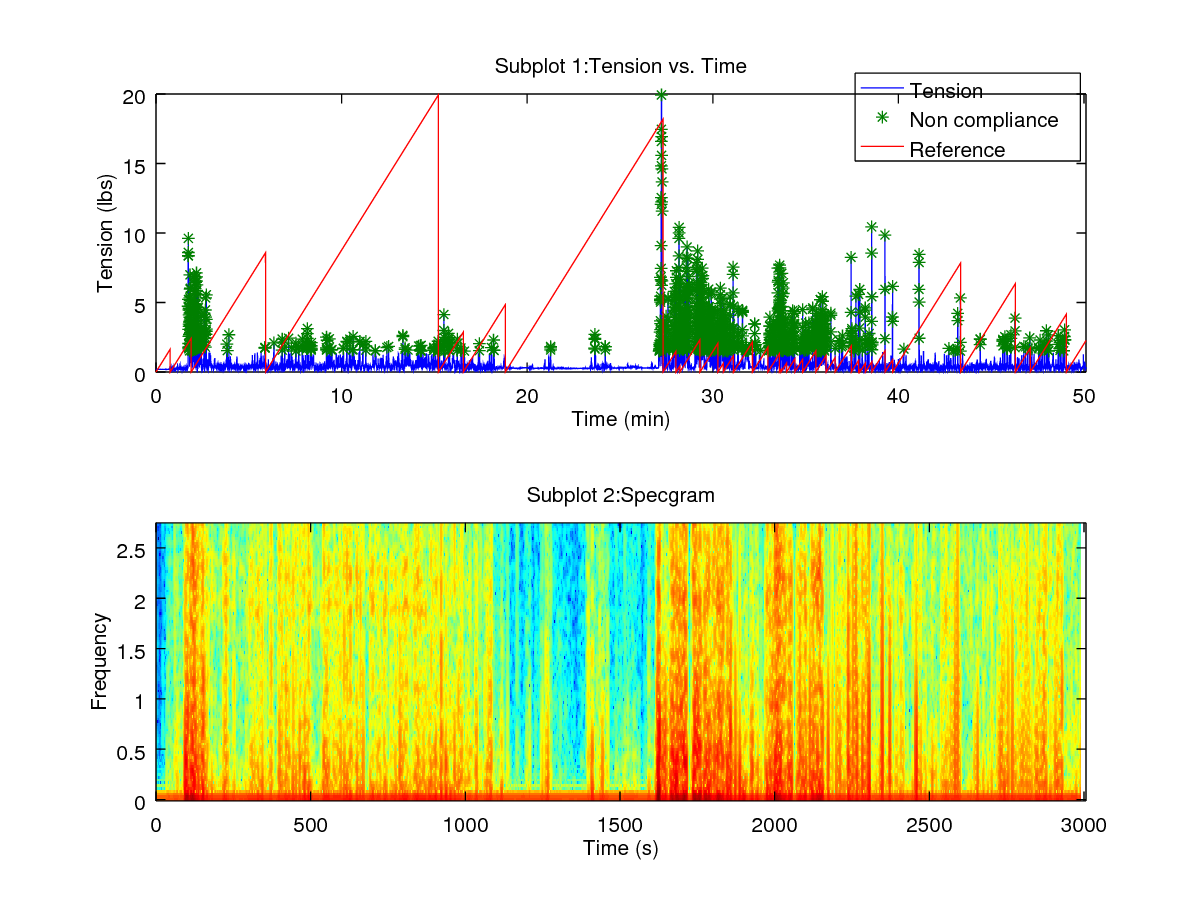
Figure 8. Participant 3 on 2017-04-07.
Furthermore, with Participant 3, the dog is constantly pulling, and being very disobedient. Participant 3 is someone who rarely walks Daisy and has had little to no experience training her. The dog is pulling more frequent and harder than she did with both Participant 1 and Participant 2. It looks almost as if Daisy sees herself as walking Participant 3 and believes she does not have to listen to him. Looking at the spectrogram, none of the trend lines can be seen due to the constant pulls and the inconsistency in pace due to these pulls.
On the April 7th walk (e.g. figure 8), the weights of Daisy’s pulls are (0.62 ± 0.94) lbs with the largest pull being 19.93 lbs. The non-compliance rate 0.42; the dog was pulling above the acceptable force 42 percent of the time. This fact can be seen by also looking at the vertical lines going on the spectrogram. This is much larger than the non-compliance rates both participant 1 and participant 2 got for their walks.
Discussion
From looking at the data, it is clear that Daisy behaves like a completely different dog with each person that walks her. Though, when looking at just the data for an individual, the dog remains fairly consistent. This shows the more an individual trains a dog, the better they will behave with that individual, and not necessarily anyone else.
The data from Participant 1 acts could as a point of comparison when walking the dog because it shows data from when the dog is being very obedient, also, it is closely related to the control. On the good walks, Daisy’s pulls generally remained below a pound with the maximum pulls being below five pounds. Yet, in some cases when Participant 1 walked the dog the maximum pull went up to around 20 pounds.
|
Participant |
Date |
Mean (lbs) |
Std (± lbs) |
Median (lbs) |
Max (lbs) |
Ncompliance |
|
1 |
2017-04-08 |
0.16 |
0.06 |
0.15 |
3.11 |
0.00 |
|
1 |
2017-04-09 |
0.16 |
0.10 |
0.15 |
4.80 |
0.00 |
|
1 |
2017-04-07 |
0.21 |
0.37 |
0.18 |
21.80 |
0.02 |
|
1 |
2017-04-06 |
0.21 |
0.33 |
0.18 |
18.56 |
0.02 |
|
1 |
2017-04-05 |
0.21 |
0.30 |
0.18 |
12.69 |
0.03 |
|
2 |
2017-04-22 |
0.20 |
0.38 |
0.15 |
11.51 |
0.08 |
|
2 |
2017-04-15 |
0.30 |
0.51 |
0.21 |
14.64 |
0.13 |
|
2 |
2017-04-10 |
0.36 |
0.64 |
0.20 |
13.94 |
0.17 |
|
2 |
2017-04-07 |
0.38 |
0.69 |
0.23 |
13.98 |
0.17 |
|
3 |
2017-04-07 |
0.62 |
0.94 |
0.33 |
19.93 |
0.42 |
Figure 9. Data Sample.
Furthermore, by looking at the data for multiple walks, it is clear that the maximum pull has little correlation to how obedient the dog was throughout the walk. When sorting the data by maximum pull it does not accurately portray how compliant the dog was. For instance, Participant 1’s walk on 2017-04-07 had a maximum force of 21.80 lbs, yet the non-compliance rate was 0.02. While, on Participant 2’s walk on 2017-04-10 there was a maximum force of 13.94 with a non-compliance rate of 0.17. Clearly, Daisy was more compliant on 2017-04-07 with Participant 1 even though her maximum pull was 7.86 lbs greater than her walk with Participant 2. The non compliance rate, mean, or standard deviation are better at showing how obedient the dog was throughout the walk. Sorting by either one would present the data in the same order.
From looking at when each participant pushed the button to note an unreasonable force, it is clear that each person had a different definition for what they deem unreasonable. When Participant 1 pushed the button they pushed it when the force was generally less than 5 lbs. Participant 2 pushed the button when the force was above 5 lbs. And, Participant 3 pushed the button when the force was generally between 5 lbs and 15 lbs. This shows that the definition of what one deems reasonable changes based on how hard and how much the dog pulls on average. Both Participant 2 and Participant 3 had an incorrect view of what they believed to be disobedient based on the fact that they had never walked with an obedient dog before. Thus, they would not be able to correctly train the dog without the knowledge gained from using the leash.
From looking at the data from Participant 1’s walk it is clear that an obedient dog’s maximum pulls should not exceed two or three pounds; and, they should be less than half a pound on average. Basically, the average force that the dog is pulling should not be able to be felt throughout the walk. This is different from my original hypothesis where I predicted that the maximum acceptable force would be just below the threshold of hurting either the dog or the person. A trained dog should be only “barely” pulling throughout the walk; the force should be at an absolute minimum.
The largest problem with this technology at this point is that it can only be analyzed after the walk had occurred. In order to improve this technology, analysis of the data would have to happen in real time and there would have to be a way to notify the walker or allow them to view the data with some sort of visual representation; for example, an application for one’s phone. This would allow the trainer to take account as to how hard the dog is pulling on the walk and know when the dog is starting to act more disobedient than average.
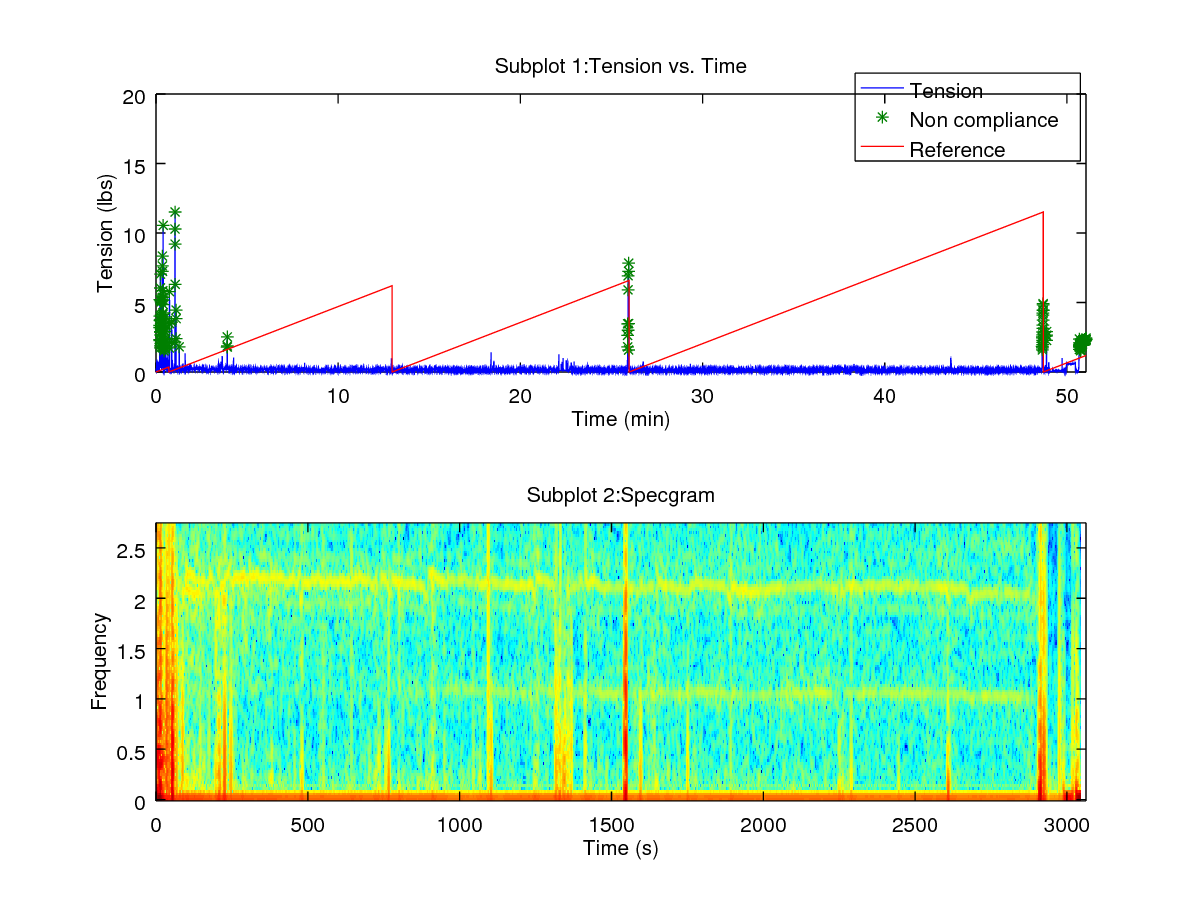
Figure 10. Participant 2 on 2017-04-22.
I
was able to test the application of the leash to see if it would work
as a training tool. By viewing the data, and knowing what obedience
from Daisy looks like, I was able to adjust the way I walk in hopes
of improving her obedience with me. I was able to work with my dad
and get some tips on walking the dog in order to have a more
enjoyable walk with less pulling. Looking at this graph, it is clear
to see that Daisy’s compliance when walking with me improved
greatly by use of the leash and analyzing the collected data. In
comparison to when I first started the experiment, the weight of her
pulls decreased from (0.38 ± 0.69) lbs to (0.2 ± 0.38) lbs. And,
the non-compliance rate went from 0.17 to 0.08.
In conclusion, the maximum acceptable force of a dog’s pull to fall in the range of obedience is no more than two or three pounds. Once again, this weight is far less than I had originally hypothesized; the weight of a dog’s pulls should be a lot less than the force that it would take to cause any harm to either the walker or the dog. Also, I was not only able to come up with a profile of what good behavior for the dog is, but was also able to determine that the dog acts differently with different people. With this technology, not only can I use it to identify good and bad behavior to aid in training, but you can use it to set the expectations for the dog across multiple family members or groups. The strain gauge leash provides a beneficial tool for training dogs and representing what good behavior looks like on a graph.