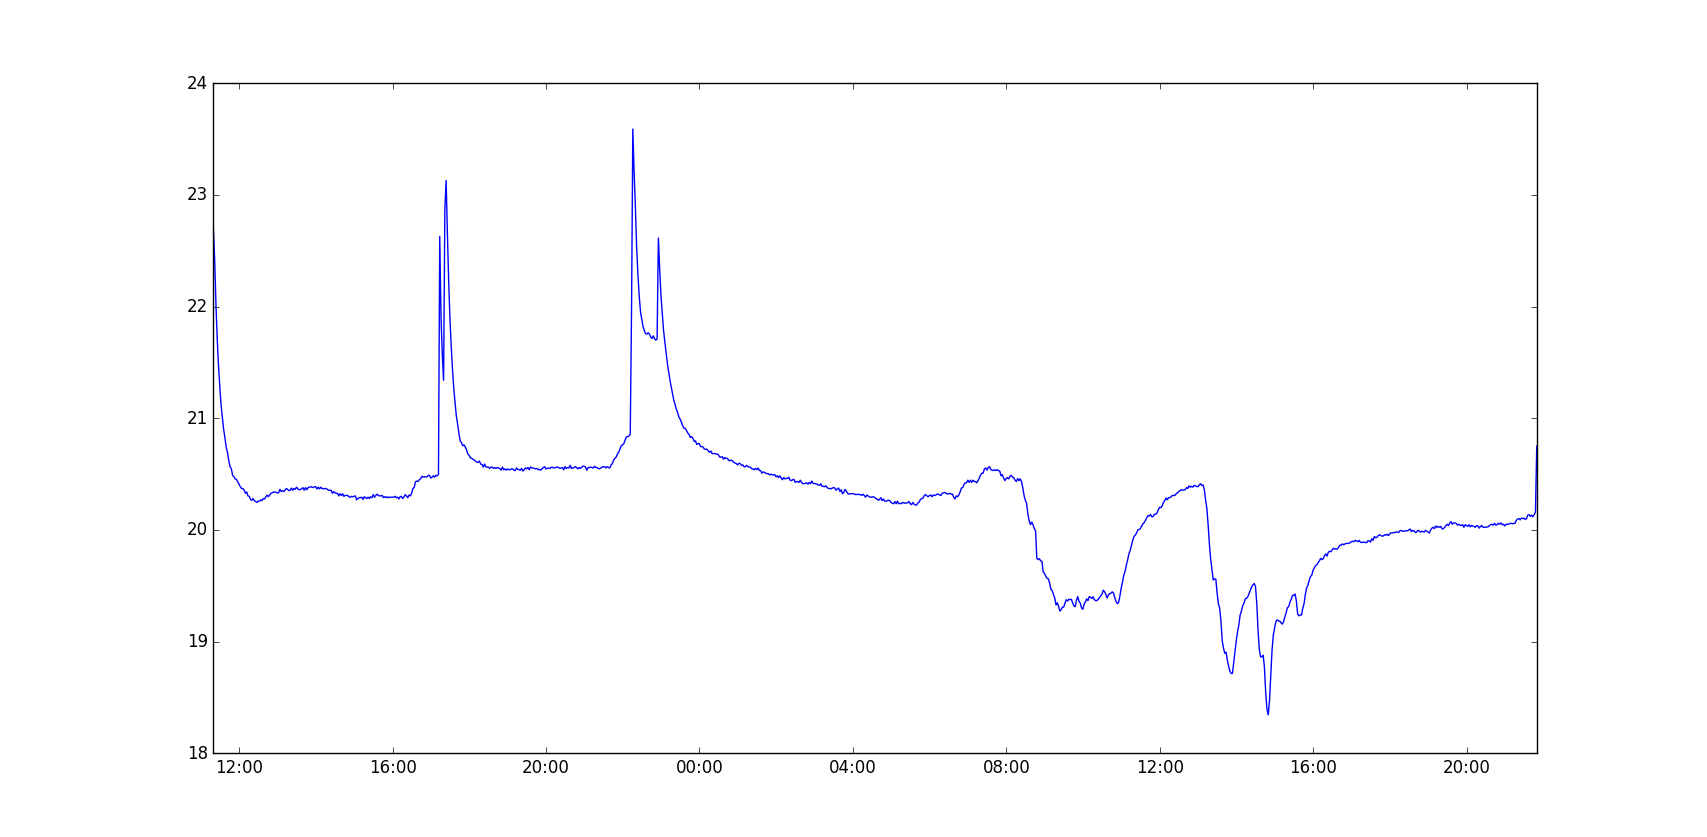
Here is the first day-long plus temperature log. X axis is clock time (UTC) and Y axis is temperature in °C. The spikes on the left are from holding the logger and the drops on the right are from opening the window.
The data are extracted via uart by a python script and the plot is made by another python script, so it's all python on the desktop and all of these are/will be on the project's Github. Input, advice, feature requests from anyone with temperature logger experience or not are welcome!
I've placed the logger outside and will publish another plot around the end of next week.
I'll probably be working on this project for another year or so - this is just an early taste.
 Nikos
Nikos
Discussions
Become a Hackaday.io Member
Create an account to leave a comment. Already have an account? Log In.