 David H Haffner Sr
Excerpt from: “A Homemade Cost Effective Raman Spectrometer with High Performance”
Journal of Laboratory Chemical Education
2015; 3(4): 67-75
doi:10.5923/j.jlce.20150304.02
Author’s: Eduardo H. Montoya R.1, 2, Aurelio Arbildo L.3, Oscar R. Baltuano E.2, 4
“Beside this, it has to be noted that spectral resolution is not constant along the entire spectrum, being progressively worse towards the left and right sides of the focusing point. This undesired effect is connected with the fact of that it was not possible to keep the whole spectrum well focused.”
“The light travels through a 1.5 meters fused silica fiber optic with 200 micron working diameter, which illuminates a flat mirror. The light is reflected onto a 50 mm by 50 mm reflective holographic grating (1200 grooves/mm).”
“The sample is illuminated with the doubly filtered light of a bright inexpensive green laser pointer, with a nominal power indicated as “< 100 mW”.
In this presentation I want to focus on the 4 most prominent mistakes in this research paper that prevented the authors from resolving several Raman peaks and why. They are highlighted in Italics.
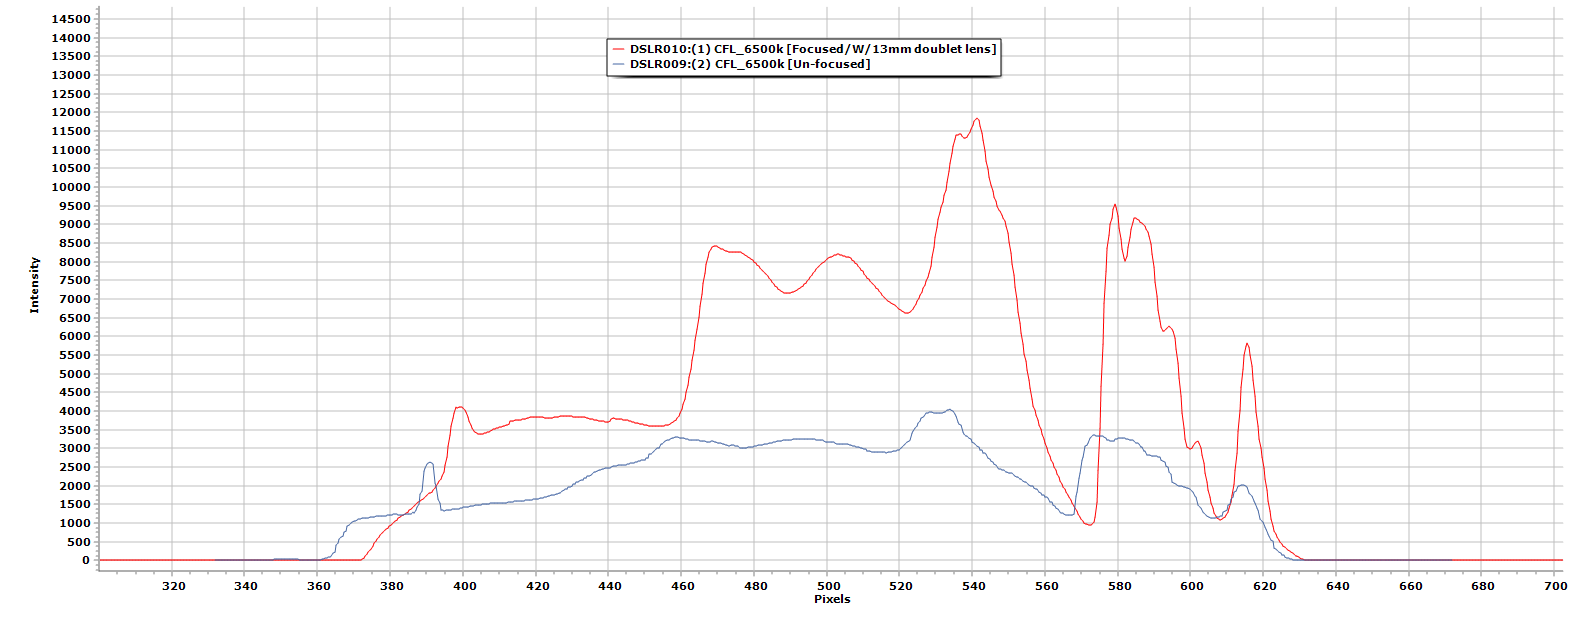
- The first is their spectral focusing problem, in figure 1 I show two spectral images of my CFL lamp (6500K,) the red plot shows sharp focused peaks and higher detail, while the blue plot is lacking in detail and has more subdued peaks. This was something either not covered in their presentation or just not bothered with.
- Two, they used a “flat mirror” as their reflective medium, big mistake, why? Because there is no way to collimate and focus the incoming light, using the flat mirror causes the image to spread in a linear fashion (un-focused and blurred.) So, when it gets to the diffraction grating half of the spectral image is lost and 40% is lost again because of the grating itself!
- Three, according to my research and experience, an 1800 mm/gr holographic grating works best for Raman spectroscopy under these circumstances and for the most part others as well. A 1200 mm/gr grating mainly resides in the UV/VIS range of the spectrum as far as spectral peak resolving is concerned.
- Four, and a very important factor I might add, is the type of laser used. Yes, one can use a laser pointer and it will work, the problem is, noise, yes lasers exhibit noise. So, the state they used a laser pointer of <100mW, but didn’t really state the exact value, I use an Aries 532nm 150mW Portable laser (DPSS/CW,) so it is of excellent quality.
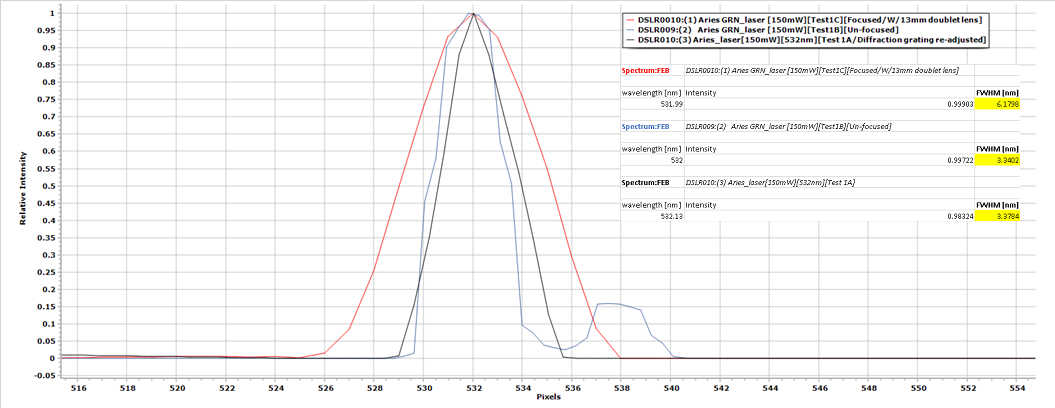
Now, in figure 2, I have three plots, using my Aries 150mW laser, 2 are focused and 1 is not. The focal lens I am using is the same one that I will be using in the rear fiber optic port (13mmachromatic coated doublet, F=50mm.) You can clearly see from looking at the blue plot (un-focused,) a very blurred and dirty image. The red, test1C is, focused, test 1A I had to re-align the diffraction grating.
This was all done with the proto type enclosure set up I constructed to simulate the actual Raman set up. I did this to ensure that I have all my focal distances correct and angles exact.
Another important point is the Focal distance of the entrance fiber port, which is 7.5mm, it is 47mm from the rear fiber port to the 1st mirror (centerline,) so, we calculate 7.5mm travel to the 13mm doublet lens, from the lens to the 1st mirror is 34mm, well within our focal range. the 1st mirror is our 50 x 6 x 50mm concave silver coated, with an F=100mm distance, so we are good there also, because distance between 1st mirror and diffraction grating centerline is 94mm.
I am presenting figure 3 because it represents all 3 laser scans as they appear without zooming in, its just an interesting note because often you cannot distinguish important details in spectra until you zoom in on their peaks or base.

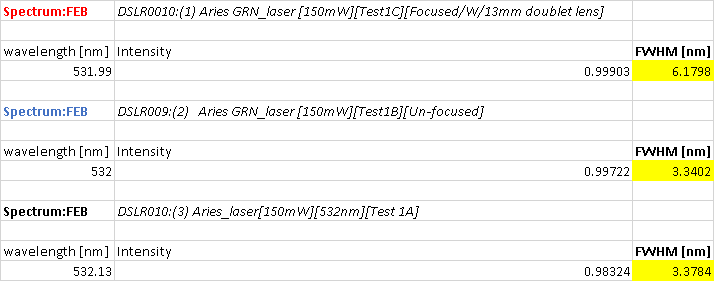
This is figure 4, the FWHM data for the laser scans:
In closing I want to point out also that, it is vitally important when presenting scientific papers, to include as much technical detail as needed, right or wrong when your peers review it, they won’t be left to wonder about how certain procedures were carried out or how did you arrive at a certain conclusion based on a technical aspect contained in your presentation or drawings.
Attention to detail, I can never stress this point enough, it may be the most boring part, but it will be the part that saves you the most time or embarrassment.
All in all, I am satisfied with the re-calculations I had to make and the re-working I had to do from their model, but it will work. I hope this short presentation of mine is helpful in the sense of getting a better grasp on this project, especially when working off someone else’s work, alas though, this is the beauty of science and engineering, building from each other’s work and vision, mistakes and successes!
1Facultad de Ciencias, Universidad Peruana Cayetano Heredia, Lima, Perú
2Dirección de Investigación y Desarrollo, Instituto Peruano de Energía Nuclear, Lima, Perú
3Instituto de Investigación Científica (IDIC) - Facultad de Ingeniería Industrial, Universidad de Lima, Lima, Perú
4Facultad de Física, Universidad Nacional Mayor de San Marcos, Lima, Perú
Correspondence to: Eduardo H. Montoya R., Facultad de Ciencias, Universidad Peruana Cayetano Heredia, Lima, Perú.
Copyright © 2015 Scientific & Academic Publishing. All Rights Reserved.
This work is licensed under the Creative Commons Attribution International License (CC BY).
http://creativecommons.org/licenses/by/4.0/

Discussions
Become a Hackaday.io Member
Create an account to leave a comment. Already have an account? Log In.