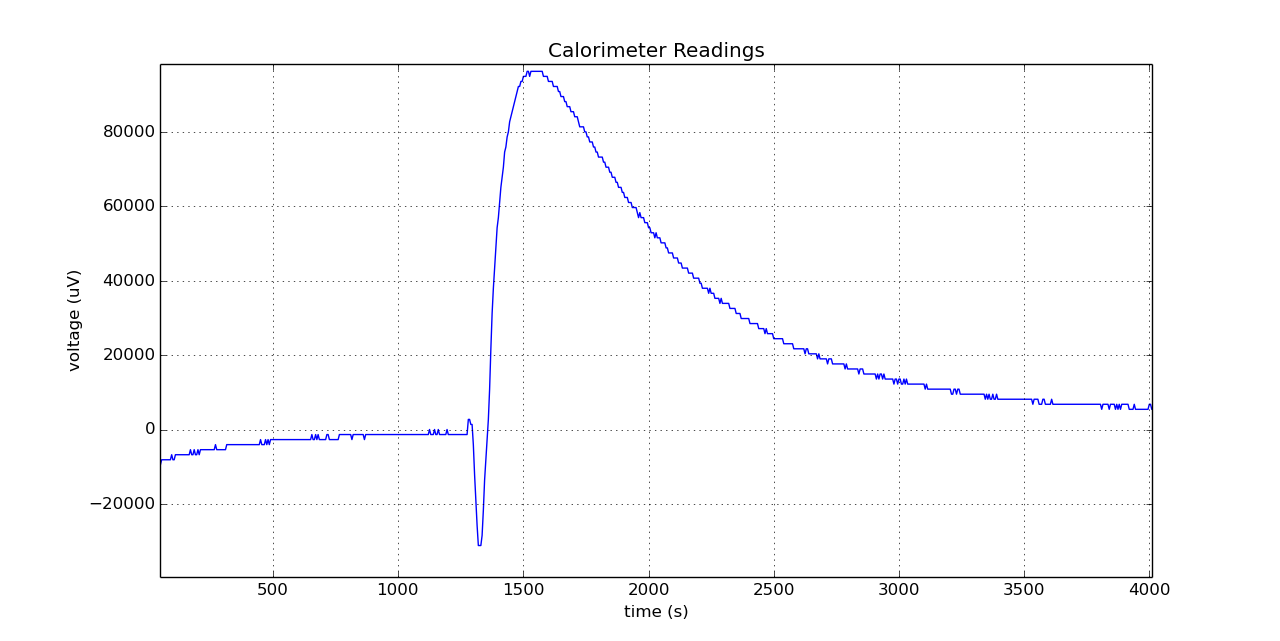
I added some NaHCO3 with water (exothermic reaction) into the sample vial and the reference vial contained sand at that time.
The following is a plot of the raw calorimeter readings in micro-Volts versus the time in seconds, the plot was created in Python using matplotlib.

I thought I should add the thermal power after conversion as well in milli-Watts,

 Ahmed Hefnawi (Volta)
Discussions
Become a Hackaday.io Member
Create an account to leave a comment. Already have an account? Log In.