Luke Beno
-
Sensor Mania!
09/15/2015 at 17:13 • 0 commentsOne of my main sources of inspiration for creating IoT projects is to simply look at all of the various sensors that are out there and dream up uses for them. There are so many great places to purchase them including Sparkfun, Adafruit, Tindie and eBay. The best part is that they are very inexpensive, usually for less than the cost of a cup of coffee you can buy one or two.
What I have been doing lately is finding a seller on eBay with a broad range of sensors and put together a fairly large order with various sensors that I find interesting and useful. In this project log, I'm listing out some of the sensors that I've recently purchased and a short blurb on what I was thinking about doing with them. As time goes on, each sensor that I build out will become a project update.
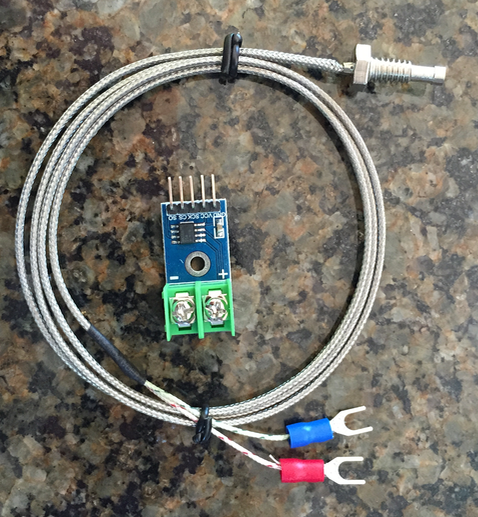
K-Type Thermocouple with MAX6675
![]()
With the heating season quickly approaching, I've been curious to measure the output temperature of a High Efficiency Fire place. My plan would be to convert this to a Wireless Thermocouple and take some measurements.
![]()
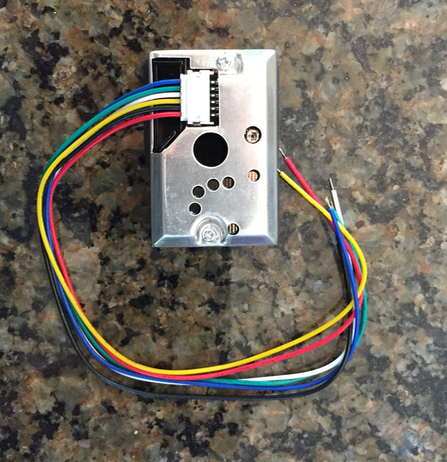
In line with Air quality measurements, I just think that the concept of measuring dust would be pretty cool. Maybe I could measure the dust moving through a HVAC vent. I don't know, this one is a little more out of left field.
![]()
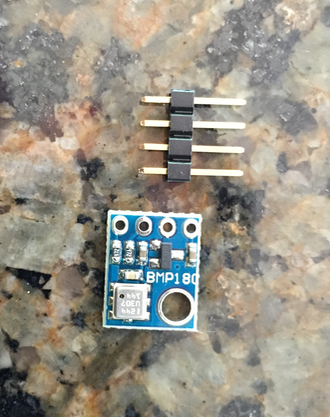
Pressure seems like a natural addition to my Temp & Humidity instrumentation. Also from time to time I've attempted to brew various types of beer and cider. I'm curious to know if the fermentation process could be measured. My theory is that with a typical Airlock, the pressure internal to the fermentation vessel oscillates as gas is released. By detecting the frequency of this oscillation, I may be able to learn something about the fermentation process.
![]()
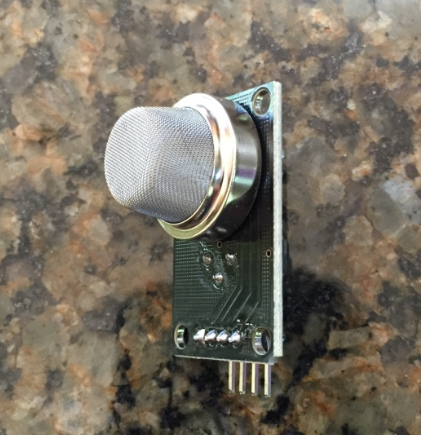
In general I'm curious about air quality, particularly the CO2 content in air. At the gym where I work out there is a large room with turf and high ceilings, then there is the weight room. Usually I find it more difficult to catch my breath in the weight room. I'm curious if it is a matter of air temperature or air quality.
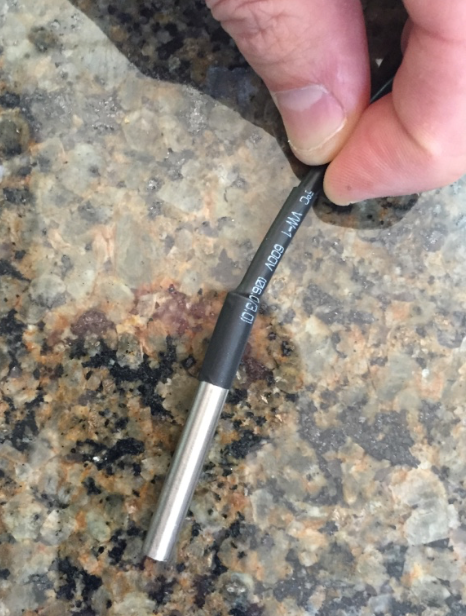
Waterproof DS18b20 1-Wire Temperature Sensor
![]()
Like I mentioned, fall is starting to set in here in Wisconsin, I would like to use one of these Waterproof Temp sensors to monitor the Lake temperature and watch it move towards freezing and thaw this winter.
100A Current Transformer Clamp
![]()
Home power monitoring has been something that I've wanted to do for some time now. With this current transformer I think that it would be pretty straight forward to do exactly this.
![]()
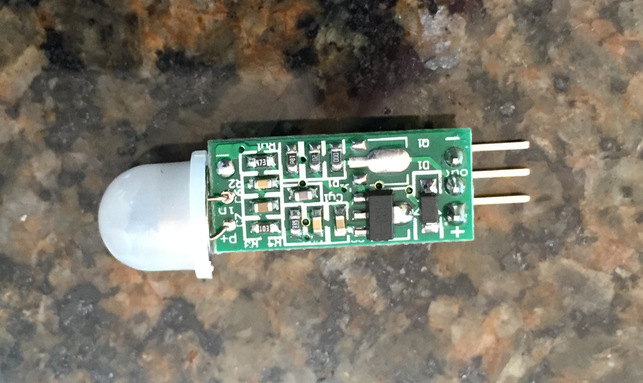
The though of a wireless motion detector is intriguing for me. Particularly, I would like to devise a system of wireless PIR sensors to detect pesky Deer that have been easting my Hosta plants around my house.
![]()
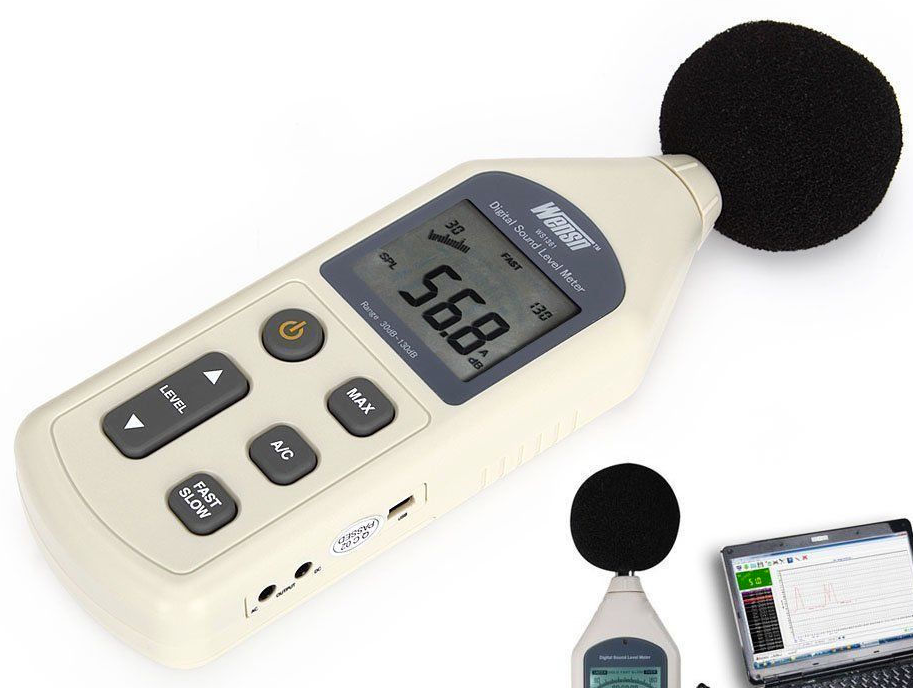
Ahh last but certainly not least, I purchased this sound pressure meter for a very special project that I'd like to do on Thanks giving. I'm going to attempt to live stream the sound pressure level inside Lambeau Field during the Packers vs Bears Football game.
-
DIY Solar Powered Sensors
09/15/2015 at 06:42 • 0 commentsThere's been a lot of discussions lately on forum.43oh.com about solar powered sensors. For me the goal is always to create low cost sensors. I like cheap because it implies that I can make more sensors with the same investment and more is always better.
We've all seen these at the local Dollar Store, Walmant, Hardware store, etc:
![]()
Just one dollar buys an adequate solar panel, a NiCd battery and a charging circuit. Thats pretty cool, all that is left is to add a boost converter and the sensors!
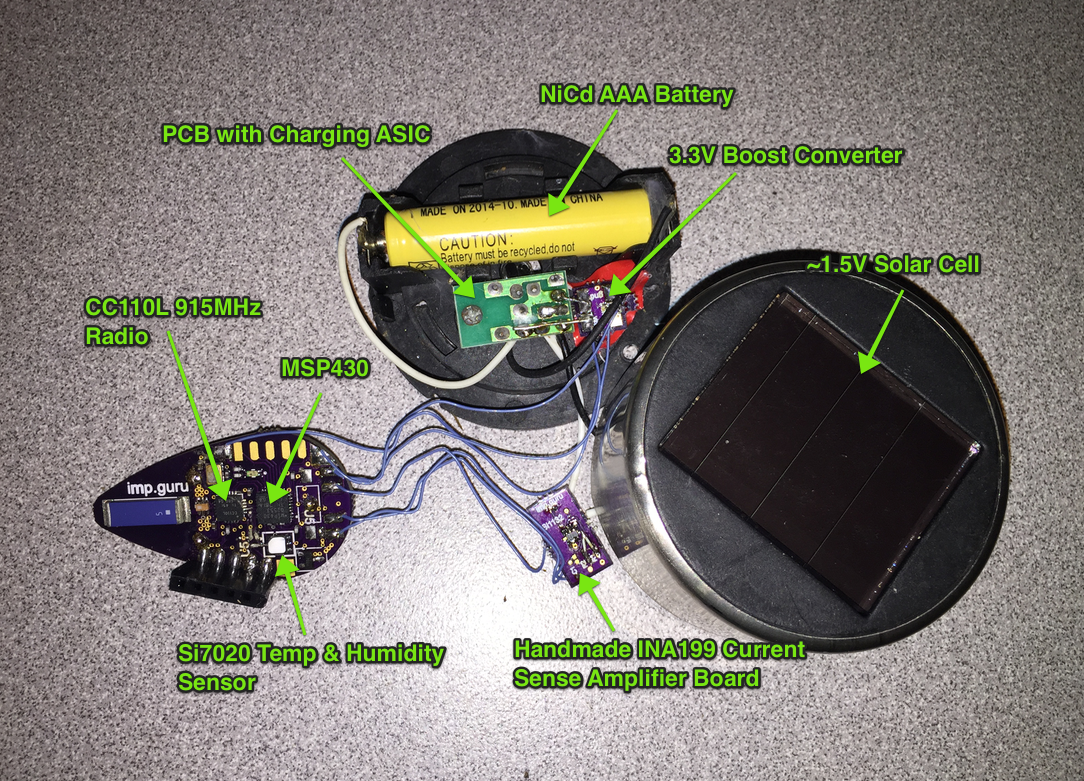
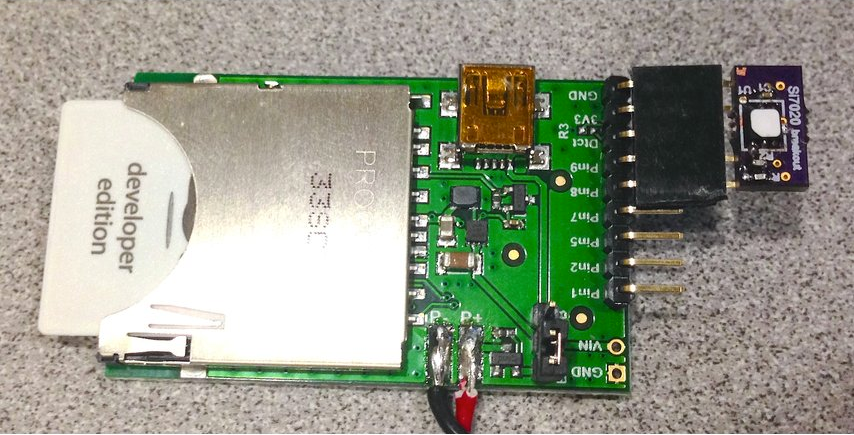
For this project I decided to again do Temp & Humidity as well as some monitoring of the Solar Power System. This includes measuring the Battery Voltage and the current sourced from the solar cell. Here is an image of the hardware:
![]()
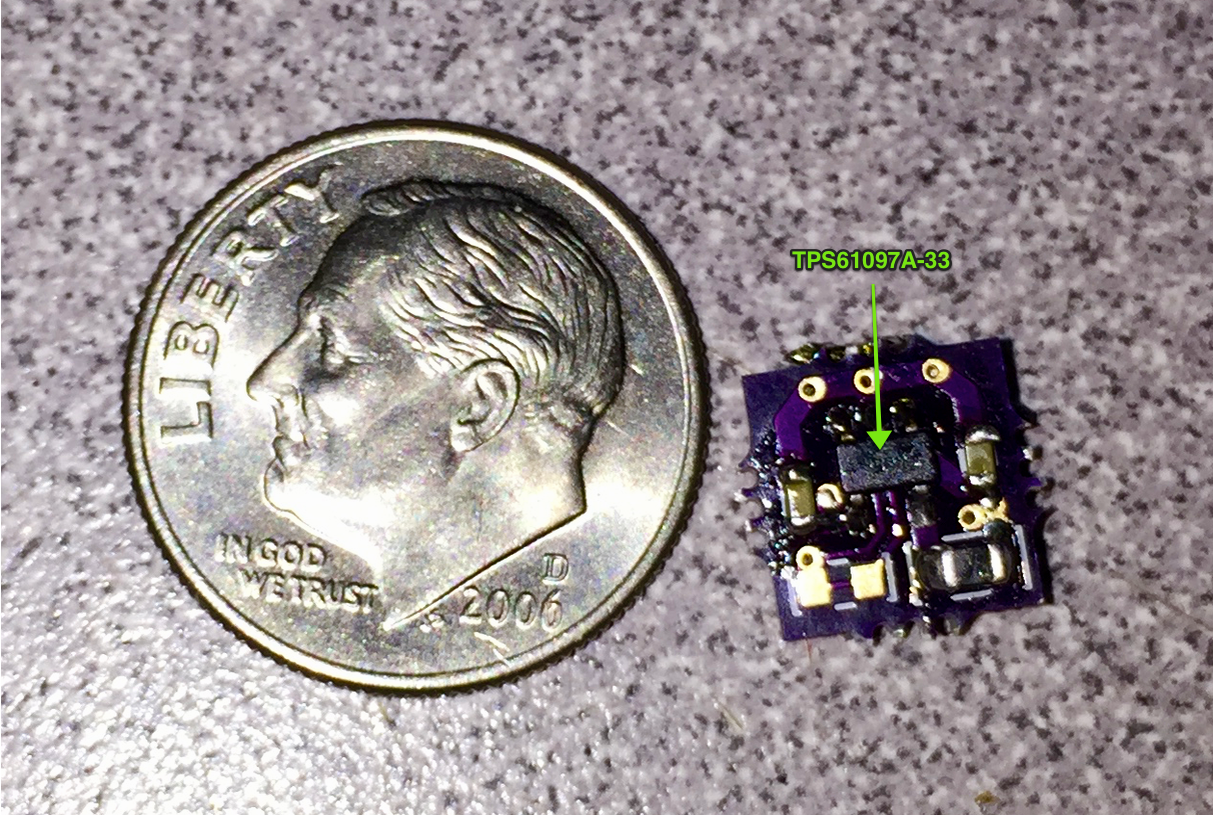
The boost converter is something that I built strictly for forum members and sold at cost. The PCB and schematic can be found here. Here's a picture:
![]()
The current sense amplifier is something that I bodged together with a INA199 and this PCB.
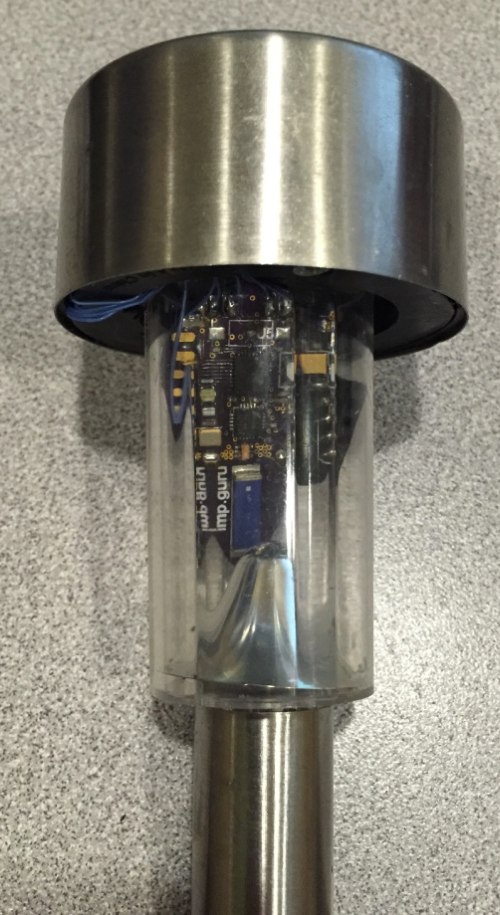
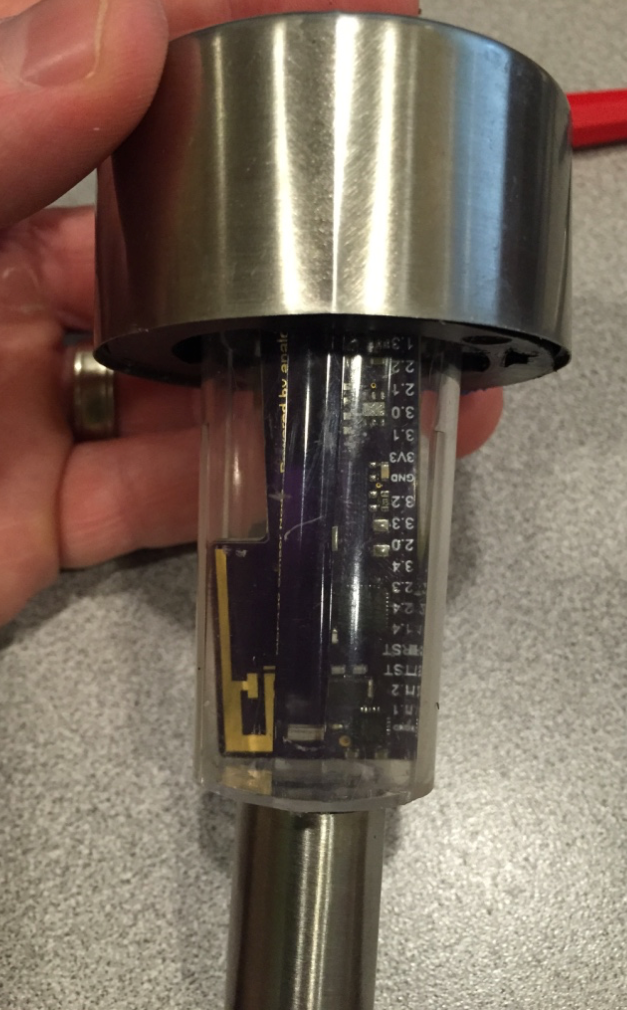
Putting it all together, here is the finished product:
![]()
What is neat about this is that the solar light also provides a good water resistant enclosure. Furthermore it breathes well enough that it does not have an issue with water condensation and the Humidity reading remains accurate.
Since I've also written about the 2.4GHz MSP430 Sensor Nodes, here is an example built with one of these. These boards have a boost convert built in so that is an added bonus!
![]()
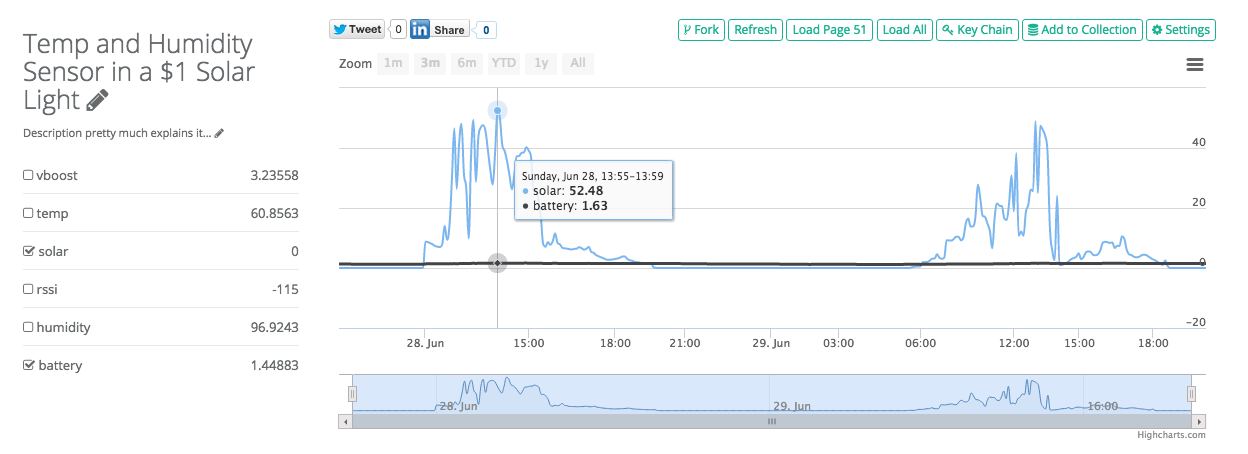
Of course, no analog.io project update would not be complete without some data:
![]()
This chart is showing the Current from the solar panel over a two day span. The data looks as expected, the current begins to ramp up as the sun rises, at about noon, the power hits its peak and then fades away into the evening. On June 28, the max power was produced around 2pm, this was about 85mW. This is great considering the sensor node only consumes an average of 1mW!
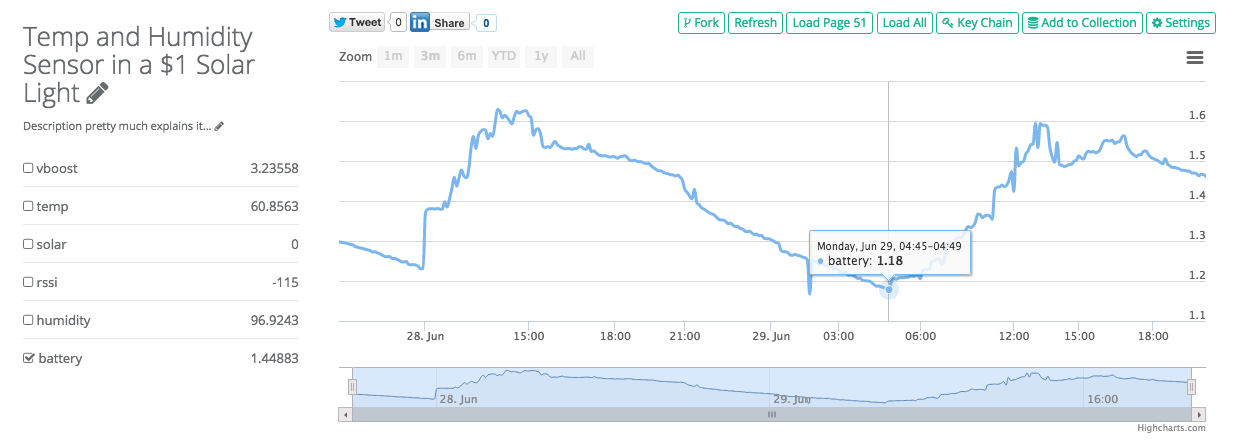
Here's one more chart, it is a close up of the battery voltage during its charge and discharge cycles:
![]()
-
Temperature & Humidity Sensing
09/15/2015 at 05:38 • 0 commentsI've often thought about what the quintessential "blink the LED" project would be for IoT sensors. For my own personal journey, the first thing that I did was create a temperature and humidity sensor. My approach for the last year now has been to look for interesting sensors, purchase a few of them and then figure out how to get them connected.
My two goto places for interesting sensors has been Tindie and eBay. I still remember my first Tindie Purchase. It was a great feeling to get the board, solder it up and see the first few days of temp and humidity data streaming in.
This really inspired me to create my own Tindie store and products. My first endeavor was a Si7020 breakout board that was designed to be plug and play with the Electric Imp.
![]()
In all I've sold 82 units to people all over the world. I've also given away quite a few to people looking for projects to get started with IoT. The big attractor for sales has been the blog post that I wrote for the Electric Imp community blog last October.
I even sent one to this guy:
Another great project for temperature only sensing was published here: http://www.instructables.com/id/TempBug-internet-connected-thermometer/
It is pretty interesting to now see the number of TempBugs that are now connected to analog.io! Last time I counted there were 18! I talk to people from all over about how they are using these sensors, in their homes, cabins, attics and basements. There has also been interest in deploying them in reptile tanks and cigar humidors.
So anyway, I do believe that Measuring the Temperature is something that every human can feel and empathize with, if you are looking for the first IoT project, I highly recommend trying one of these out.
-
Using analog.io to more efficiently order Fuel Inventory
09/15/2015 at 05:04 • 0 commentsThis example is a little off of the typical IoT sensor path but it has been a fun project to work on. The story goes a little like this. My in laws operate 4 gas stations in the local area. It's been their business for over 10 years now. My father in law prides himself on his ability to optimize his fuel orders in order to improve margin between what the price on the Street is vs his costs.
Part of his workflow is to have his employees send him a text message every morning with the current fuel inventory. He then has a very elaborate system of mental math that frankly I'll never understand, that is his black art.
One problem with the current system is that it relies on the employees to send a text message. This isn't the most reliable. For this reason, I thought that I would make an attempt for a better system.
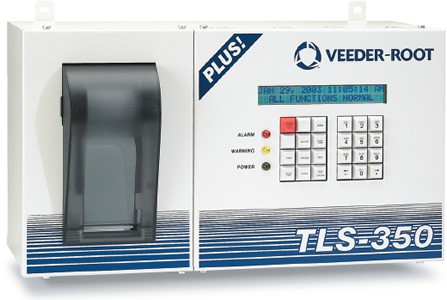
Maybe some of you have noticed one of these when passing through your local convenience store:
![]()
I don't have any evidence to back this up but at least in my observations, Veeder-Root has approximately 100% market share with these Tank Level Sensors. They are pretty old school systems, but then again the market isn't really demanding new features and I could only imagine that there are regulatory hoops to jump through. I'm getting beside myself...
So the goal really is to create a hack for this device such that I could extract fuel inventory and zoom it off to the internet. Luckily most of these devices have a very convenient serial port that was used back in the day to connect a printer or modem. The port is the 25 pin D-Sub variant topping out at 9600 baud.
Much to my surprise, Veeder-Root is also very open when it comes to openly publishing their operators manuals, service manuals and Serial Interface manuals. You can find it all on their online documentation server.
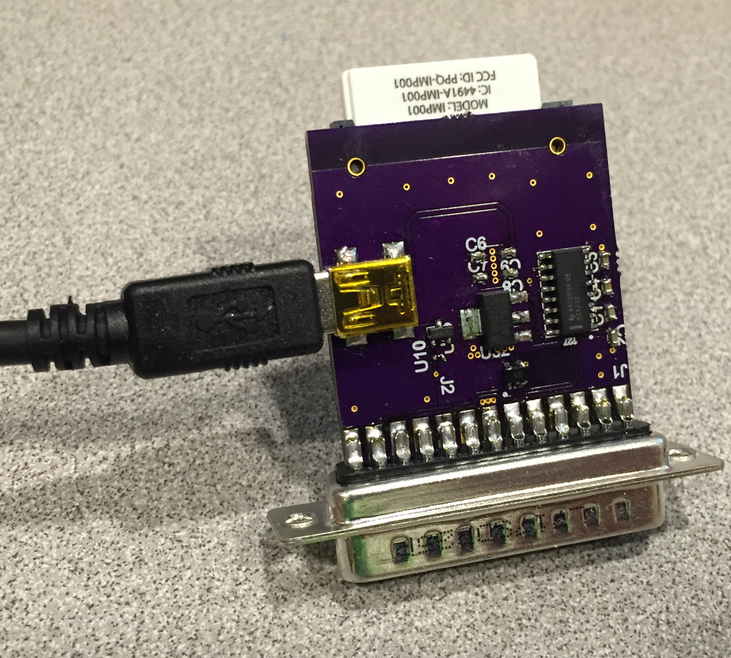
So I pulled the appropriate service manuals and learned about the serial protocol. One thing led to another and I ended up designing the following accessory:
![]()
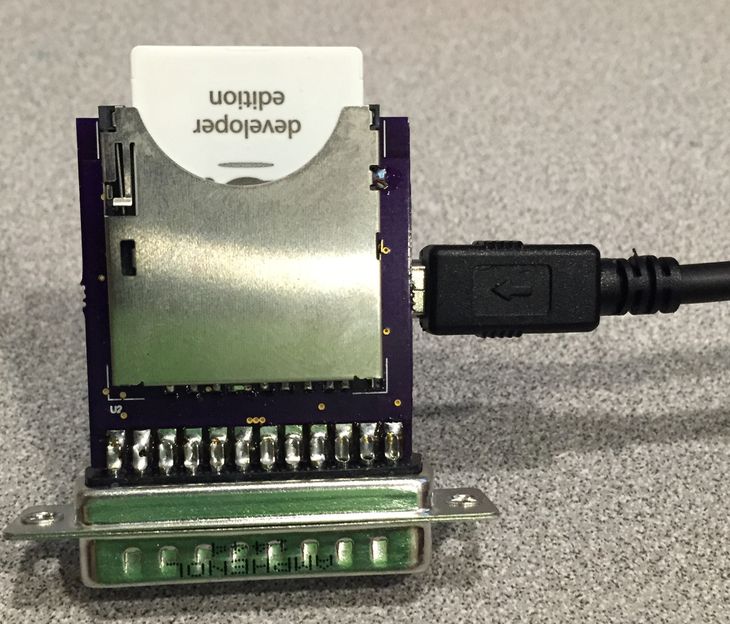
It is a pretty simple circuit, just a 5V to 3.3V LDO, a MAX232, the Electric Imp, ATSHA EEPORM and a logic gate for level shifting the UART. Here is the back side:
![]()
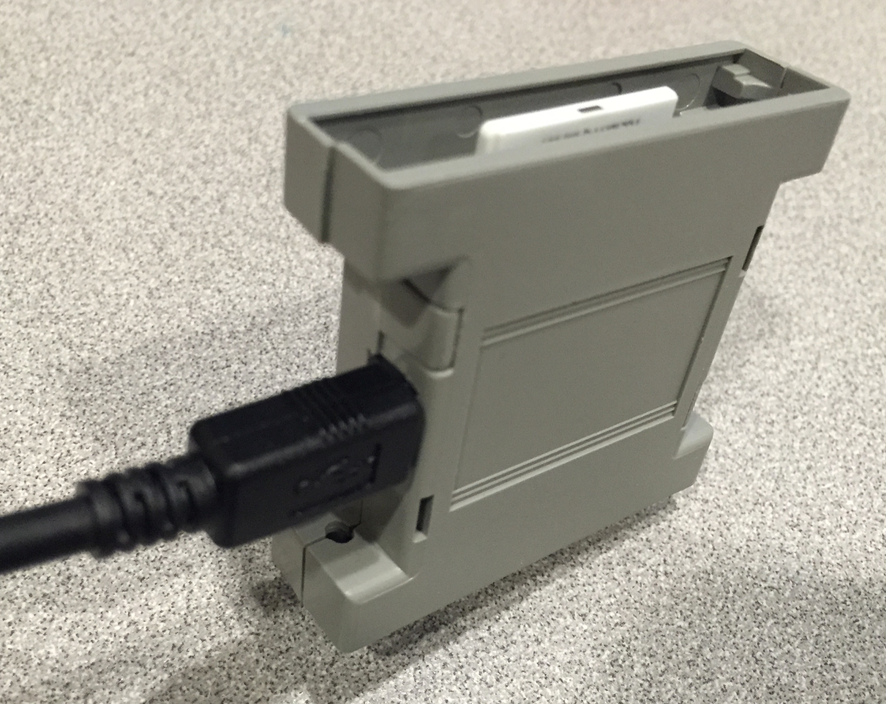
The unit is designed to fit into this Case:
![]()
As you can see, this project is based on Electric Imp. This has been very useful because I could install the device at the gas station, get it connected to WiFi and then program from my house which is about 4 miles away. This is great because no one likes to sit and debug code on sitting on the floor of a cramped gas station supply room!
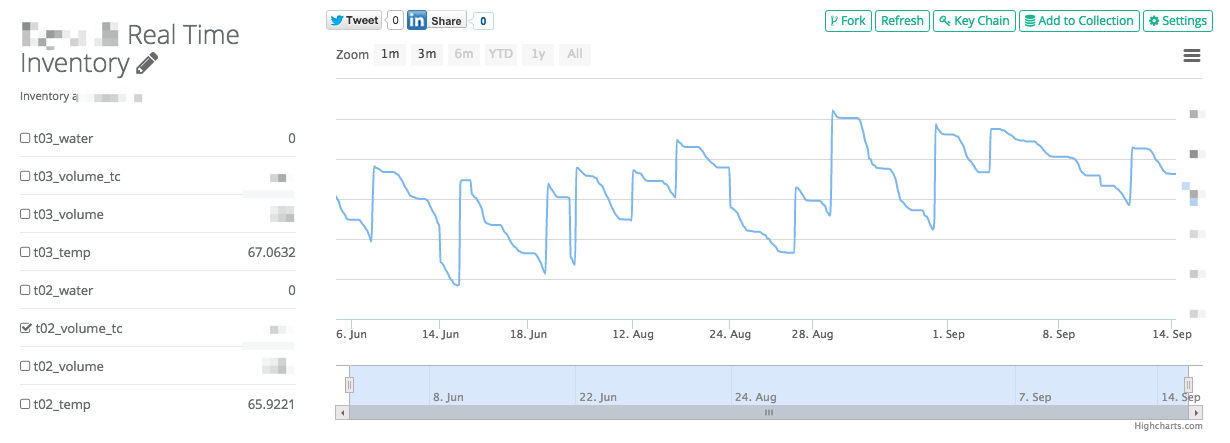
So here is the plot. Because this is some sensitive business data, I redacted the actual values. I am willing to share the Electric Imp code on a case by case basis so please contact me if interested. I don't think that it is appropriate to make it public to everyone.
![]()
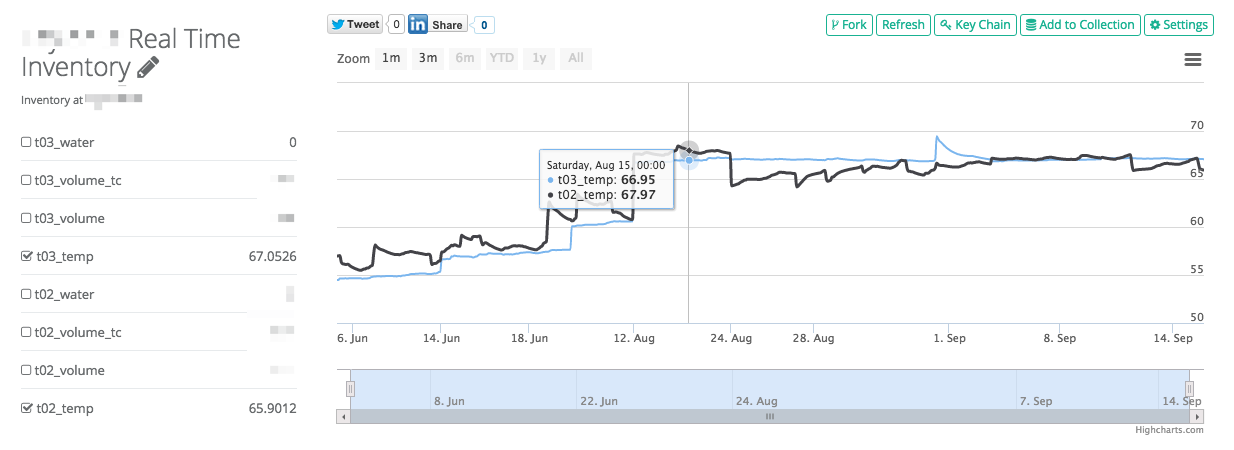
One interesting thing about fuel is that it actually changes it's volume based on temperature. It is neat to look at the temperature of the Fuel in the underground tank over the course of summer. Overall the underground temp is about 10-15 degrees cooler than the air temp.
![]()
In addition to the analog.io analytics, I also wrote some Electric Imp agent code that leverages the Twilio API in order to send the daily text messages. Lastly the code detects when he is getting a delivery, sends a notification text, and also when the delivery is complete it sends a delivery summary text. This has been convenient because he can know right away if the fuel company misses a delivery that he ordered or if they accidentally delivered the incorrect amount.
This is an example of the real applications for IoT, you can't really hype something like this but for gas station operators across the world, tools like this will become increasingly important. I can't take all of the credit, other solutions exist too. I imagine this one is just more cost effective.
-
Introducing the De-Burr filter
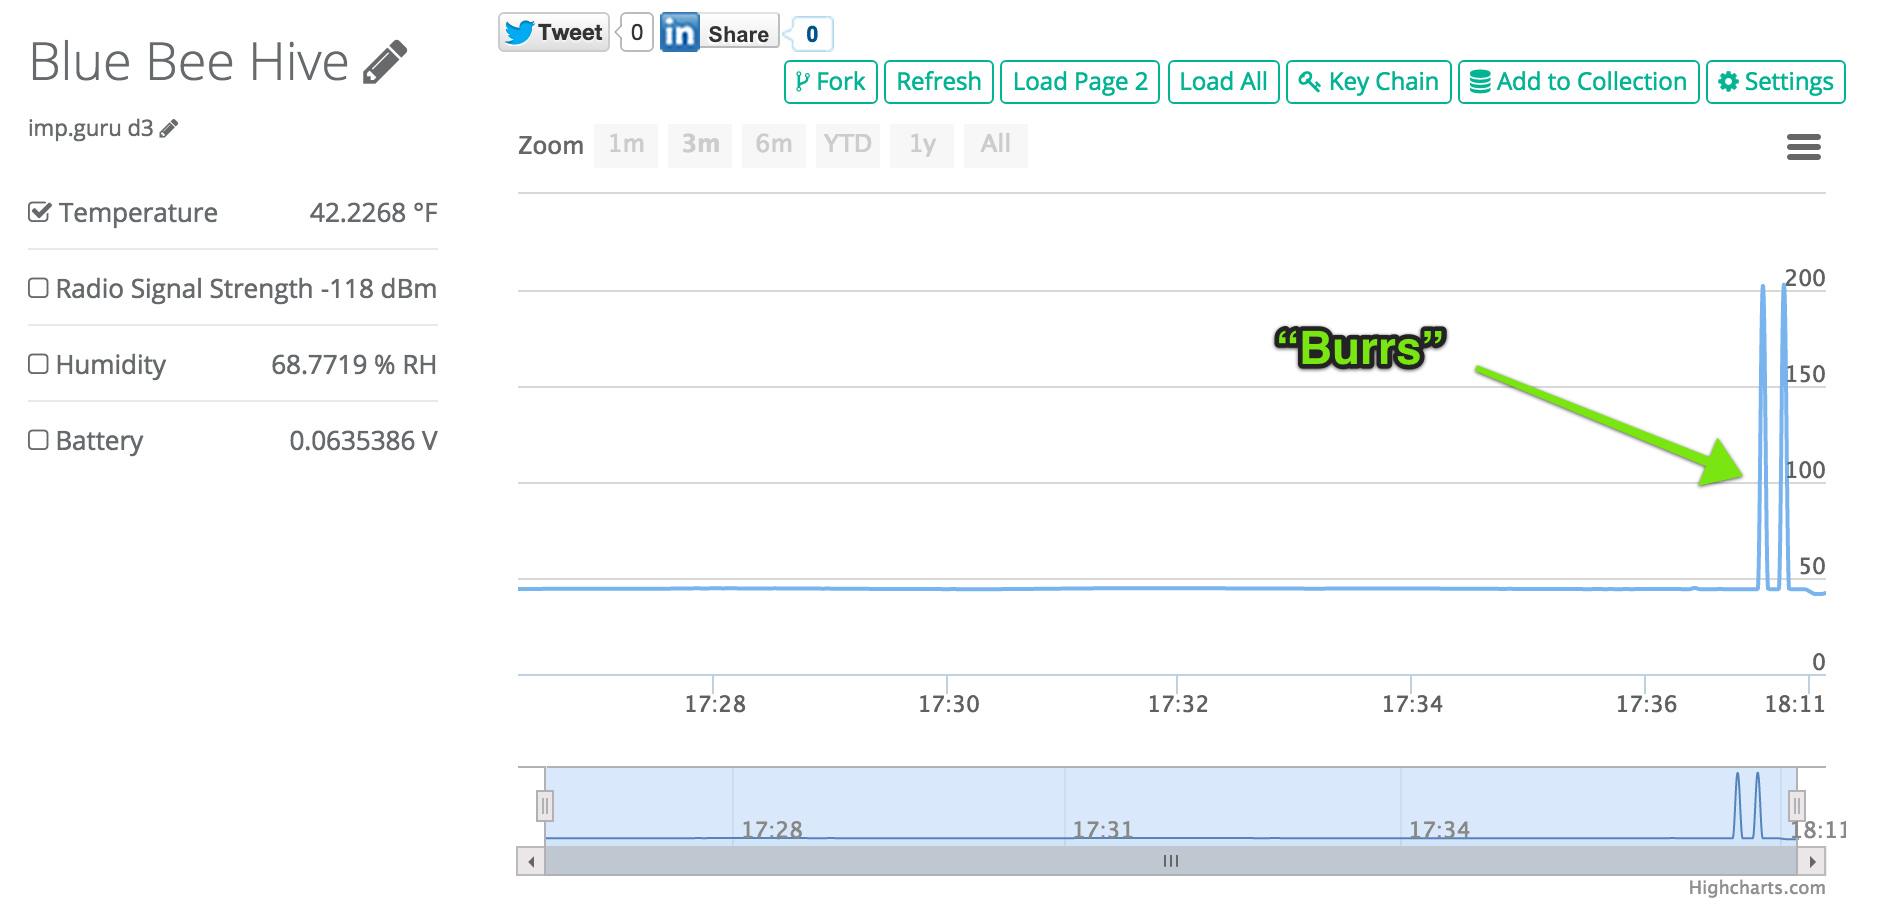
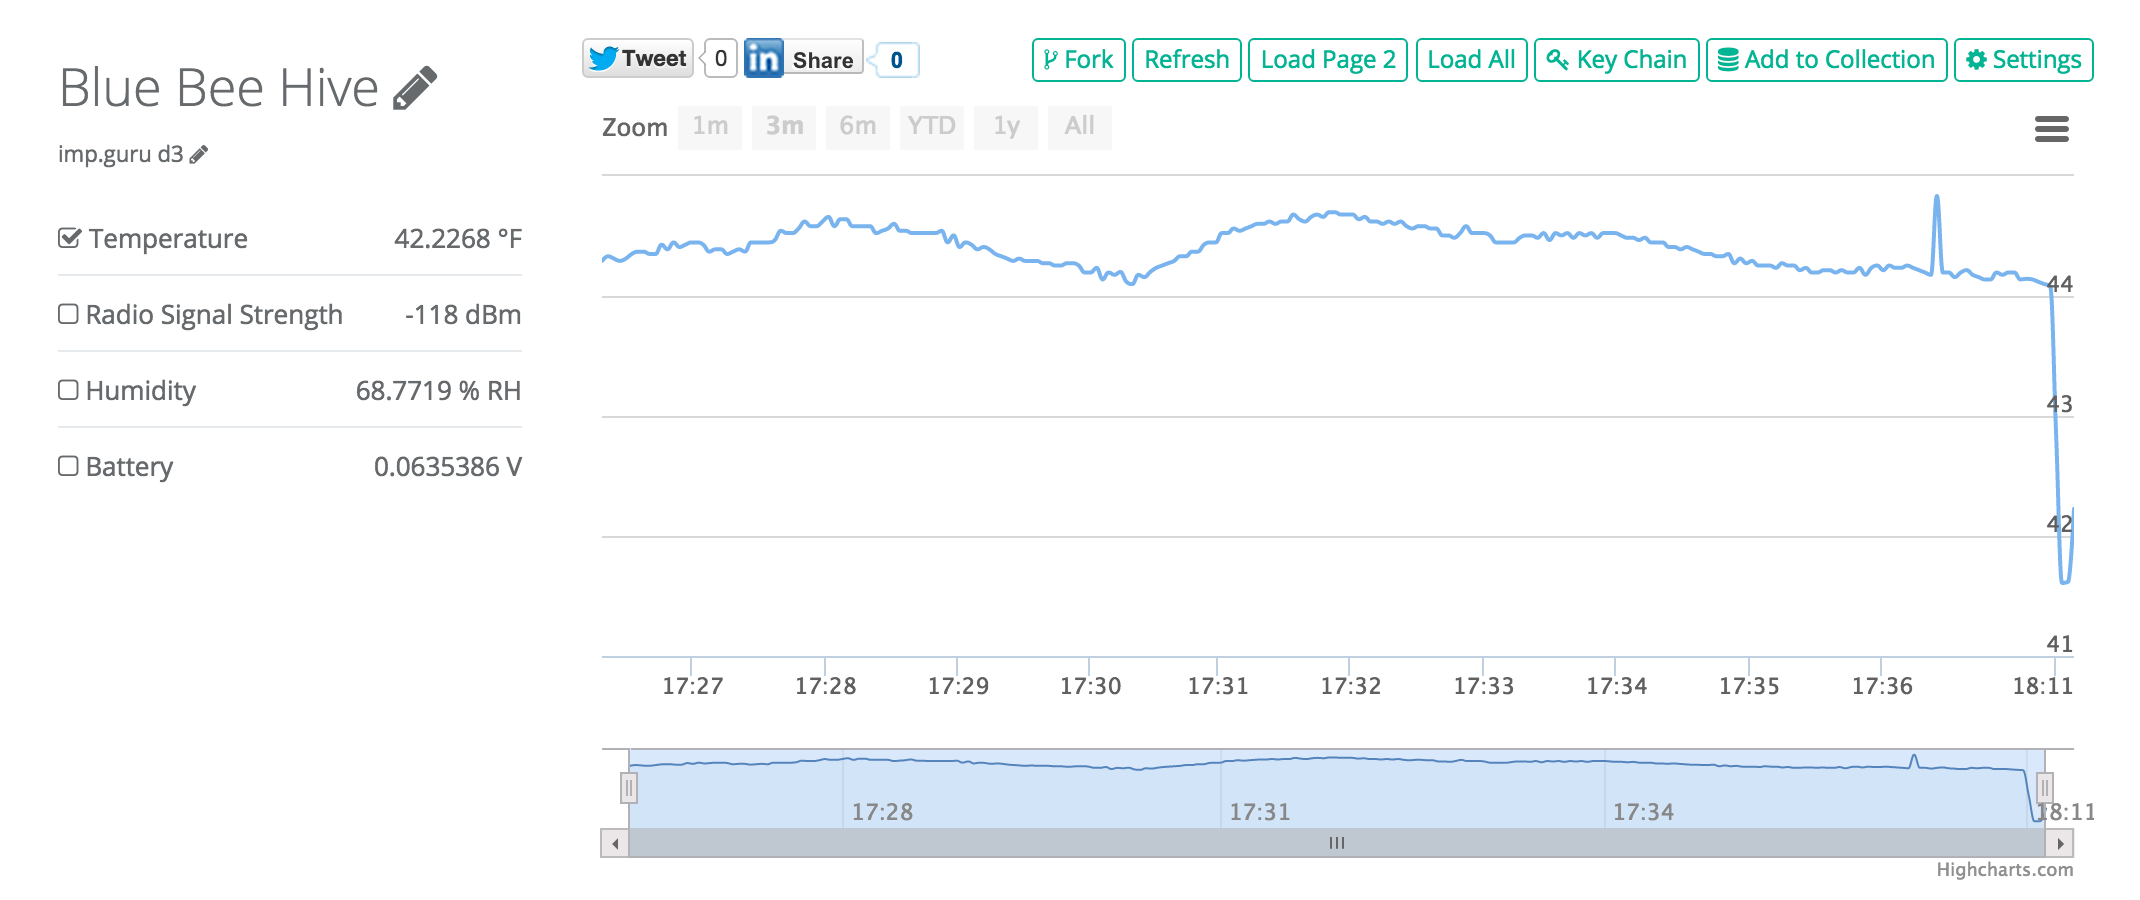
09/14/2015 at 07:26 • 1 commentOne common issue that has been observed with many IoT streams is that they often have what we're calling burrs or anomalies where the sensor measurement is erroneous and produces a dis-continuous and incorrect measurement.
Here is an example:
![]()
Burrs are especially inconvenient because of the way that analog.io currently manages the vertical scale of the data plot: They tend to hide the important information that you actually want to look at!
For this reason, we've added a de-burr filter to analog.io! It is disabled by default but the rest of this blog post will describe how to enable it.
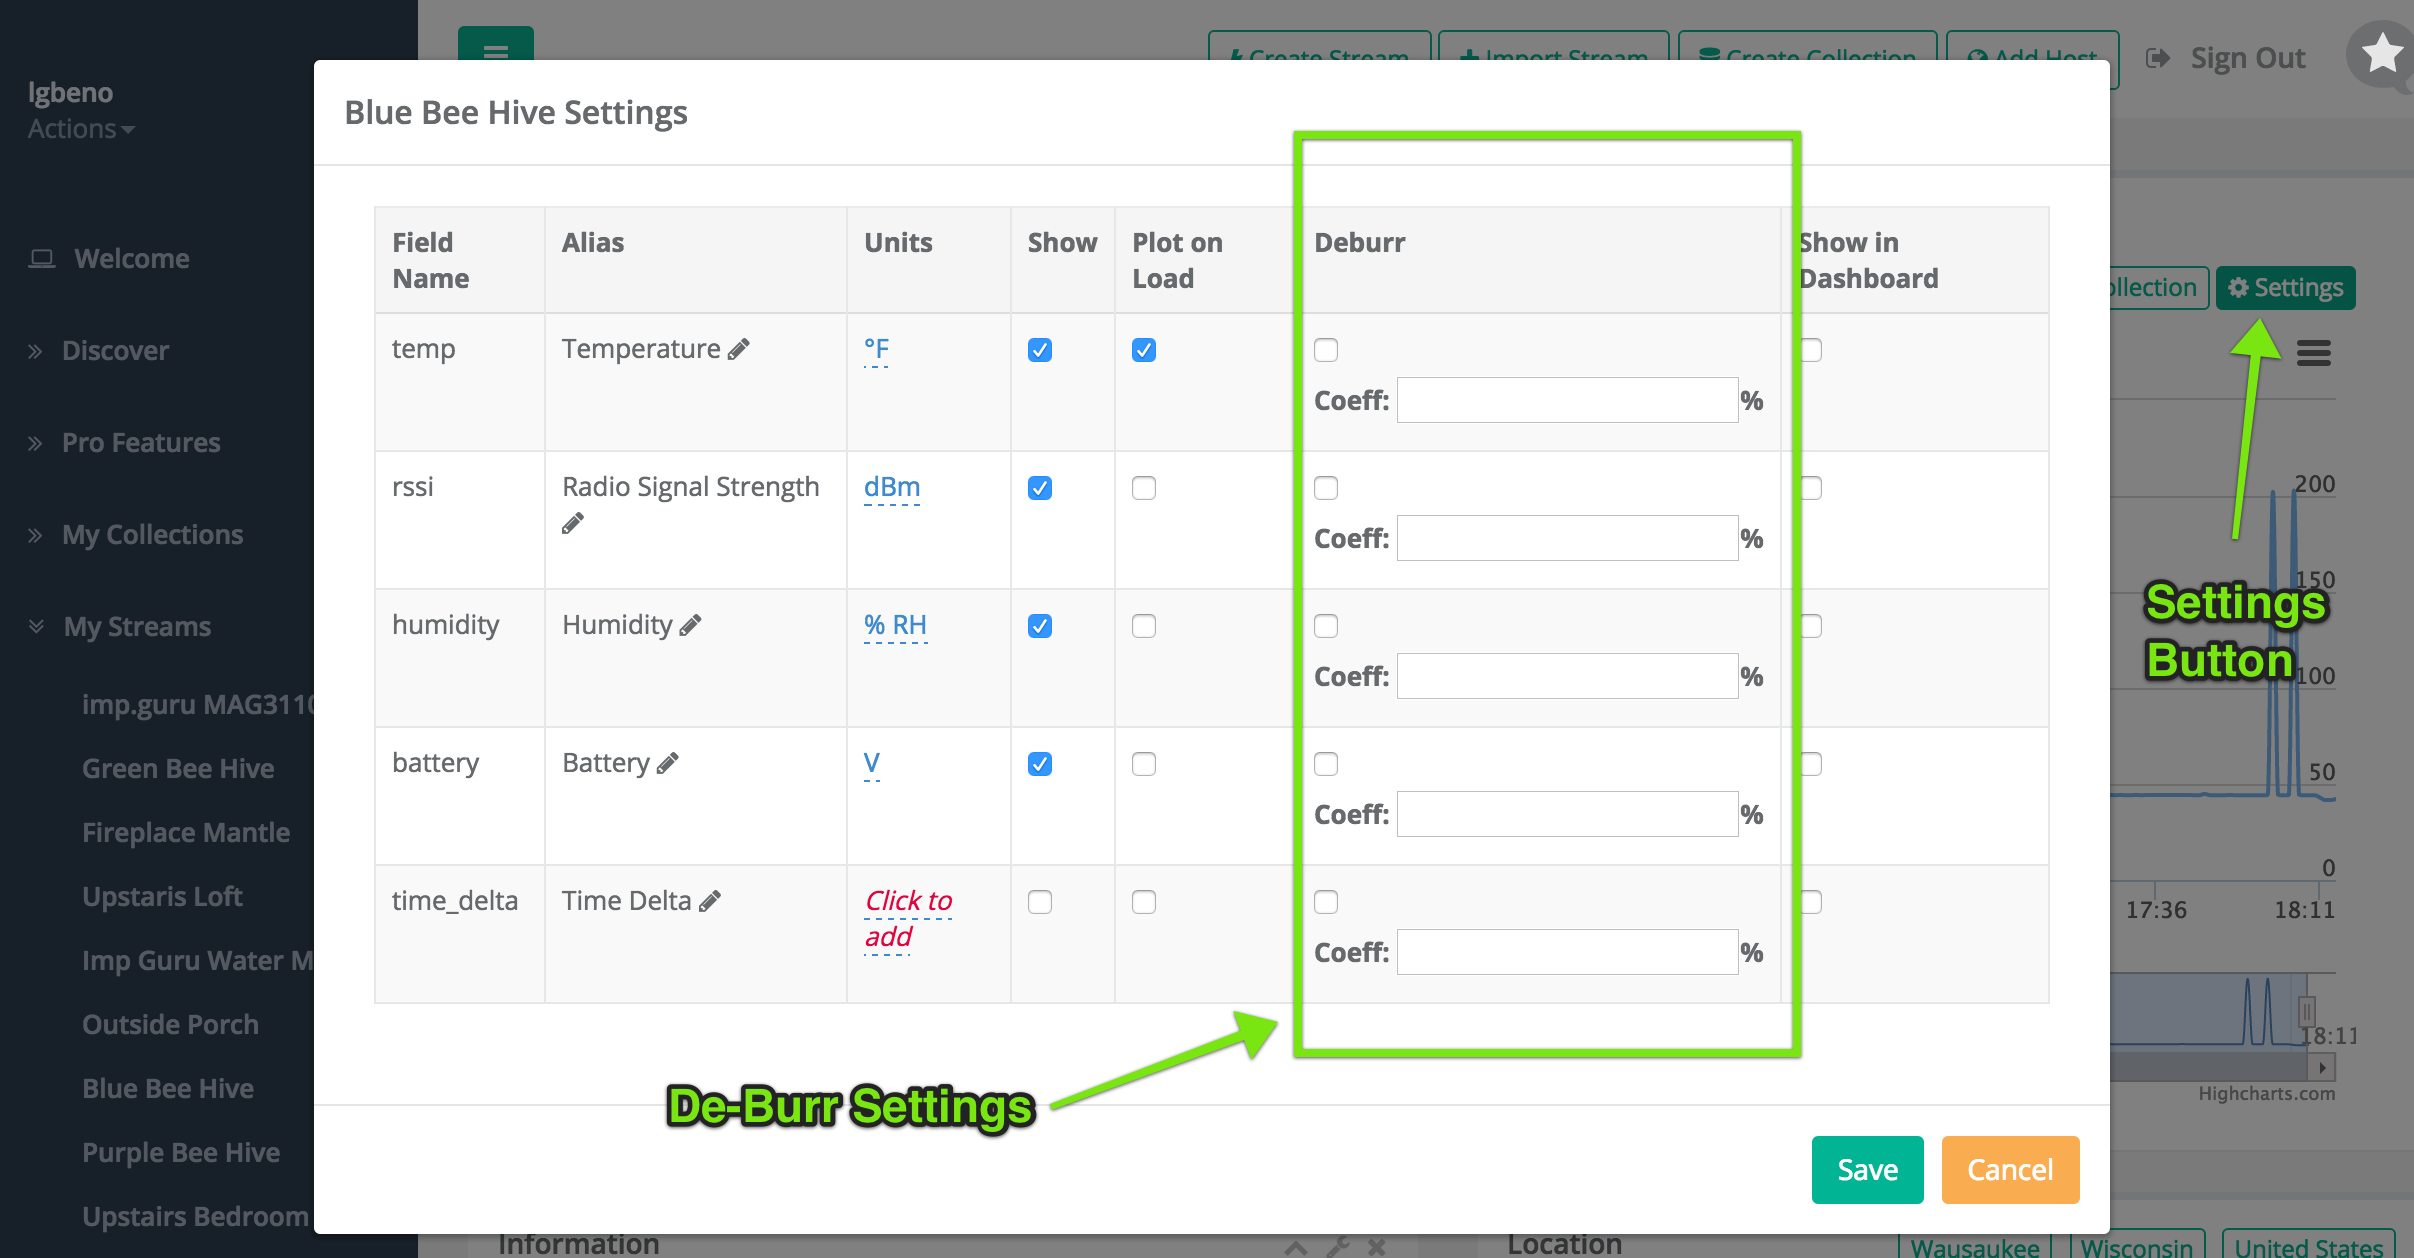
The de-burr filter is accessible from the "Settings" menu within the stream. When you click the settings button, a dialog will appear as shown below.
![]()
To enable the de-burr filter, simply check the box and enter a coefficient. Wait! What is a coefficient?!?!
The the de-burr filter operation is pretty simple, it scans through the stream data and compares the most current value with the previous sample. The coefficient defines the acceptable range that one sample could vary from the previous. It is specified as a ratio of the current value. An example would be very helpful:
Let's say that we have a current value of 44 degrees and the next sample is a burr with a value of 202 degrees. If we set a coefficient of 0.5, this means that in order for the next sample to pass through the filter, it would need to be greater than 44-44*0.5 = 22 and less than 44+44*0.5=66. Since 202 is not less than 66, it will be removed from the stream. Good bye burr!
Let's try that same Temperature data with the de-burr filter on and the coefficient set to 0.5:
Note: After saving your settings, you will need to do a browser refresh for the changes to take effect
![]()
That looks much better, now we can see all of the wonderful details that were previously hidden by the burrs!
-
DIY SMT Reflow Assembly
09/14/2015 at 07:04 • 0 commentsThis project log is a little out of order, but it took me a while to collect all of my thoughts on how to document this. I wrote previously about receiving supplies to build out the next revision of the MSP430 Sensor Node. Since then, they have magically been seen out in the wild. In fact through the 43oh forum, I've received pre-orders for about 10 of these boards and they all have already been delivered.
So these units didn't magically assemble themselves, this update is about the process that I used to put them together.
I've used this assembly method many times now, each time I'm very happy with the results so hopefully others may be able to replicate it.
Sorry in advance, I don't consider myself a great videographer or really worry over video editing, this video series is just some raw, off the cuff explanations of my process for assembly.
First a Brief Overview:
Some of the equipment I use:
Mounting the PCB to the Printing frame & Stencil Alignment
Applying Solder Paste
Component Placement & Pre Heat
Beginning the Reflow Cycle
First Check
Complete Assemblies
And there you have it, after the boards cool for some time, I put them under a microscope for visual inspection. Inevitable there will be solder bridge on some but this is easily remedied with a touch up soldering iron.
Finally I have some hand assembly of a connector and Battery holder. final step is programming and test. Then everything is ready to go!
-
User Growth of analog.io
09/14/2015 at 05:58 • 0 commentsCreating a web service is an interesting roller coater ride. At first, prior to the first release, it is daunting, very often fears of the tool "not being good enough" circulate in your mind. Delaying a release usually ensues once or twice until that leap of faith occurs where you make the site public ready or not.
On release of analog.io, I made a few tweets about it and shared the link on some forums. After all of that work coding, testing, polishing and perfecting ... nothing ... no activity on the site. Fire up all of the analytics tools like Google Analytics and Twitter analytics only to find that the tweet had 50 impressions, 5 people maybe clicked the link and 1 person signed up.
The moral of the story is that getting those first users is hard. You really start to realize that it takes a lot of exposure to convince users to join. Getting mind share is hard. The good news is that it always gets easier!
To get started I personally sought out and recruited each initial user via Twitter and Forums. I found some users on Hackaday.io as well. Striking a personal conversation with each of them and convincing them to give it a try.
I must say that the world is full of great people, I've enjoyed talking to all of them and learn quite a bit. Everyone has been very thankful for the discussion and the service. That is very fulfilling for me.
When the user count increased past 200 people, I just couldn't keep everything straight any more. I had Tweets and emails coming in from all directions and it was difficult to maintain cohesive conversations. At first I was using UserVoice because it was inexpensive but I eventually switched to Intercom.io because it has this great live chat which really helps me engage with people. Most importantly, engage them at the very moment that they are using analog.io. That is the best time to talk to them.
So today like most days, I logged into intercom and much to my surprise, noticed this exciting milestone!
![]()
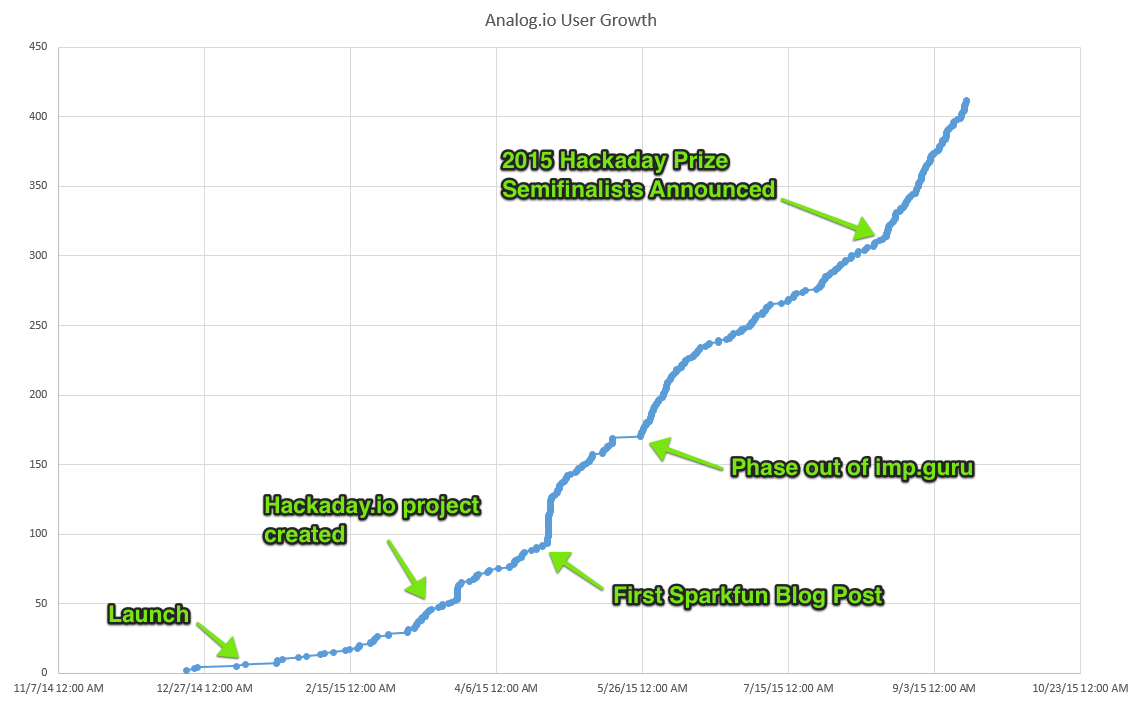
So I thought that it would be fitting to analyze the data a little deeper. Here's what the chart looks like:
![]()
The most noticeable trends are the exponential nature of growth. The second is the incredible influence that external referrals can have on the site. We're still talking about small numbers when compared to Snapchat or Slack, but I'm still happy for a hobby project.
Of course any person familiar with the Lean Startup would caution that this would be considered a "vanity metric." I definitely agree. At this stage, I'm happy to see this growth. To take it to the next level, a strict focus will need to be put on making sure that these users are getting the most out of the site and integrating it into their daily routine.
One step at a time!
-
Embedding & Sharing Data
09/09/2015 at 04:48 • 0 commentsLooking back, it is really hard to think about what the internet was like before YouTube. Back when YouTube was just getting started, the web had a problem with video. The issue was that there was just not an easy way to add video content to a web page or share video content with others.
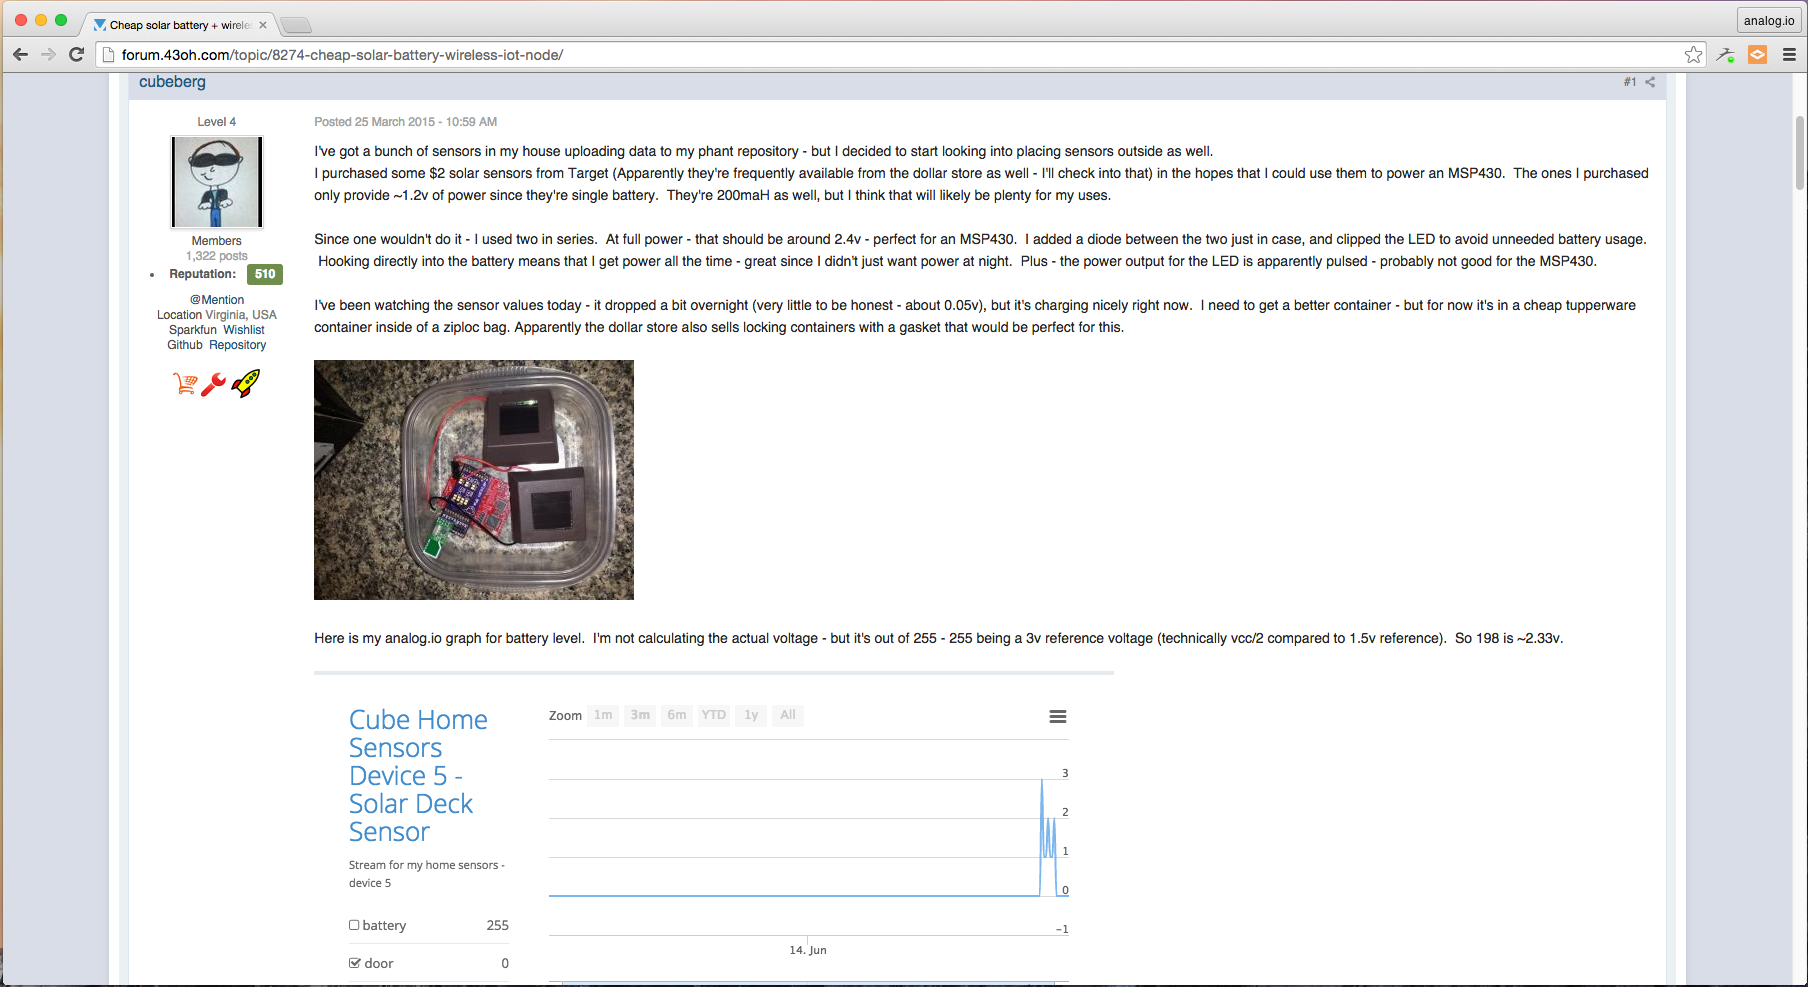
Still today I see the same problem with sensor data and this is what inspired me to create an "embed" function within analog.io. The embed feature allows users of analog.io to add an interactive plot of their sensor data into their personal web page, blog our forum just by adding one simple html snippet like the one below:
<iframe src="http://analog.io/embed/s9H" height = "400px" width="800px" scrolling="no" style="border:0"></iframe>This feature is already in use by some analog.io users and fully integrated into the 43oh.com forum. Here is an excellent blog post from 43oh.com:http://43oh.com/2015/03/embed-your-analog-io-iot-streams-into-your-43oh-posts/Here's an example of a 43oh.com discussion thread including live data:
http://forum.43oh.com/topic/8274-cheap-solar-battery-wireless-iot-node/
![]()
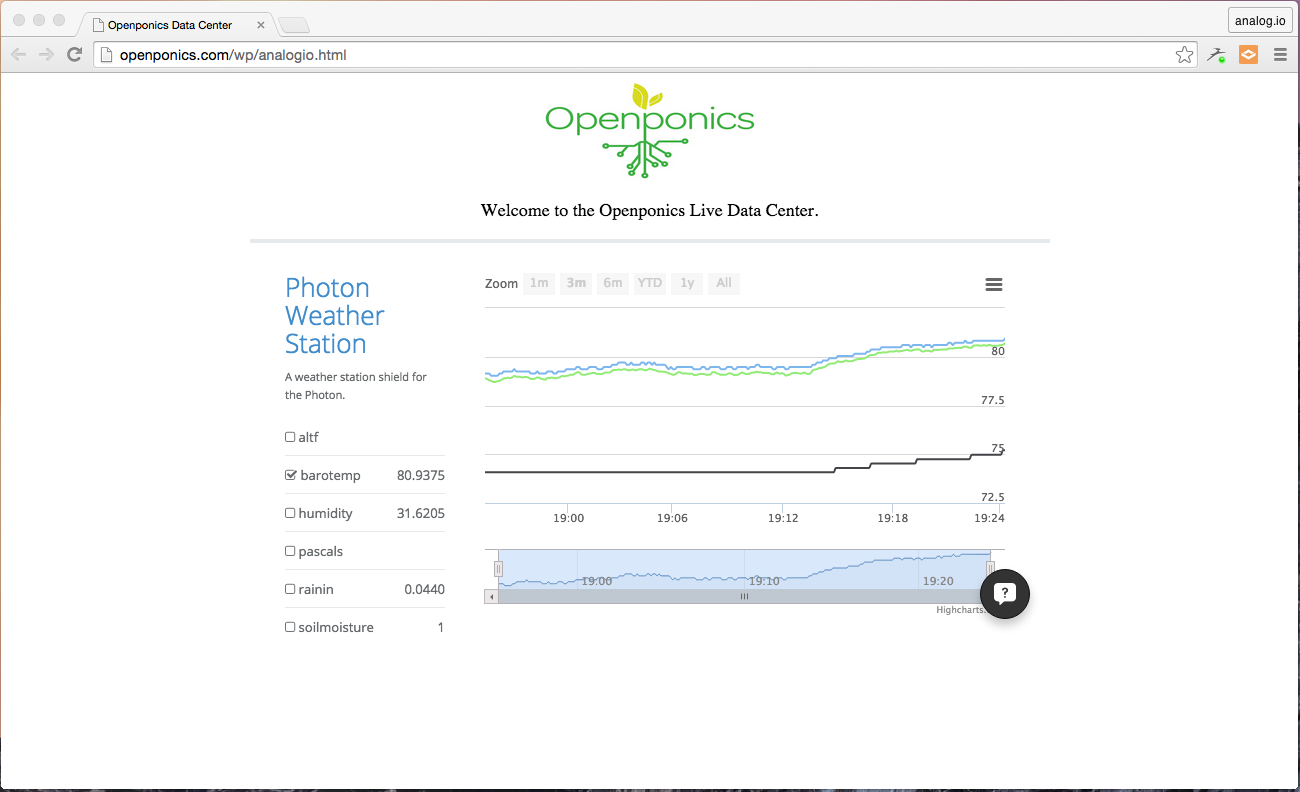
Here are some personal Blog Examples:
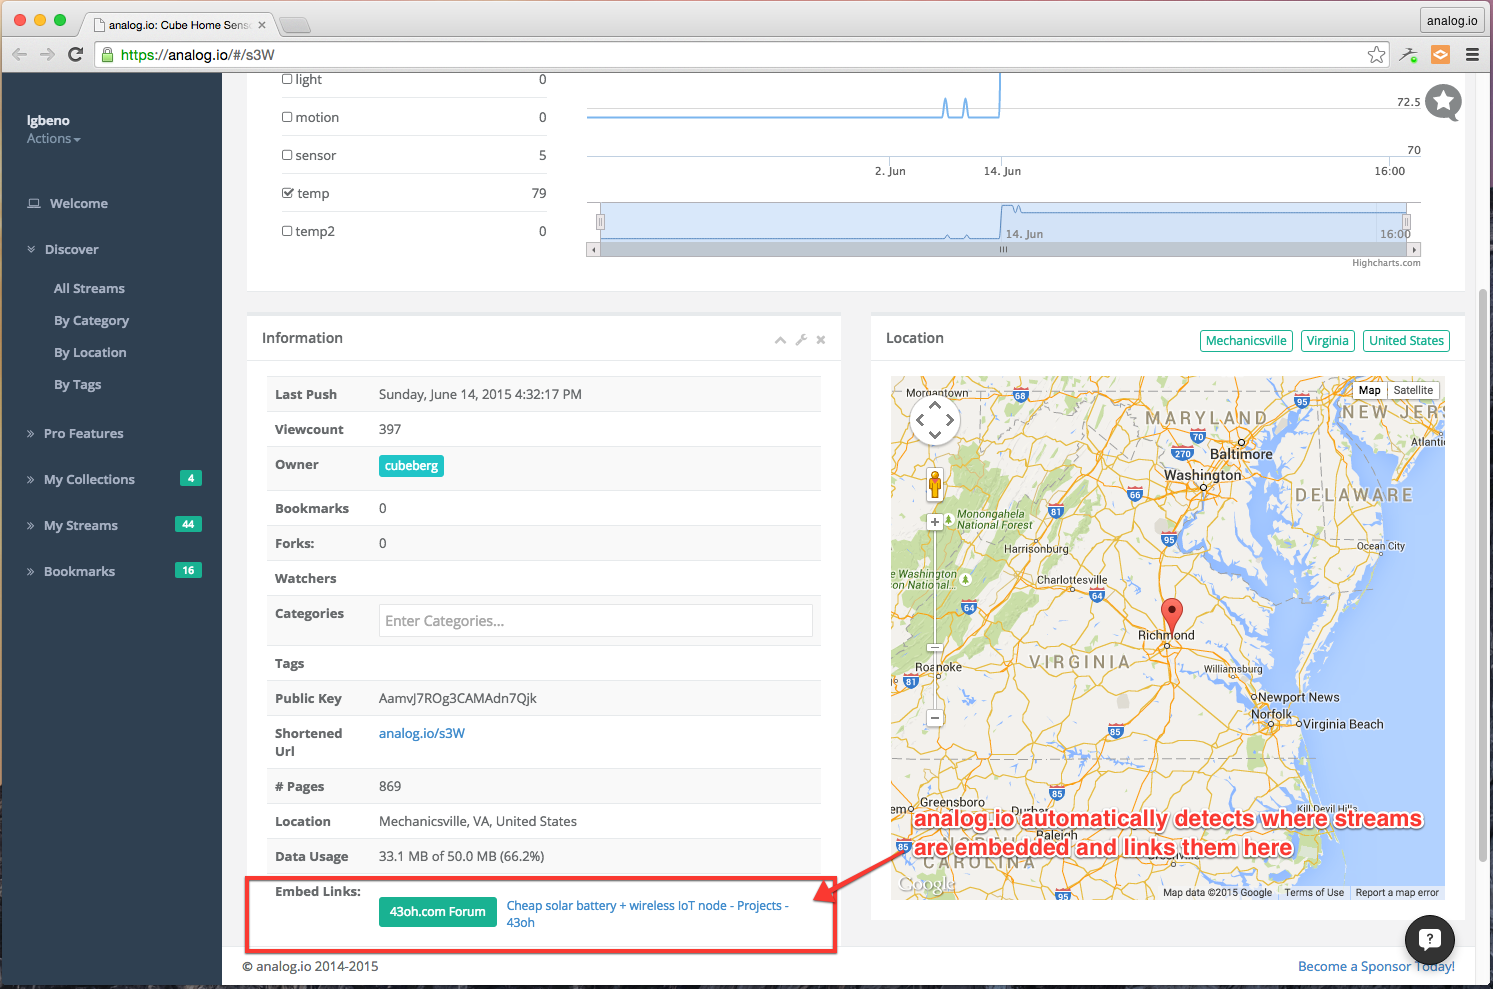
![]() What is also exciting is that for each stream, analog.io is capable of tracking where a particular stream has been embedded to give the viewer even more context about the stream:
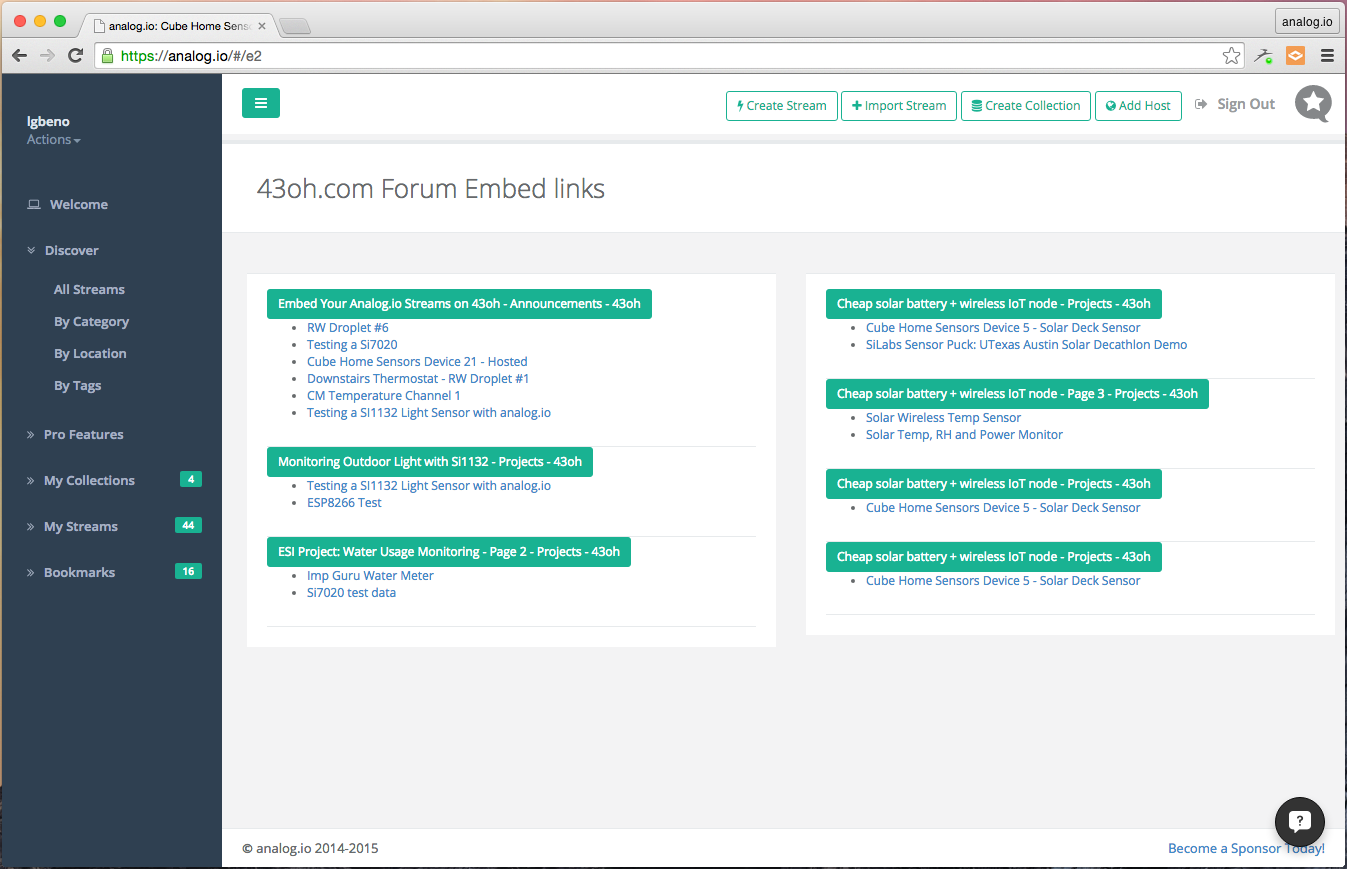
What is also exciting is that for each stream, analog.io is capable of tracking where a particular stream has been embedded to give the viewer even more context about the stream:![]() An index is also provided:
An index is also provided:![]()
With all of the great IoT projects on hackaday.io, It would be awesome to someday see embedding enabled here as well. It is as simple as adding a BBCode to the text editor and getting it setup to accept the iFrame.
If you are reading this and would like embed data in your blog, website, forum, etc, please leave a comment, I would be happy to help!
-
Creating a Custom Weight Scale
09/06/2015 at 20:34 • 3 commentsI published a summary of my previous scale project. In this project I hacked a postal scale that was purchased off of Amazon. This has been working really well, really the only complaint is that the scale area is smaller than the Hive base so things are somewhat tippy and unstable. I also felt somewhat discouraged that I'm not fully utilizing the readout electronics so I wanted to find a source for only the load cell portion.
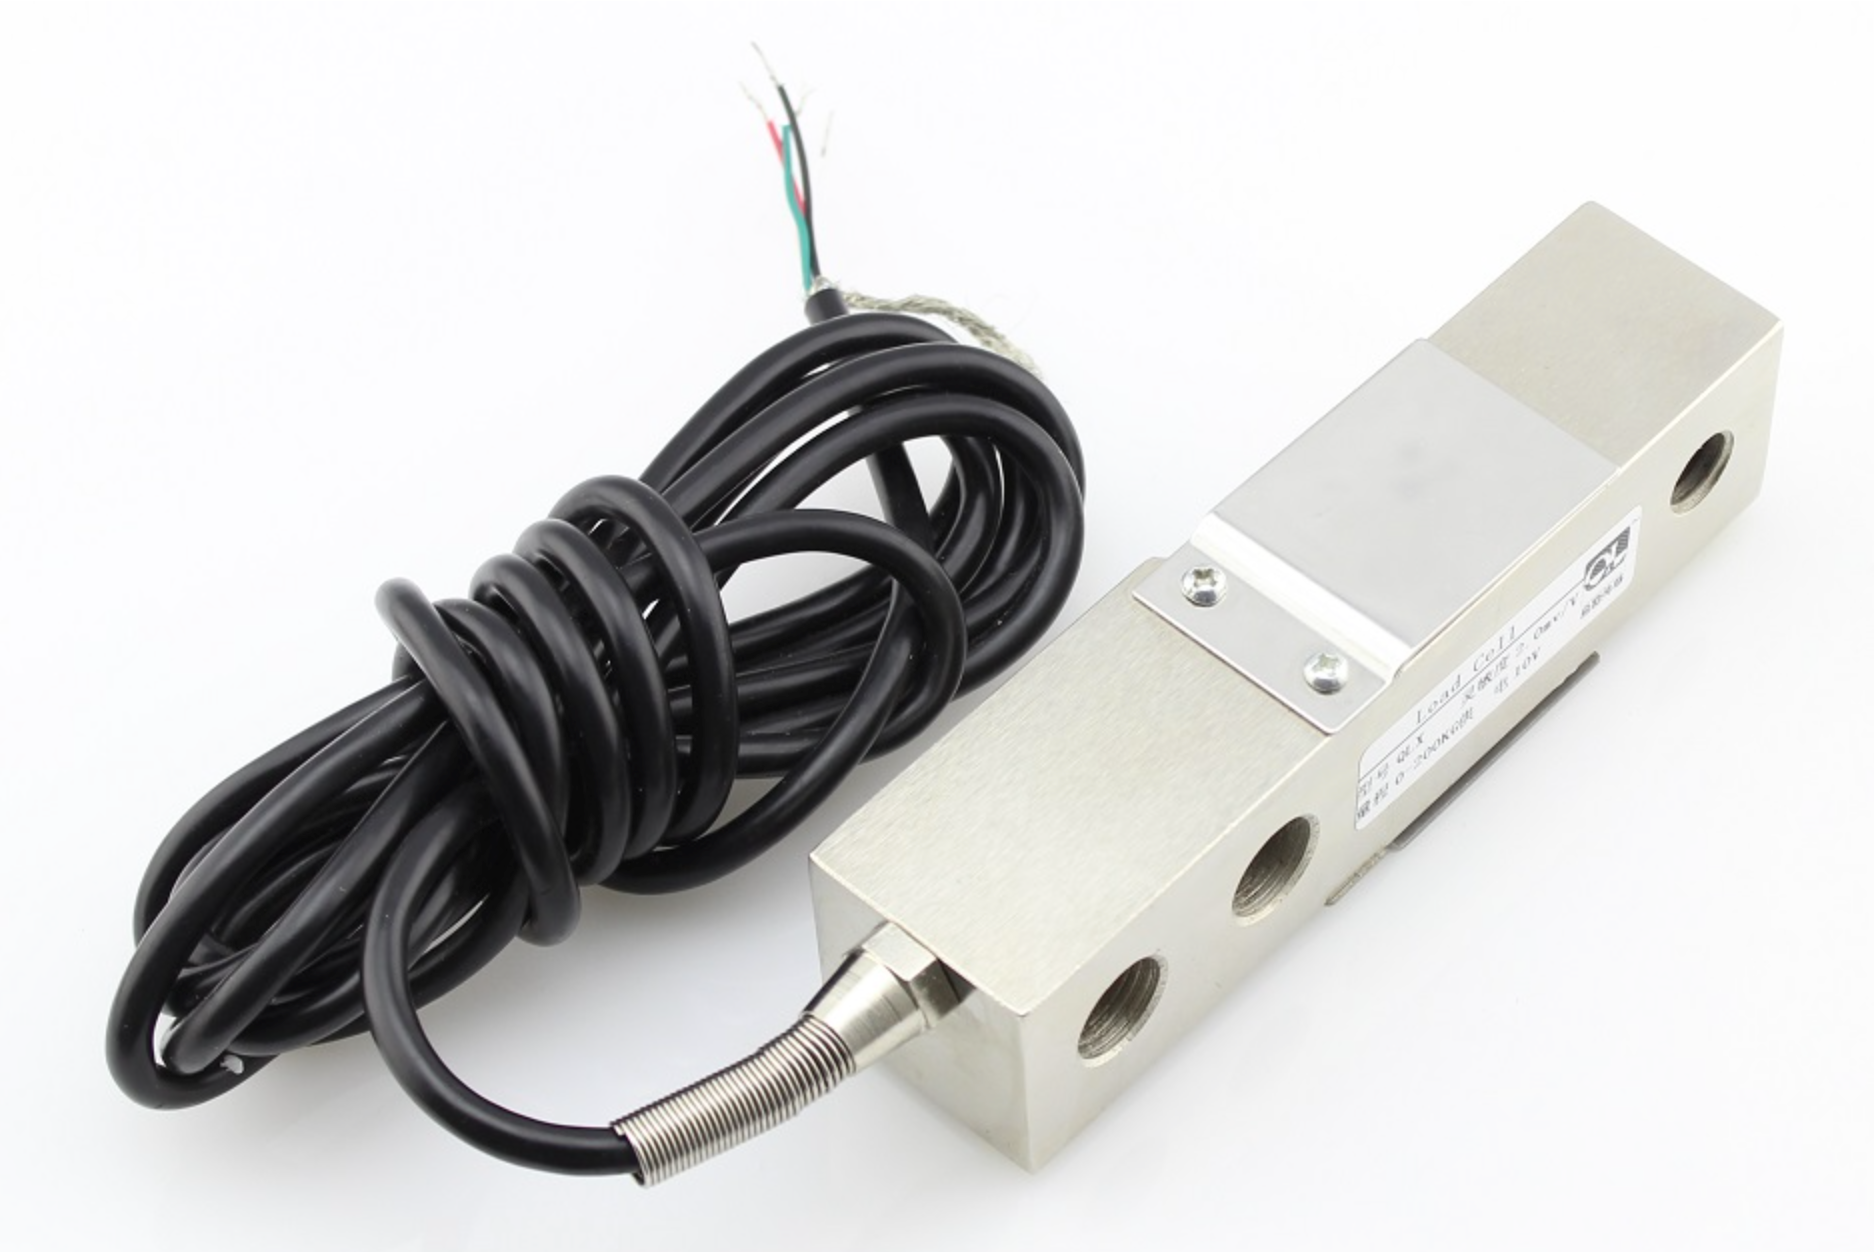
While I was ordering PCBs from Elecrow for my Sensor Node Build, I noticed that they had this load cell. So I tossed one onto my order.
![]()
This cell is constructed different than the sensors in the postage scale. It is basically a steel beam with packets machined out of it that focus strain in a localized region. This strain is then sensed by a strain gauge that is epoxied into the pocket. Using the same HX711 24bit ADC that I used in the previous project, I'm able to read out this strain gage with great resolution.
It is actually quite amazing, even though the load cell is a 1in by 1in, practically solid piece of steel, it is so sensitive that if I hold one side of it in a vice and VERY lightly touch the other side, this is enough to trip the reading buy at least 500 LSBs. Pretty remarkable really.
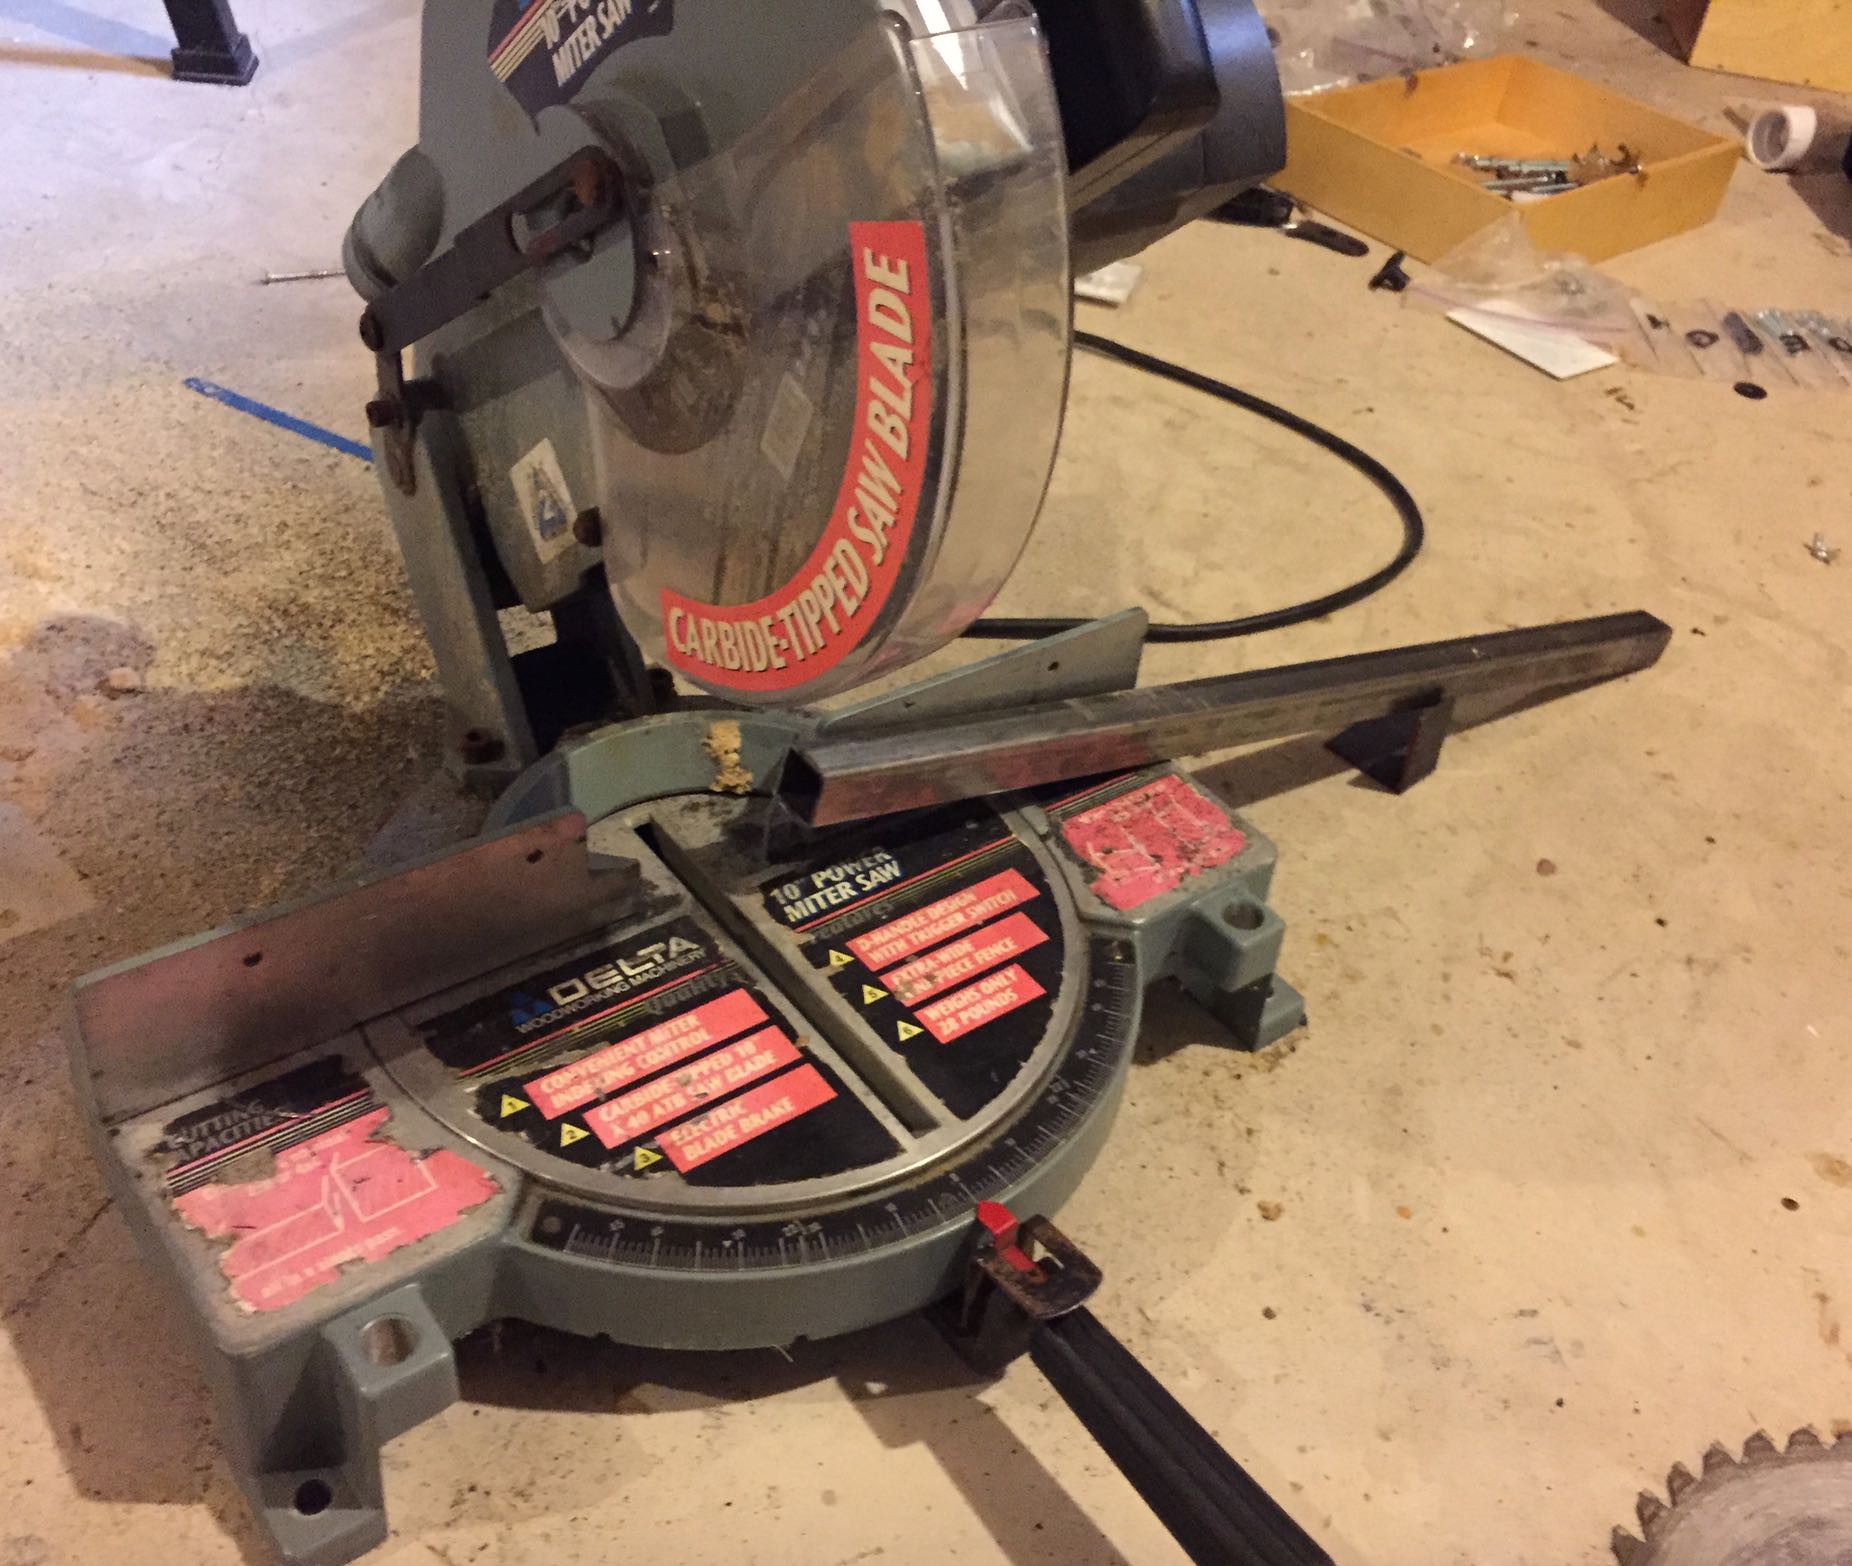
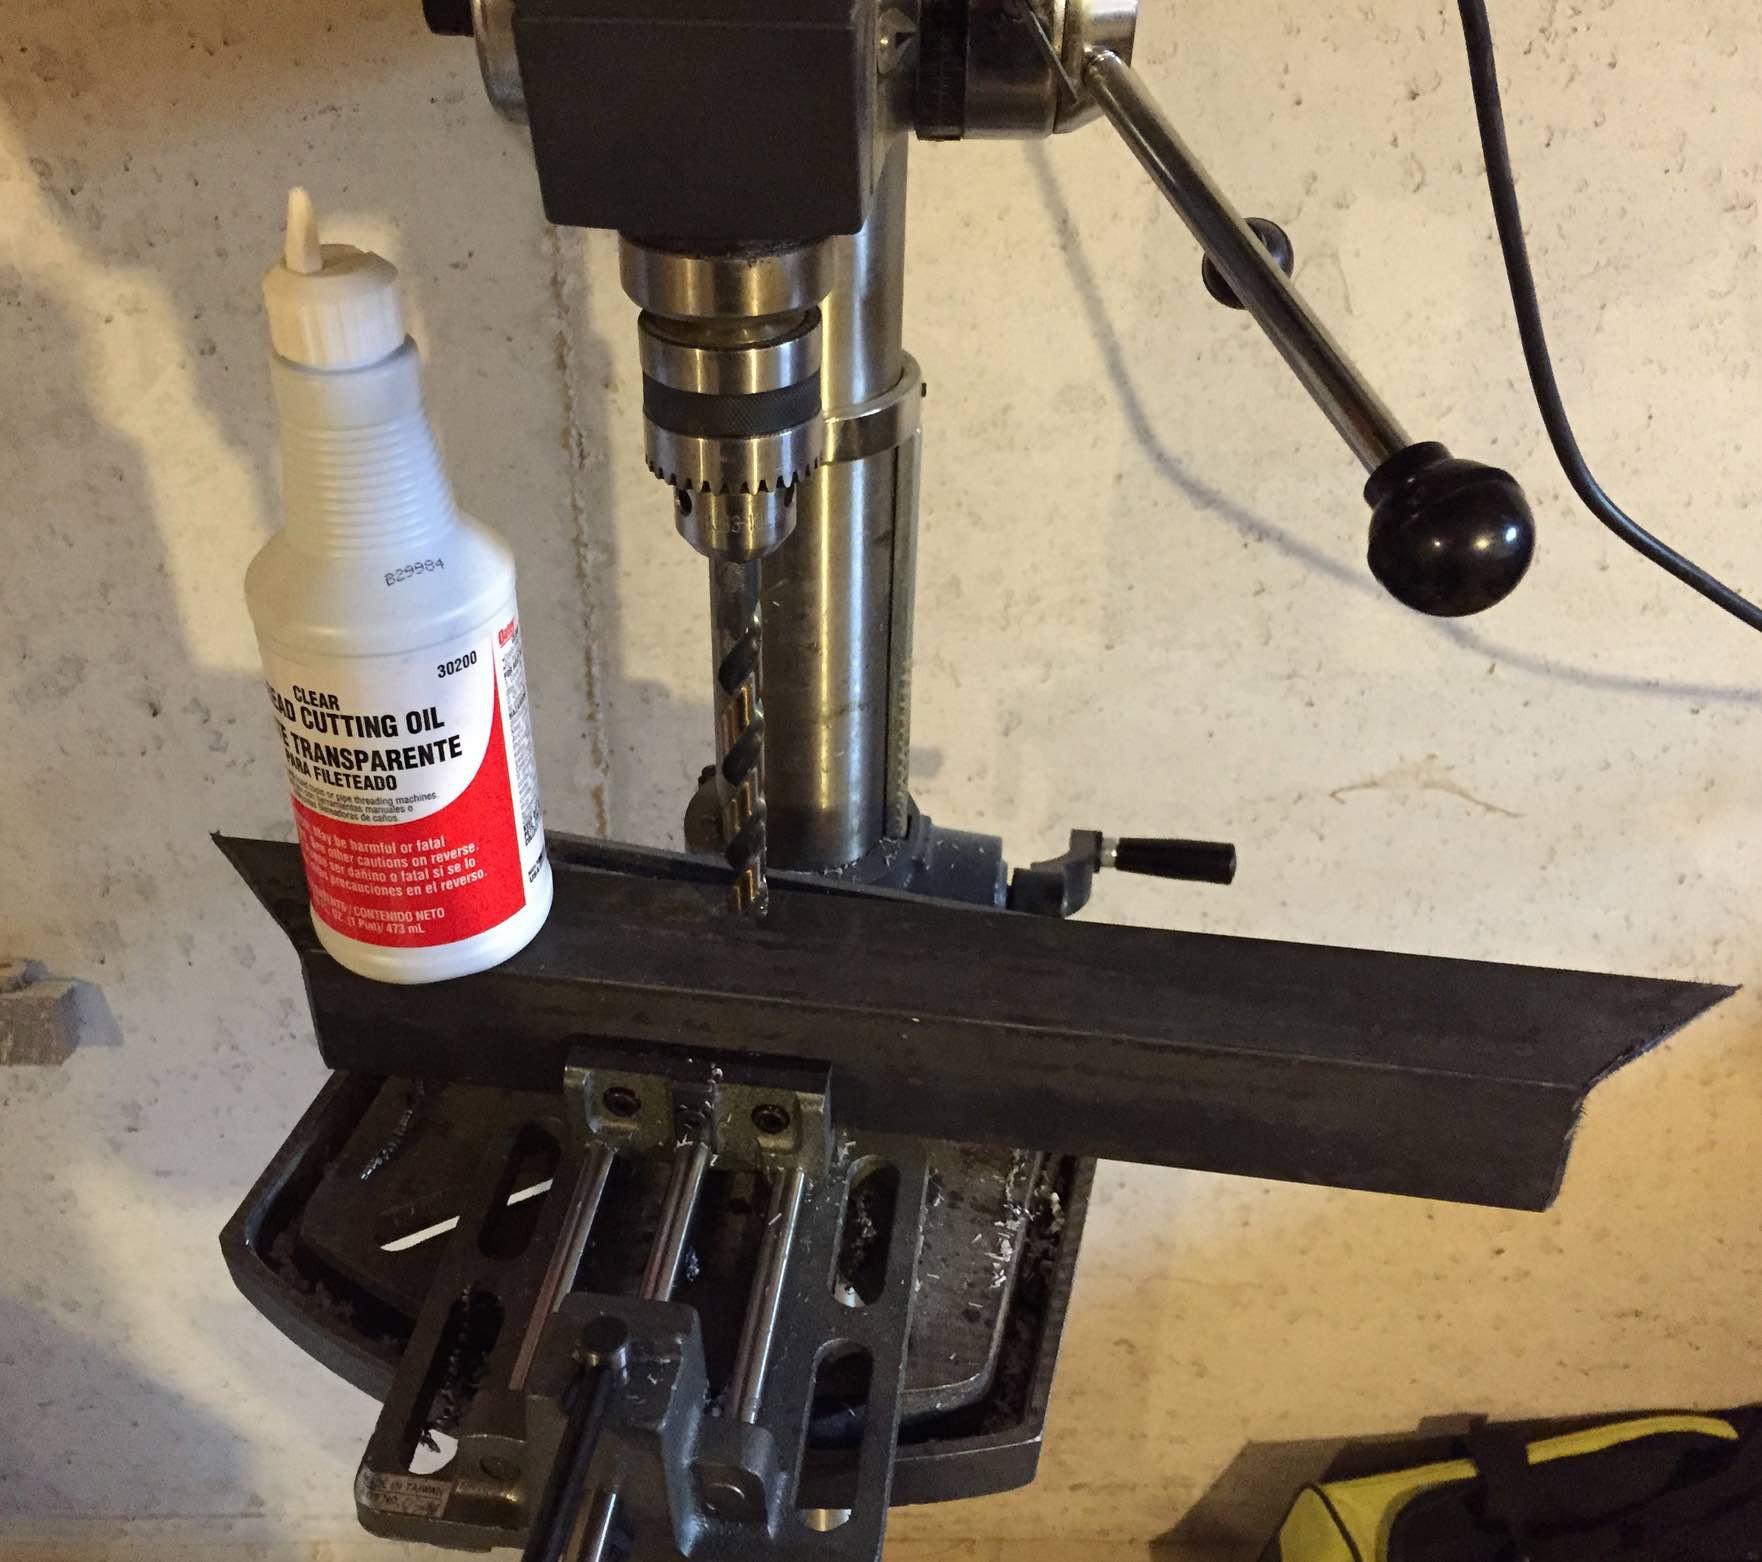
So with the Load cell in had and some preliminary testing, I started to think about how it could be mounted such that I could use it to weigh a bee hive. I ended up thinking up a U shaped bracket constructed from 2in angle iron. I purchased the raw materials from the local Menards home improvement store along with a 10in abrasive cut off wheel for my Miter saw. This was particularly handy when cutting 45 deg angles. A word of caution, if there is a sawdust catcher on your saw, make sure to take it off, I neglected to do this and mine started on fire!
![]()
Next, drill some holes:
![]()
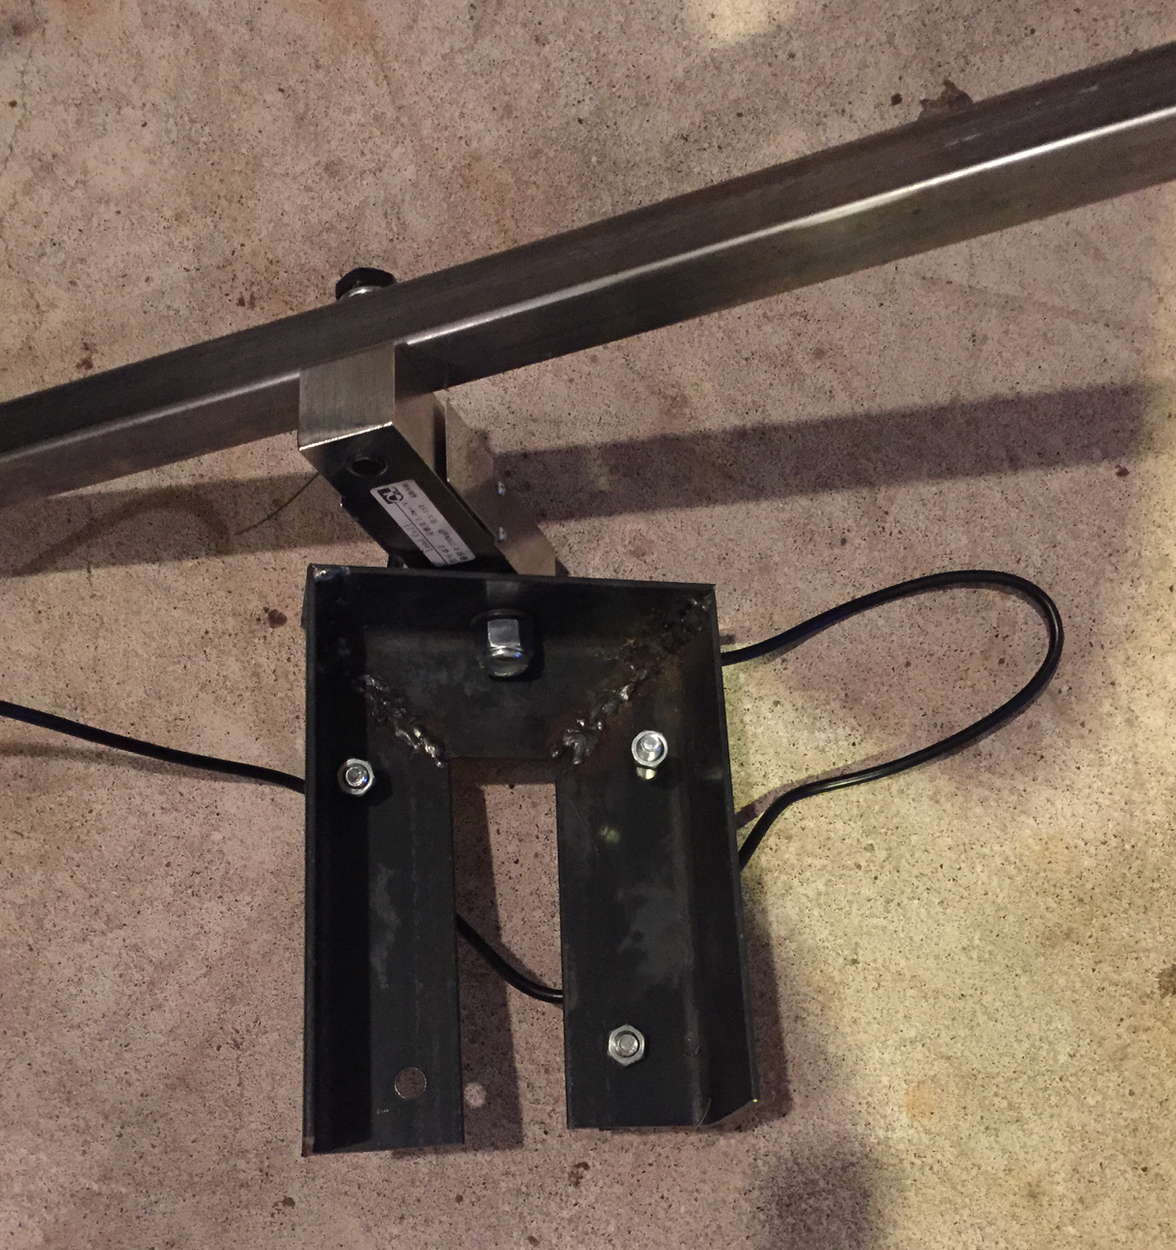
With the angle iron cut, along with another piece of square tubing (which we'll talk about later) and all of the holes drilled, it was time for the next step: welding the pieces together.
Here's a look at the final product loosely bolted together:
![]()
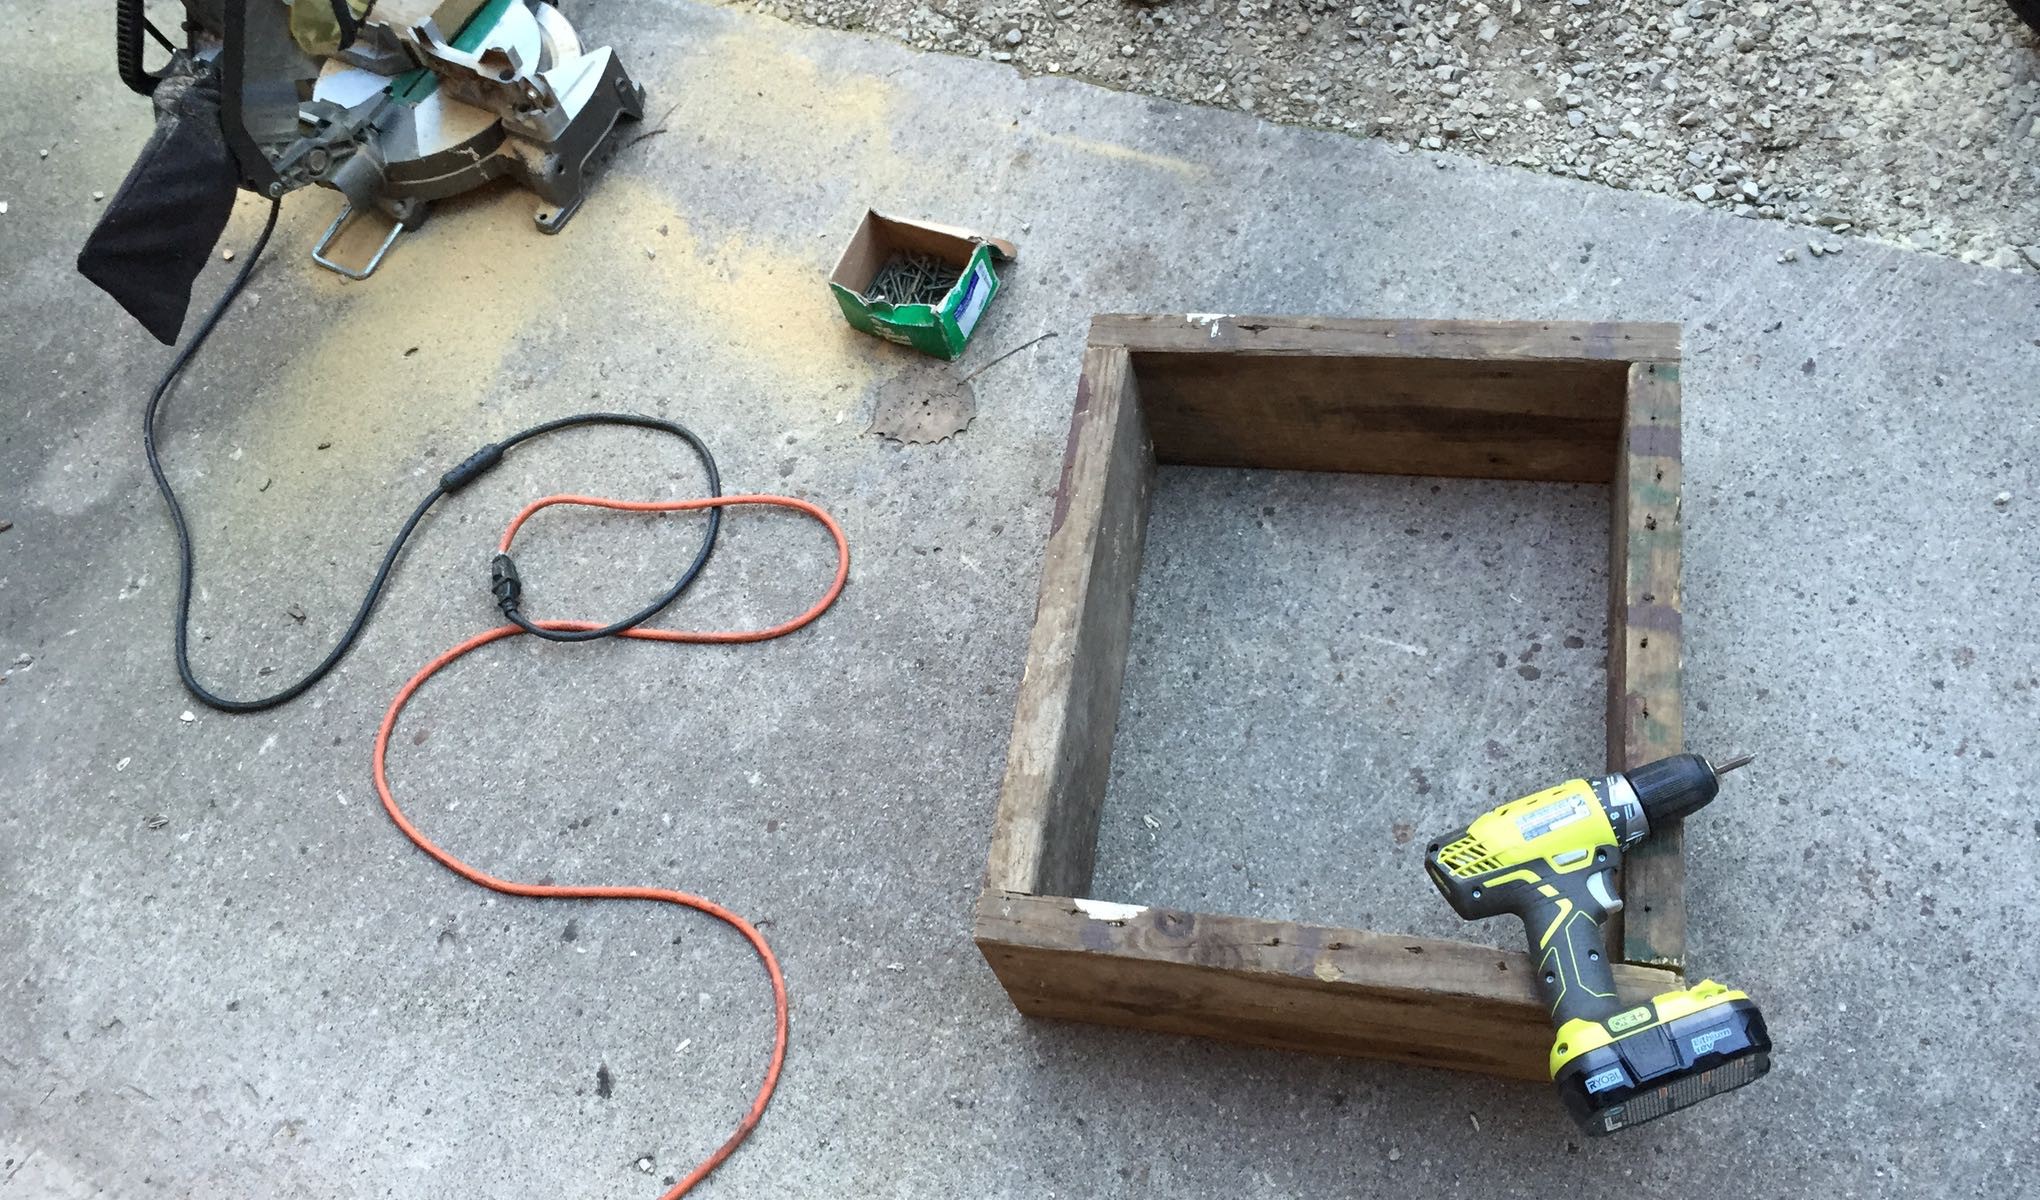
Remember that this load cell right now is simply measuring strain so the next step is to mount it to a test jig in order to calibrate it. For this I built a simple wood frame out of 2x10 lumber:
![]()
Next I used 4 carriage bolts to fasten the bracket to the frame. Also using a bubble level to ensure that everything is leveled. Looking at the video below, you can see the finished product. If you watch towards the end, I also demonstrate how downward force will be applied to this load cell.
Now I rip a 2x4 piece of lumber on the table saw to match the height of the top of the square tubing. Then I can place The bee hive frame on top of all of this as shown here:
![]()
With the frame in place it is time to begin the calibration process. This process is demonstrated in this video. In a nutshell, I place pre-weighed bricks onto the scale and record the output of the load cell vs the brick weight taken from a reference scale.
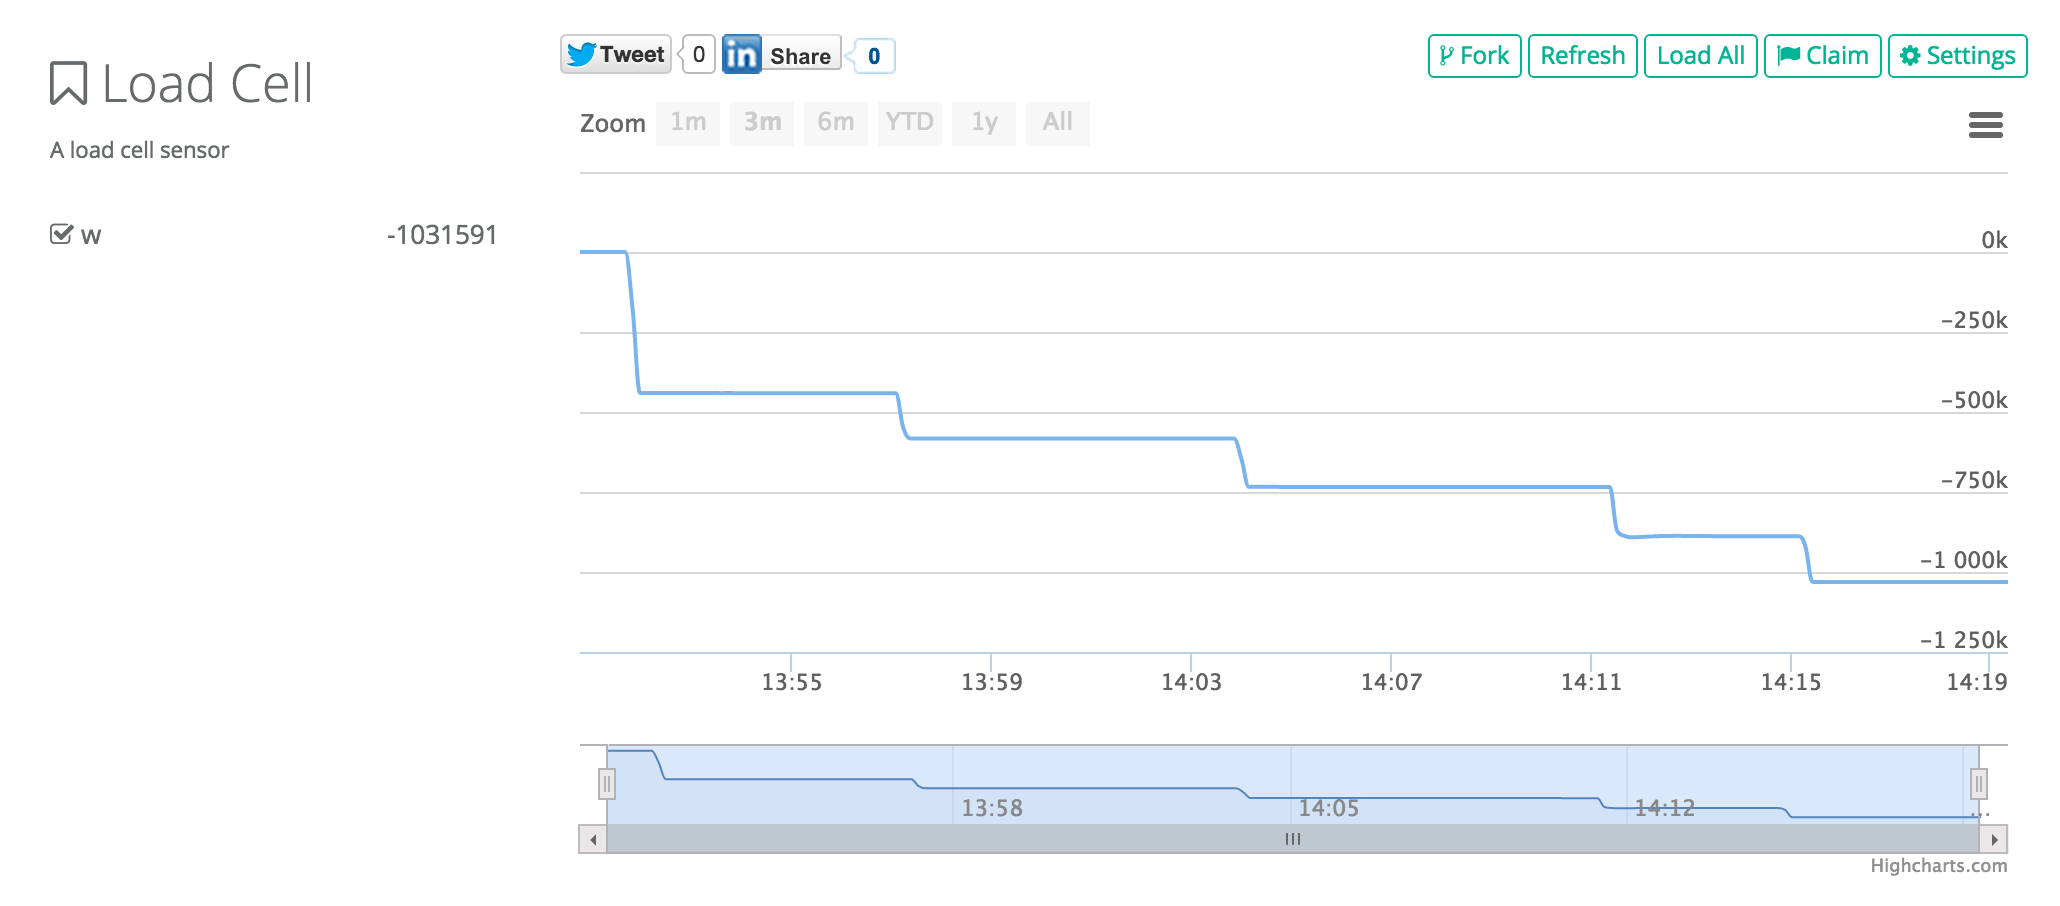
This interesting part about this process is that I am using analog.io to log the calibration values. I am doing this using a slight modification to the the code that I talked about here. This code reads the HX711 scale output, sends it to the serial port and then a NodeJS app reads from the serial port and logs the data to analog.io. After the data collection is complete, here is a time series plot:
![]()
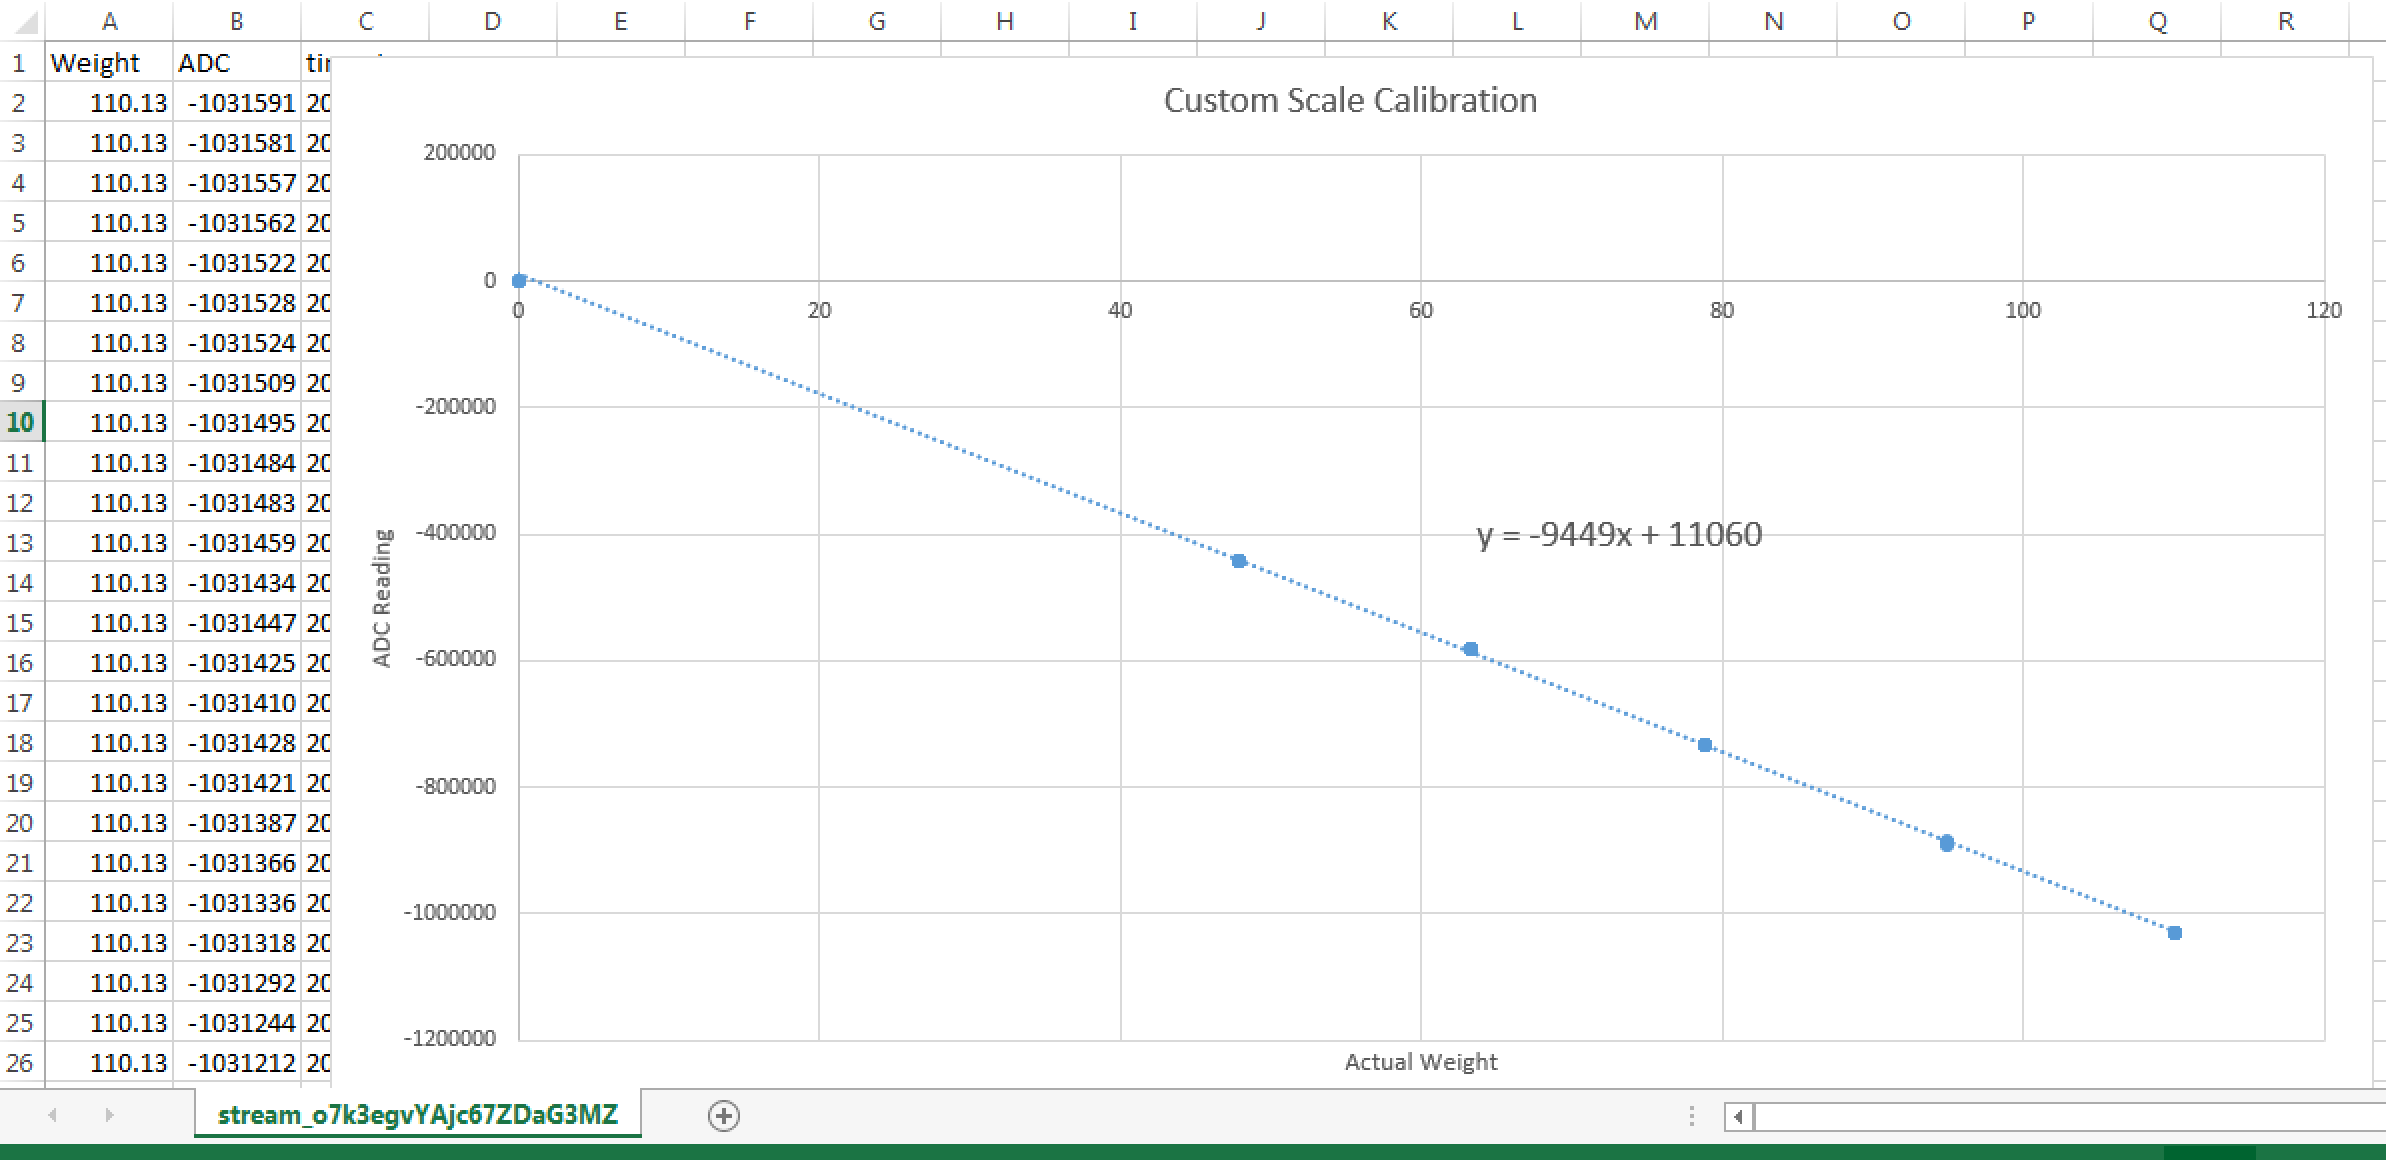
In the time plot, we can see the stair case pattern as I add weight to the scale, next I download a CSV file of the data, load it into Excel and input the known weight from the reference scale. Then I can do a X-Y scatter plot with the known weight on the X axis and the ADC value on the Y axis.
![]()
I then do a curve fit and Excel tells the linear transfer function. The last thing to do is load the function into the sensor code and we have a fully calibrated scale ready to install!
Here's the code for the scale readout:
#include "HX711.h"

// HX711.DOUT	- pin #A1
// HX711.PD_SCK	- pin #A0

HX711 scale(P2_2, P2_1);		// parameter "gain" is ommited; the default value 128 is used by the library

void setup() {
  Serial.begin(9600);
  Serial.println("HX711 Reader");
  scale.set_scale(-9450.f);                      // this value is obtained by calibrating the scale with known weights; see the README for details
  scale.tare();				        // reset the scale to 0
}

void loop() {
  Serial.println(scale.get_units(10), 1);
  scale.power_down();			        // put the ADC in sleep mode
  delay(5000);
  scale.power_up();
}
By the way, I'm using this awesome library for Arduino. -
Analog.io featured on Embedded Computing blog!
09/06/2015 at 17:52 • 0 commentsOne of the most fulfilling parts of working on analog.io is the see other users make the tool come alive and interact with it on a daily basis.
What is even better is when people enjoy it enough that they write about it in their personal blogs & tweets.
Rei Vilo who is well known both for his embedXcode extension for coding for embedded targets in Apple's XCode IDE as well as his Embedded Computing Blog has done just this.
Please take a look at his awesome review here: http://embeddedcomputing.weebly.com/iot-with-sparkfun-data-and-analogio.html
Thanks Rei & I encorage everyone to give embedXcode a try!
analog.io - A full stack IoT platform
A full stack project dedicated to easily collecting, analyzing and sharing IoT sensor data.


 What is also exciting is that for each stream,