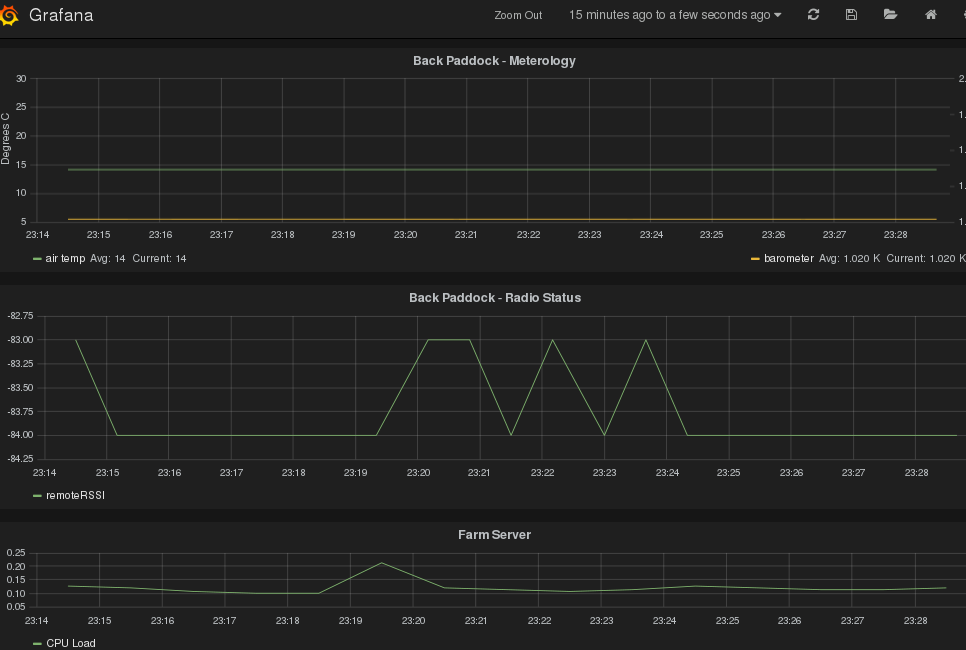
Finally. After a bit of a frustrating slog I have managed to sort out a scalable data logging and visualisation solution.
I started by at OpenHAB and then EmonCMS, which both promised a lot, but I wanted something a bit turnkey, having spent so much time in the past wasting time learning about how to build and deploy software when I just wanted to use it; and I don't know if I was looking at the wrong tutorials or what, but I couldn't get traction on either of those with an MQTT feed after spending a couple of hours... then I stumbled over Grafana.
Grafana is a a cool browser based app that provides nice visualisations on top of a graphite/carbon logging infrastructure and whisper datastore. The whole thing runs in a docker instance making it easy to experiment with and maintain. Whats really good is ti can take in other feeds as well as exporting data out and can have alerting functionality integrated as required.
So finally, we have an end to end software and hardware stack:
Microcontroller and sensors -> MQTT-SN over inAir9 LoRa 915MHz -> Embedded Linux with MQTT-SN/MQTT broker -> farm central logging on graphite with a nice and very customisable and flexible but also easy to use web interface

I couldn't wait for a few hours to get a more interesting graph... will need to post one soon though :-)
 pastcompute
Discussions
Become a Hackaday.io Member
Create an account to leave a comment. Already have an account? Log In.