Today I got some timings of how long it takes to refresh the display with both different buffer sizes and different things displayed.
Displaying the large '65' in the u8g_font_fub42n (as shown previously):
| Page Size | Timer counts | time (msec) |
| 128 bytes | 35698 | 142.8 |
| 256 bytes | 32137 | 128.5 |
I then changed to displaying a small 11 pixel '65' using the u8g_font_fur11:
| Page Size | Timer Countrs | time (msec) |
| 128 bytes | 26186 | 104.7 |
| 256 bytes | 25931 | 103.7 |
Finally, I mocked up the display to be like the one shown at the top of this project's page. I was concerned that perhaps the timer might wrap around, so I changed the division to 1/256 (thus the lower timer counts):
| Page Size | Timer Counts | time (msec) |
| 128 bytes | 9990 | 159 |
| 256 bytes | 8808 | 140 |
The time varies quite a bit between displaying small graphics and large graphics. There wasn't as much change between the large 65 and the full mockup as I had expected. The page size has some effect, but not a lot (compared to the total time, or even the time differences between small graphics and large).
Here's what the full display mockup looked like. It was neat to actually see it on the screen on not just on the PC.
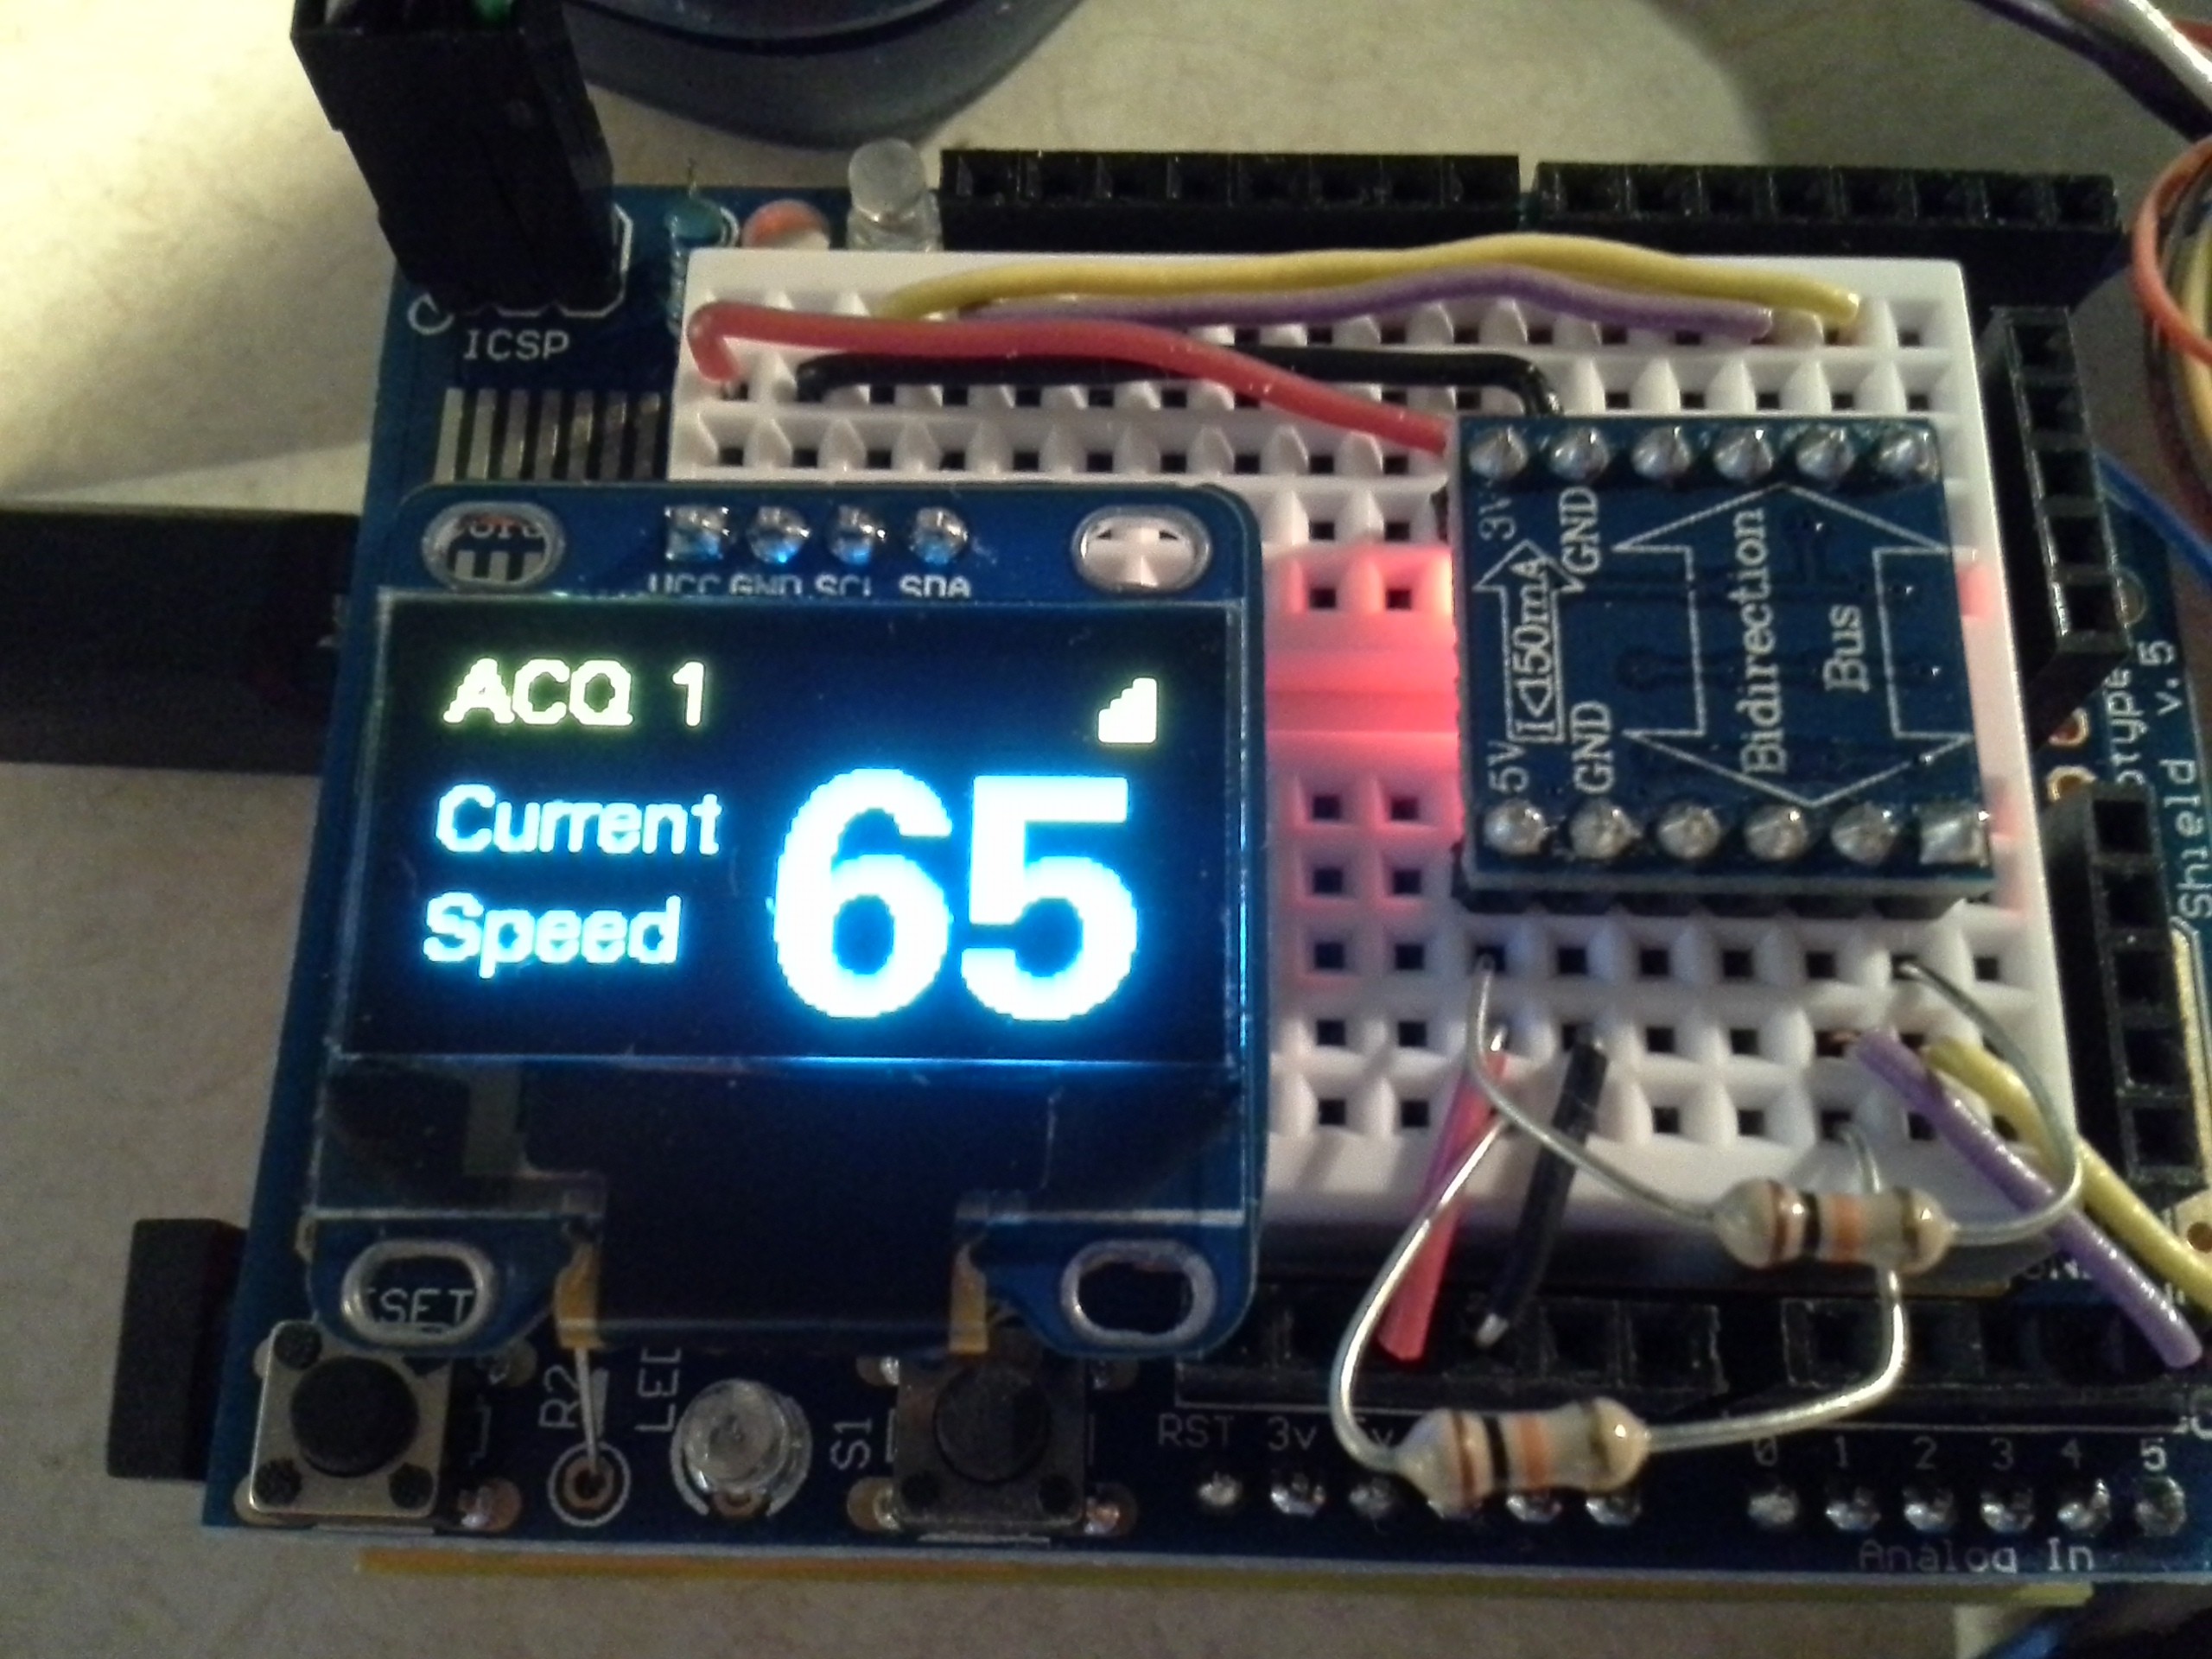
You can't see it in this photo, but the right 2 bars on the signal strength icon were hollow.
I might order the SPI version of this display and see how the timings fare with that interface. That will take a few weeks to arrive, so next I'll probably start on parsing the GPS data.
Discussions
Become a Hackaday.io Member
Create an account to leave a comment. Already have an account? Log In.