 Neil McNeight
WARNING: REAL BLOOD AND INJURIES! DON'T WATCH IF YOU ARE SQUEAMISH!
(and it's a link because the video owner has prohibited it from being viewed outside of YouTube)
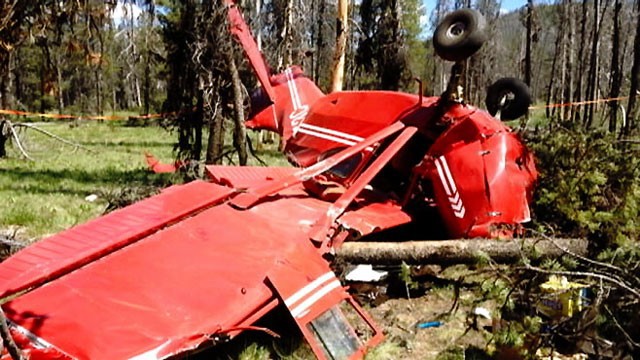
The bloody stuff doesn't start until the 5 minute mark, but you've been warned. Fortunately, nobody died in this accident, but it's still pretty bad. One major injury, three minor injuries, and one airplane (see above) rolled up into a ball (see below).
When this video first came out in August of 2012, I looked up the preliminary report from the NTSB and found at the bottom the weather information from the nearest weather station. Even though the station was 44 miles away from the crash site, it provides useful insight into the conditions in the area. I did a quick back-of-the-napkin calculation of the density altitude at the time of the crash:
6,370' altitude
27°C / 3°C
30.00 in Hg
========
9167' density altitude
To translate my shorthand, the numbers are:
- Field Elevation (not included when I first read the report, but available from sites such as airnav.com)
- Temperature in Celsius / Dew point in Celsius
- Atmospheric Pressure in inches of Mercury
- The density altitude I came up with at the bottom
According to the final report, the pilot "checked his performance charts and calculated that the density altitude was about 9,200 feet; this was 3,200 feet above the 6,000-foot maximum altitude listed in the takeoff performance charts." Now, a density altitude gauge isn't going to automatically force you to use to the performance charts for your aircraft. But it will give you the information you need if you choose to do so.
For more detailed information about this crash, you can search for NTSB ID WPR12LA283