 Bruce Land
A technique for sharpening the
spectrogram uses information from the phase spectrum to sharpen the amplitude spectrum.
The scheme locates simple sinusoids, linear chirps, and impulses at the correct frequency or
time with a higher resolution than the inherent FFT resolution tradeoffs. The basis of the calculation is that the
instantaneous frequency (IF) in each FFT frequency band is equal to the first time derivitive
of the short-term FFT (STFT) phase at frequency ω and time T:
IF = ∂/∂t(arg(STFT(ω,T)))
and the local group delay (GD) at frequency ω and time T is approximately
GD = ∂/∂ω(arg(STFT(ω,T)))
where the function arg returns the phase angle of the transform (see Fulop).
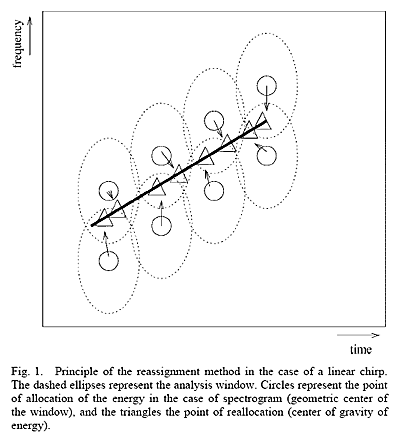
Chassande-Mottin, et.al. show that reassignment is equivalent to moving energy up the local gradient of intensity of the spectrogram (for Gaussian windows). This higher precision does not violate basic time/frequency uncertainty (see Gardner and Magnasco). There is still mixing between reassigned frequencies or impulses which are close together. Plante, et.al. illustrate this with a nice figure shown to the left. Each elipse represents one frequency-time cell of the STFTs which make up a spectrogram. The energy in the cell is is placed at a location determined by the IF and GD.
An online matlab reassignmentt code (Fitz, 2008) was modified for faster rendering and more straightforward selection of minimum plotting amplitude and rendering method. The modified raspecgram and ratoplot (called by raspecgram) produce a reassigned spectrogram, but require a few other routines from the Fitz site. The code runs in Gnu Octave as well as matlab. There is also reassignment code at mathworks.
Examples show the effect of the reassignment.
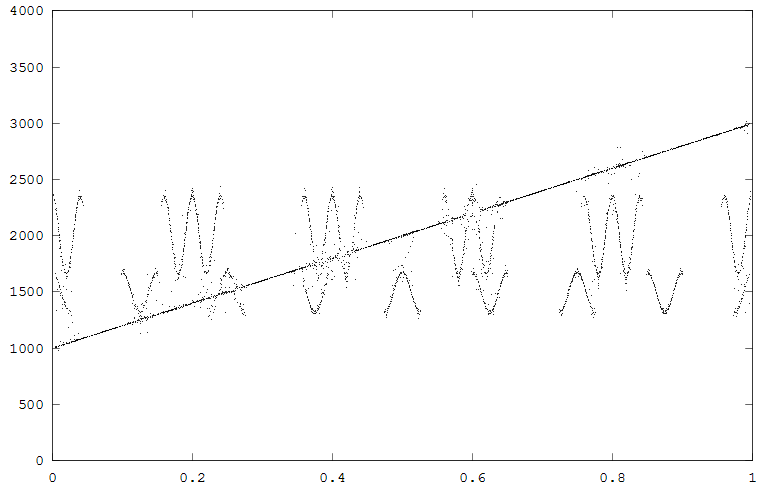
The first example
generates two FM signals, with a superimposed linear chirp. The
waveform and spectrogram are shown the the first figure, the reassigned
spectrum in the second figure. Note that in much of the reassigned plot
the FM signals and chirp are well localized, but when they approach each
other some scattering occurs. Scattering can be optimized (as usual in a
spectrogram) by changing the size and overlap of the FFTs used to
produce the results. The reassigned spectrogram was rendered using one
color for all points above an energy amplitude cutoff. The rendering
mode is refered to in the code as fast. The rendering mode format is method_size_marker. For instance fast_1_dot, color_3_circle, color_1_circle are all valid. Valid methods are fast/color. Valid markers are dot/circle.
Waveform and spectrogram of the test signal.

Reassigned spectrrogram of the test signal.
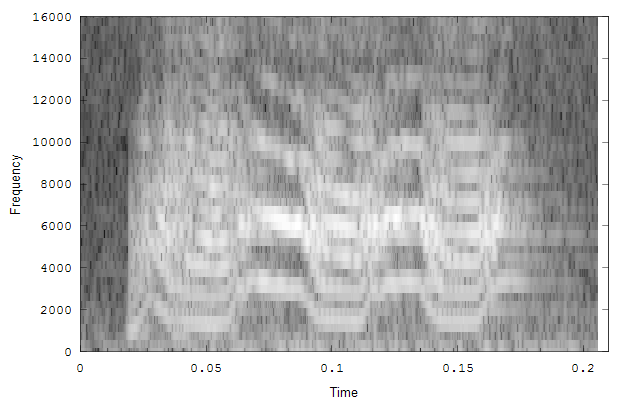
The second example
is a nestling green-rumped parrotlet (Forpus passerinus) begging call
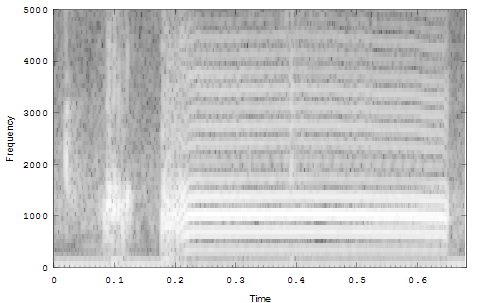
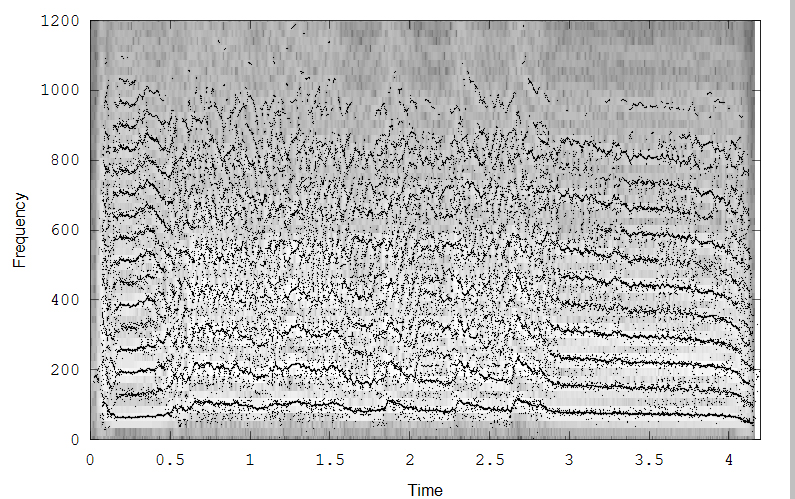
(thanks to Karl Berg) with a complex multiharmonic, FM structure. The
spectrogram of a short segment is shown in the first figure, the
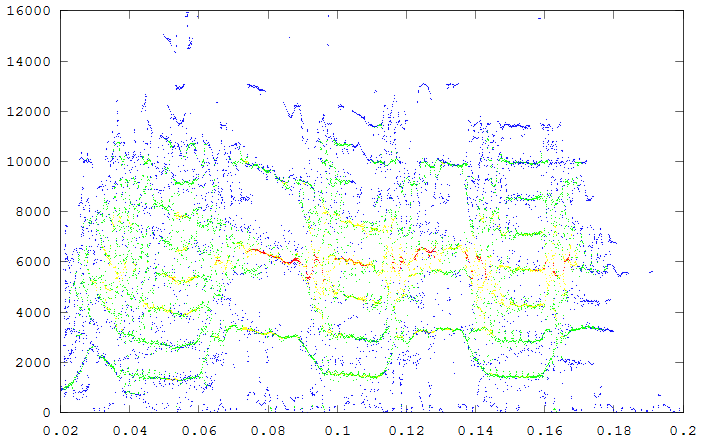
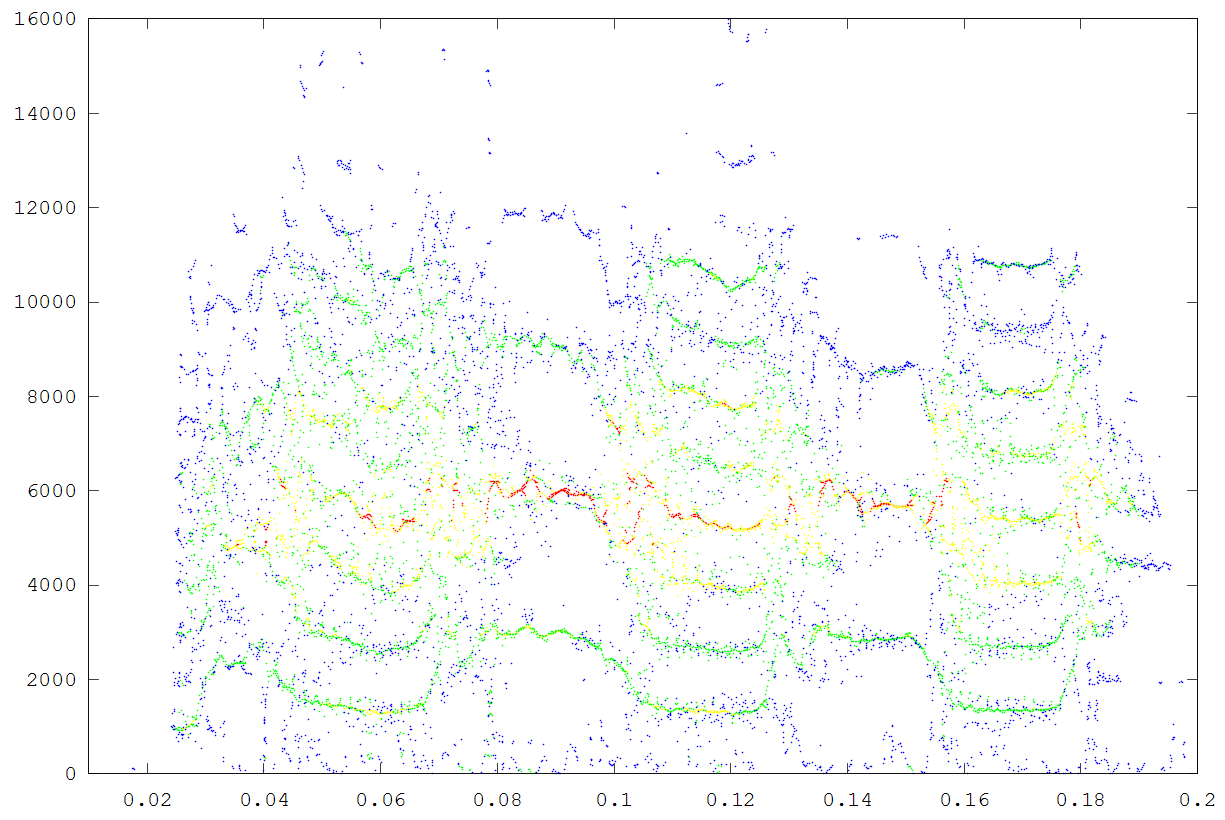
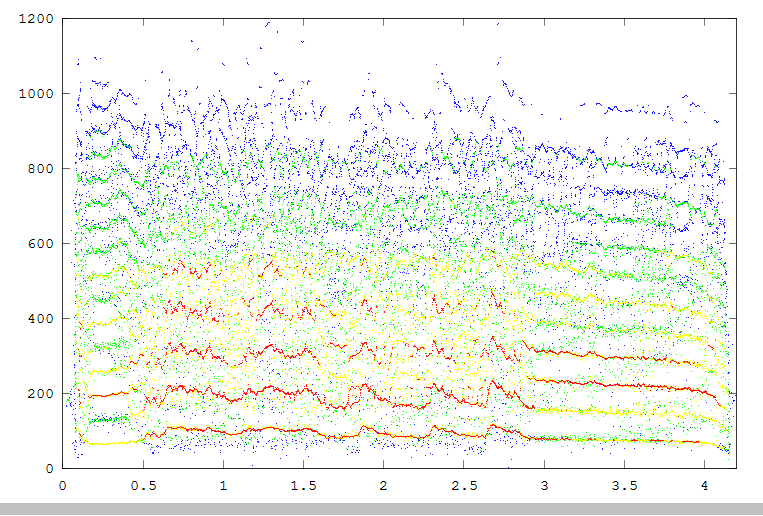
reassigned spectrum of one vocal burst in the second figure and another
in the third figure. The reassigned spectrogram shows a lot of detailed
FM which is hard to discriminate in the original spectrogram. There is
enough similarity between the two vocal bursts (and enough coherent
structure in each image) to suggest that much of the fine detail
revealed is real. The reassigned spectrogram was rendered using four
colors for points in four log(energy) bins above an energy amplitude
cutoff. Red is highest energy, then yellow, green and blue. The
rendering mode is refered to in the code as color_1_dot.
Spectrogram of a short segment of the parrot song.
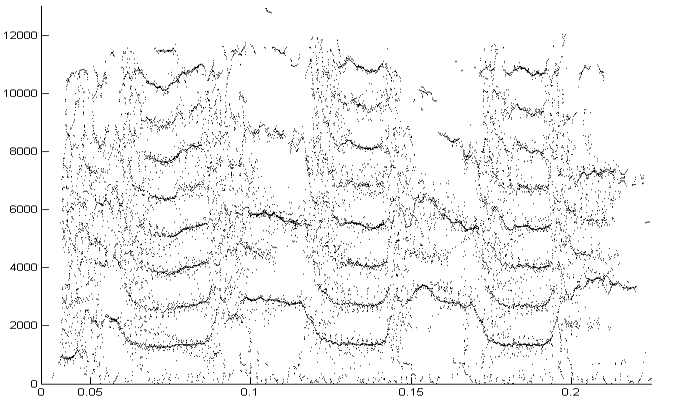
Reassigned spectrogram of the above segment
A second segment of the same song to show repeatbility. (click to enlarge)
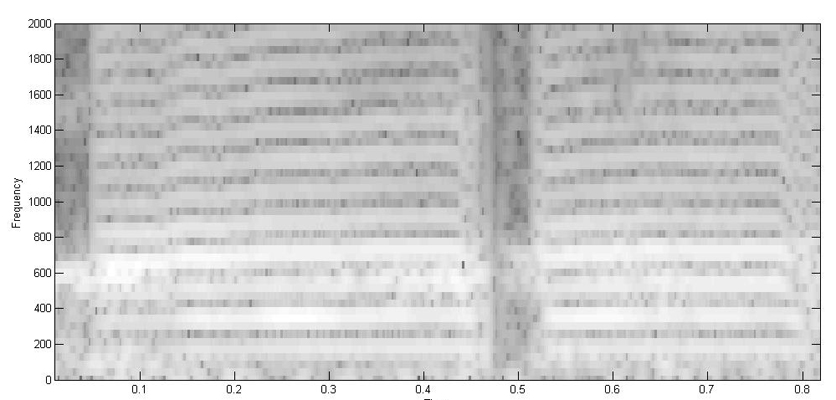
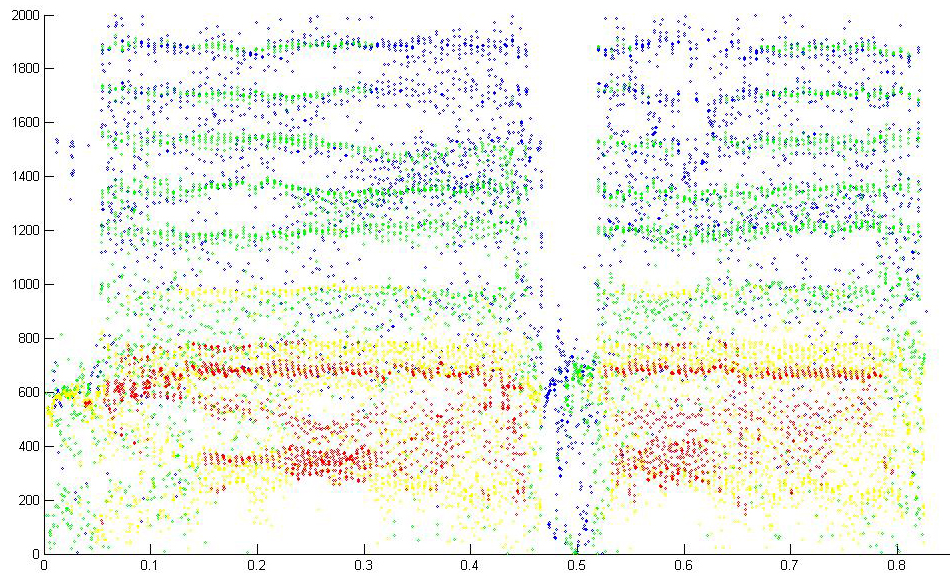
The third example is a boat-whistle call of the gulf toadfish (Opsanus
beta) (Thanks to Luke Remage-Healey and Aaron Rice). The sound is a
short noise burst followed after a pause by steady, harmonic-rich hoot.
The image pair shows a short segment analysed with a 512 point STFT and
90% overlap of STFTs. The standard spectrogram is to the left and
reassigned spectrogram to the right (click to enlarge).

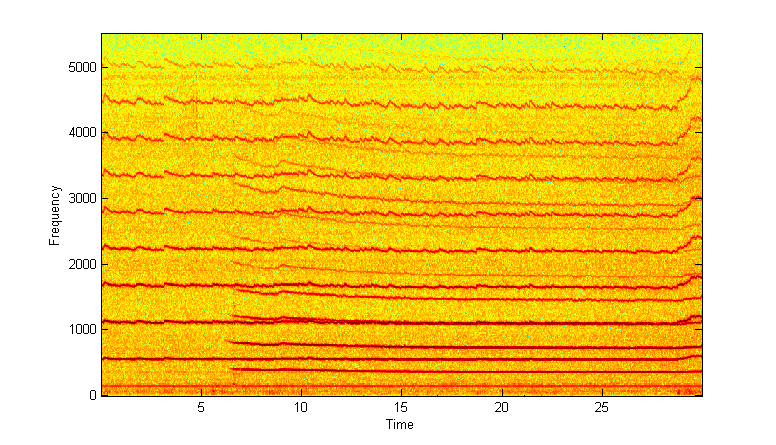
The fourth example is Midshipman growl.
The three images (all clickable for more resolution) show the
spectrogram (2048 point FFT, overlap of 0.9), reassigned spectrogram,
color coded by intensity, and an overlay of all the reassigned points
superimposed on the spectrogram.
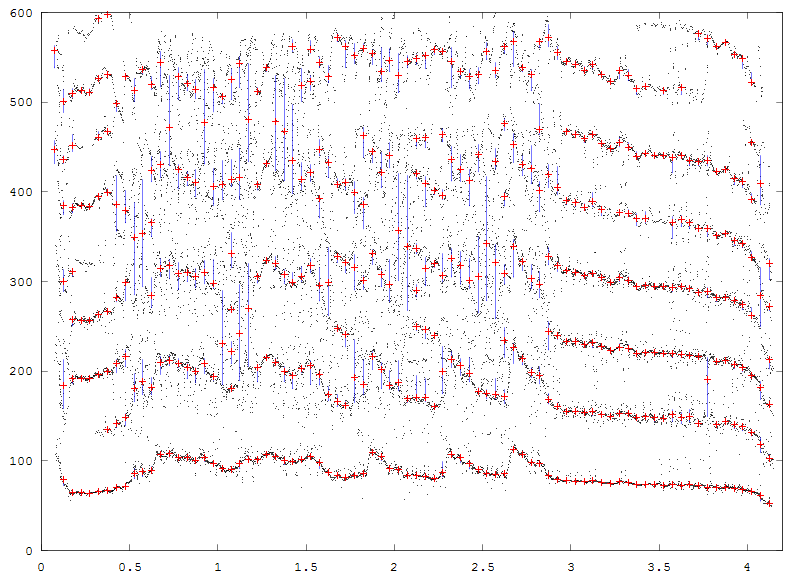
A further modification of the reassignment code, raspecgram, modifies the way data is returned to make it easier to interface further analysis. A first attempt at producing error bands for the reassigned energy does the following:
- Divide the signal into time bins with a width settable by the user.
- Within each time bin, detect large frequency jumps in the list of reassigned frequencies. The size of the detected jump is settable.
- For each list of frequencies between every set of two large jumps (a group of frequencies) make sure there are some minimum number of actual frequencies. The number is settable.
- Calculate the median, first quartile and third quartile for each sufficiently large group and plot them.
The output of an example program
is shown below. The medians are red crosses, the quartile ranges
plotted as blue lines. The time bin is 0.05 seconds, the gap detected is 0.5*(FFT freq bin) and the minimum number in a group is 15. The signal is the same as the previous example.
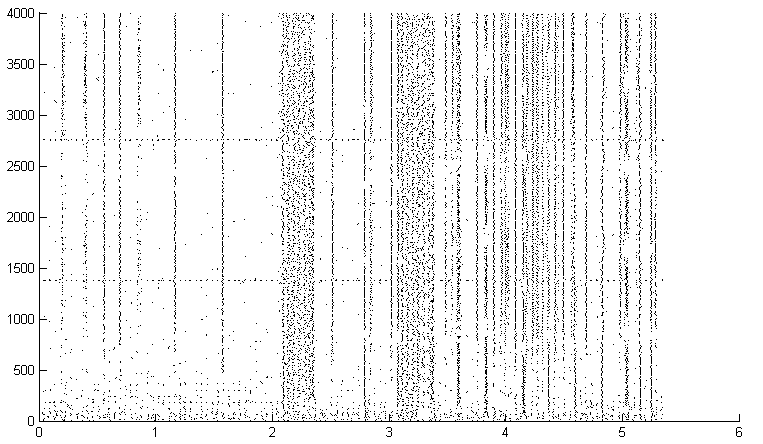
A fifth example is from an electric fish.
Waveform:

Spectrogram:

Reassigned:
Another example is from a toadfish agonistic call. The fish has two different size swimbladders. (Rice and Bass 2009)
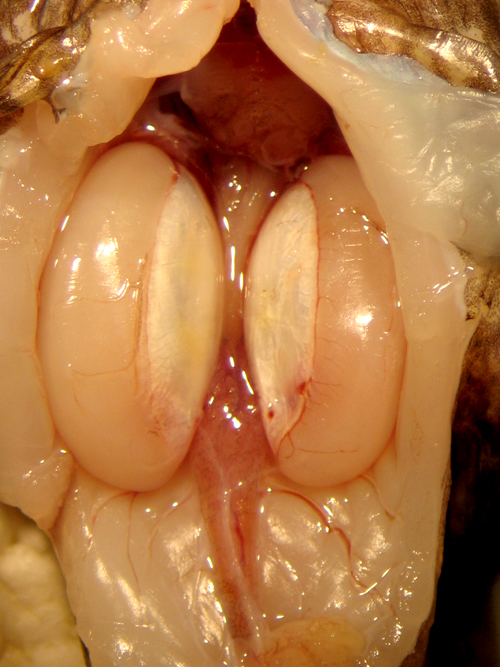
Spectrogram:
Reassignment 1024 FFT

Reassignment 256 FFT
Reassignment detail 256 FFT

Reassignment detail with more overlap 256 FFT

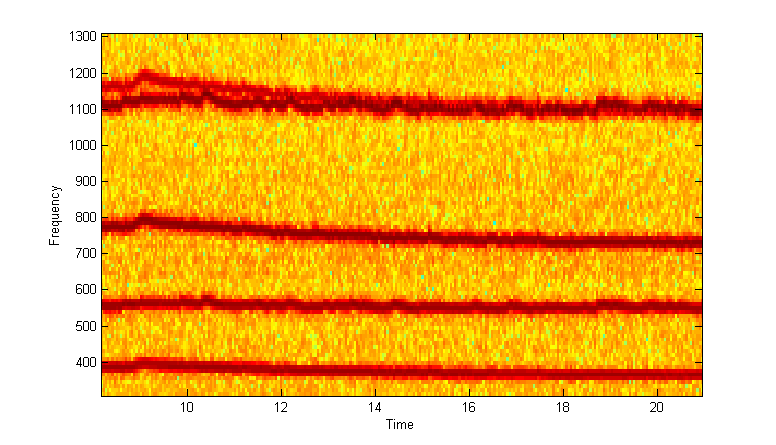
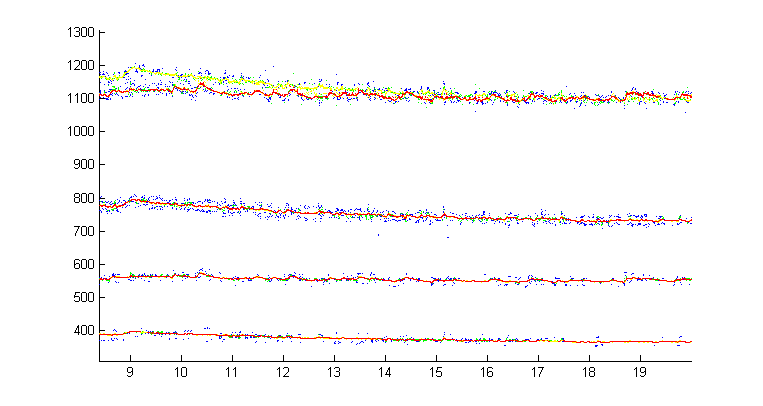
Mosquito harmonic convergence (Lauren J. Cator, et.al.) data frm BJA. Male and female match the male's second harmonic to the female's third harmonic. Details of frequency tracking may be better seen using RA techniques.
Spectrogram
RA set at 1024 sample FFT and 90% overlap

Zoomed versions to show overlapped harmonics and fundamentals.
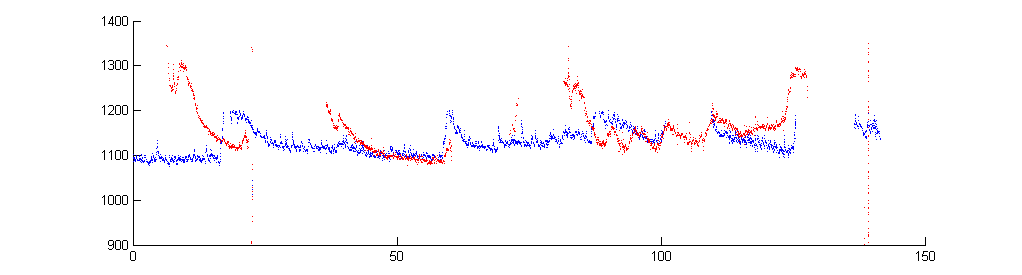
In the next image, the male and female fundamentals were isolated based
on frequency for the whole song, then the male fundamental was
multiplied by 2 and colored blue, while the female fundamental was
multiplied by 3 and colored red. It is much easier to see the overlaps
and trajectories of the two sounds (including the best tracking in this
sample around 50 seconds). Code is here.
References:
Kelly Fitz, Time-Frequency Analysis, 2008. Site includes code distributed under GNU public license.
Stephen Hainsworth, Malcolm Macleod, Stephen W. Hainsworth, Malcolm D. , Time Frequency Reassignment: A Review and Analysis, Macleodhttp://www-sigproc.eng.cam.ac.uk/~swh21/tfrrep.pdf ---or--- S.W. Hainsworth and M.D. Macleod, Time-frequency reassignment: a review and analysis, Tech. Rep. CUED/FINFENG/TR.459, Cambridge University Engineering Department, 2003.
E. Chassande-Mottin, I. Daubechies, F. Auger and P. Flandrin, Differential Reassignment, IEEE SIGNAL PROCESSING LETTERS, VOL. 4, NO. 10, OCTOBER 1997
Fulop, Sean A., Algorithms for computing the time-corrected instantaneous frequency (reassigned) spectrogram, with applications, The Journal of the Acoustical Society of America, vol. 119, issue 1, p. 360
F Plante, G Meyer, WA Ainsworth, Improvement of speech spectrogram accuracy by the method of reassignment, Speech and Audio Processing, IEEE Transactions on, Vol. 6, No. 3. (1998), pp. 282-287.
Timothy J. Gardner and Marcelo O. Magnasco, Sparse time-frequency representations, PNAS, vol 103 #16, pp 6094-6099, www.pnas.org/cgi/doi/10.1073/pnas.0601707103
Lauren J. Cator, Ben J. Arthur, Laura C. Harrington, Ronald R. Hoy, Harmonic Convergence in the Love Songs of the Dengue Vector Mosquito, Science DOI: 10.1126/science.1166541
Rice, A. N., and A. H. Bass. 2009. Novel vocal repertoire and paired swimbladders of the three-spined toadfish, Batrachomoeus trispinosus: insights into the diversity of the Batrachoididae. Journal of Experimental Biology 212:1377-1391.