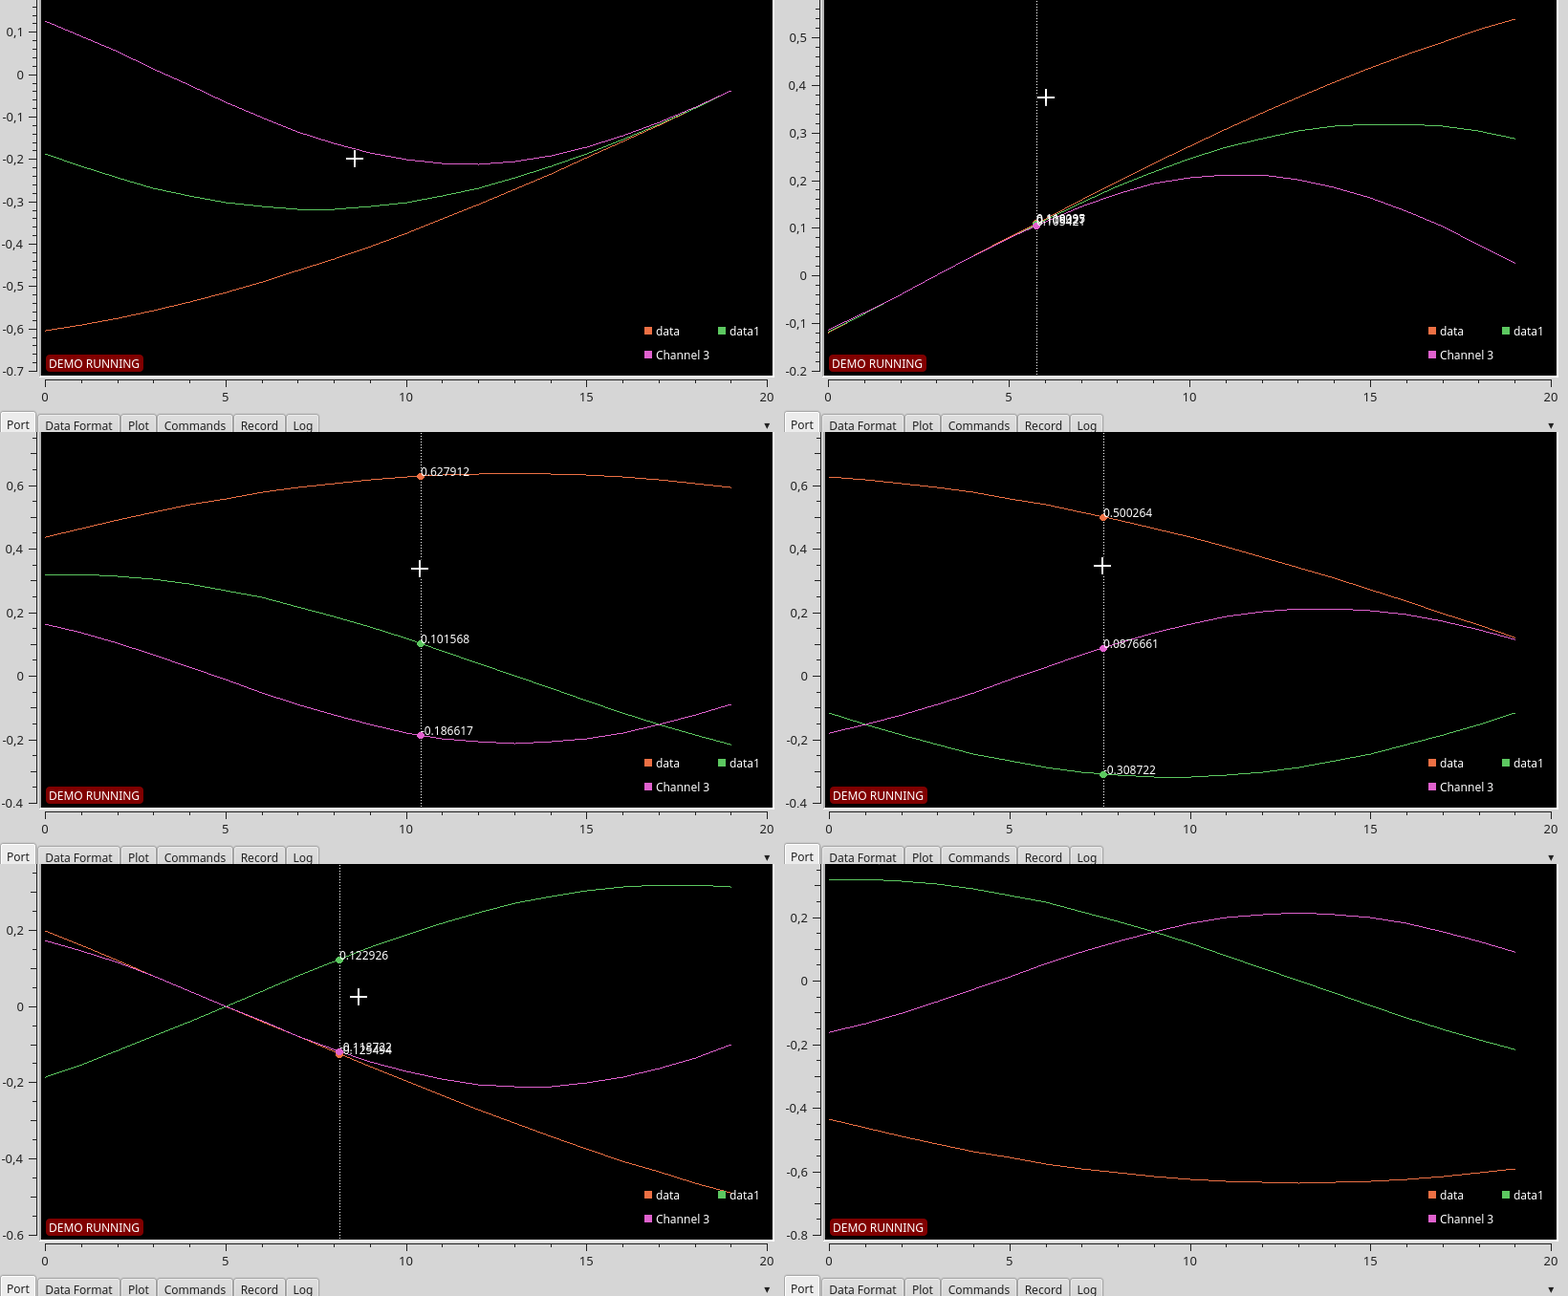
Sample value tracker development in progress
A project log for SerialPlot - Realtime Plotting Software
Small and simple software for plotting data from serial port
A project log for SerialPlot - Realtime Plotting Software
Small and simple software for plotting data from serial port
Discussions
Become a Hackaday.io Member
Create an account to leave a comment. Already have an account? Log In.
Hi, How do you specify the value to be tracked? I'm sorry if this sounds stupid, but I can see the data I want to show graphically in the log tab, but can't figure out where to specify it in ASCII to be shown on graph.
When I choose binary, the graph shows random values, but can't find documentation on telling serialplot which values to plot.
Any help would be much appreciated. Kind regards,
Are you sure? yes | no
Excellent! This is what I want for a serial data plotting software. How can I use this tracker in SerialPlot v0.10.0?
Are you sure? yes | no