 Arkadi
I have done some tests with the platform and have plot results to show for (recorded in real time at 100 Hz).
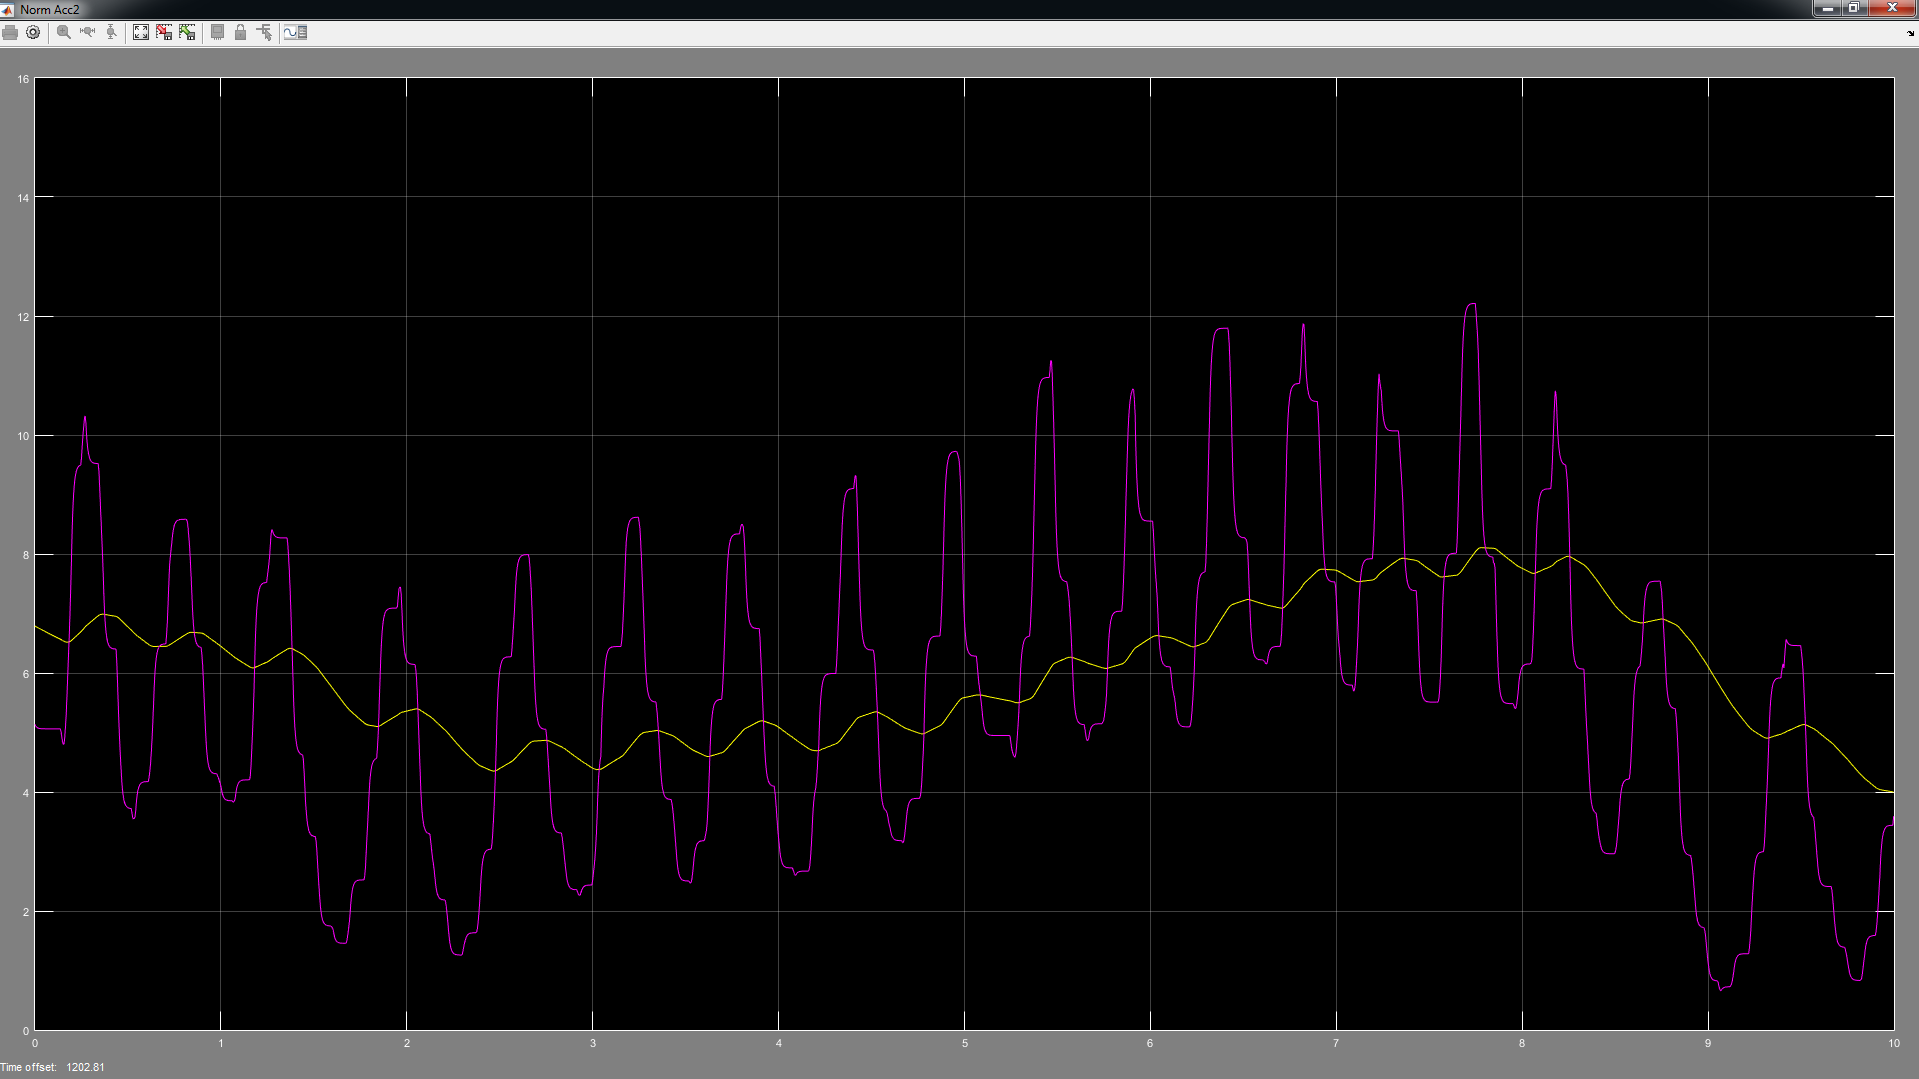
First image demonstrates filter effects on the measured acceleration, for the test i have put the ball in a plastic bag and rotated it in the vertical plane resulting in the effect seen in the graph. As you can guess the purple line represents raw data and the yellow one, is the filtered data with a simple LPF filter at time constant of 1 second. (the graph scale is in g`s)
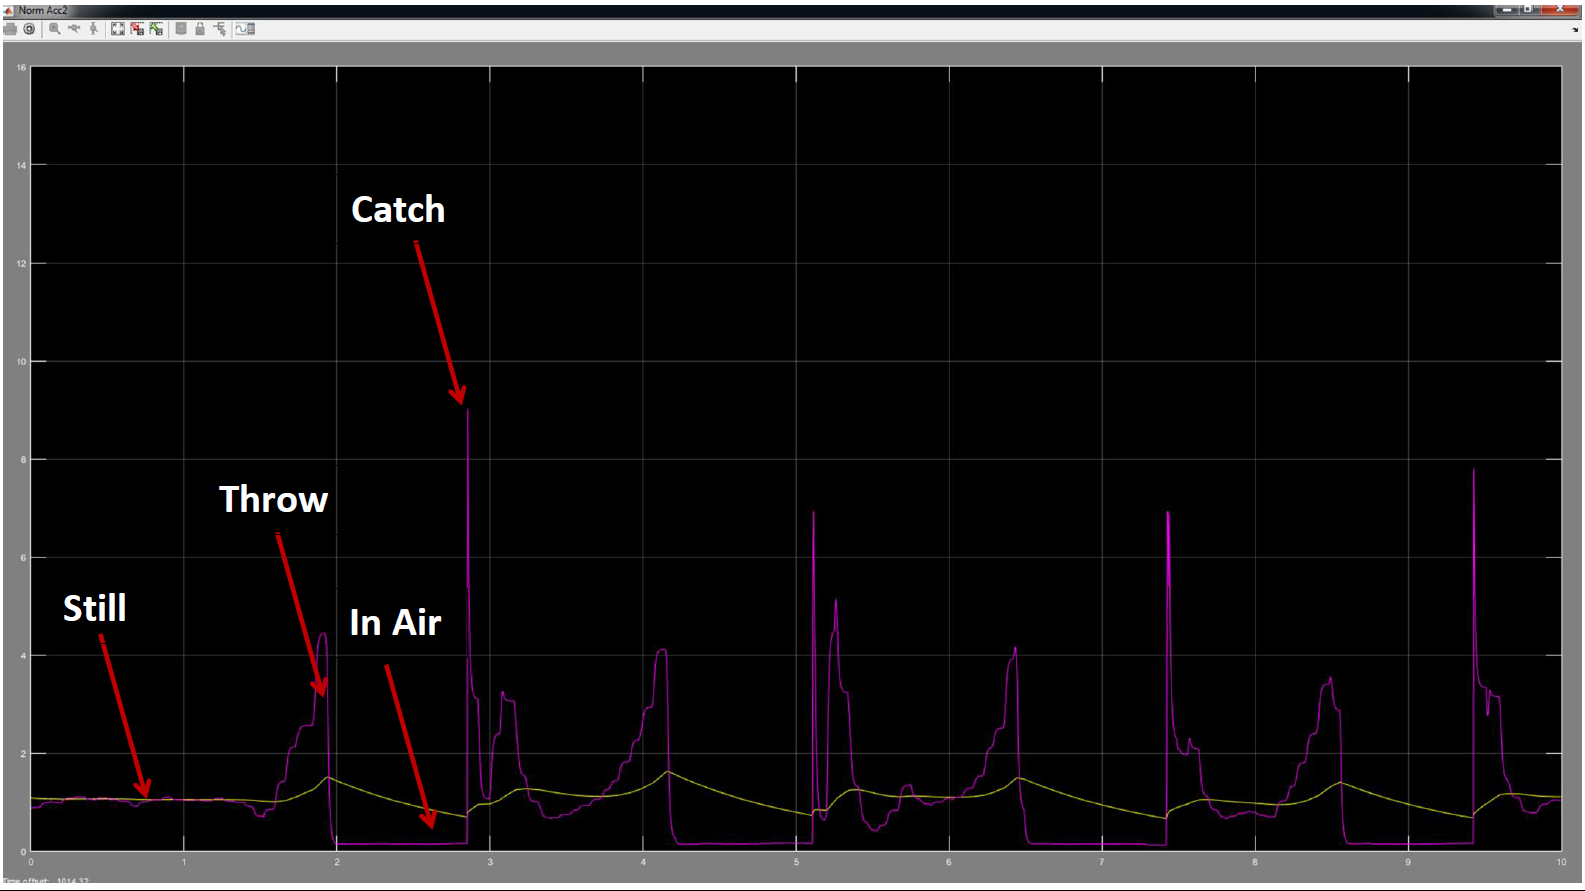
After that i have decided to play some throw and catch. (the graph scale is in g`s).
And for the finish i have decided to test how precisely i can calculate the length of my plastic bag based on the readings of the gyro and the accelerometer. (Centrifugal force)
 (image is taken from this site.)
And my results: (the graph units is deg/sec for the gyro, accelerometer at g`s. and length in meters).
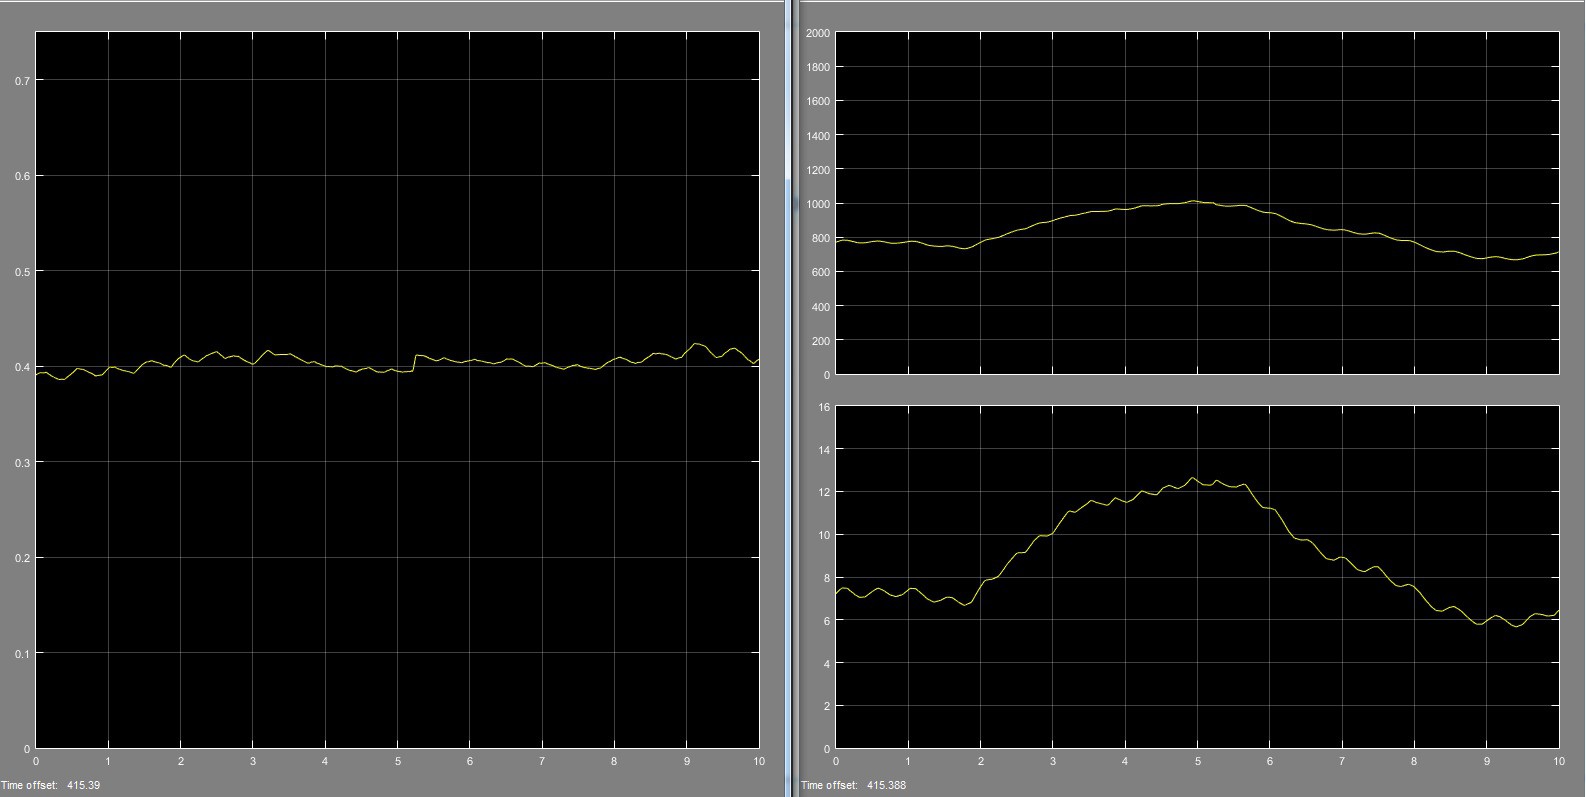
Surprisingly (and maybe not) the length turned out to be pretty accurate and as you can see i have played with the rotation velocity).
So go grab your plastic bag, and do some experiments. (be careful, i managed to bump the ball into my head while trying to press the print screen).
Discussions
Become a Hackaday.io Member
Create an account to leave a comment. Already have an account? Log In.