Close
0%
0%

Python Powered Scientific Instrumentation tool

A multi purpose lab tool accessible by simple Python functions, and capable of studying a wide range of physical phenomena.

Similar projects worth following
This project was started with the objective of providing an affordable, yet wide collection of measurement and control tools for the curious ones among us.

To put it simply, it uses a microcontroller with a fairly powerful set of peripherals, and complements it with a variety of analog and digital tools such as programmable gain amplifiers, waveform generators, LCR meter, CC sources etc. All functionality is controlled via a Python module that runs on the PC to which the device is connected via USB. Digital communication ports allow addition of add-on boards.

A flexible set of tools have been packed into one tightly integrated unit in order to enable students to explore experiments across the sciences.

The hardware is supplemented by powerful Python modules like Scipy whose data processing abilities help extract meaningful parameters from the acquired data

On the blog:

Production version here : This project has been adapted for mass production, and packaged along with an SBC running the necessary software.
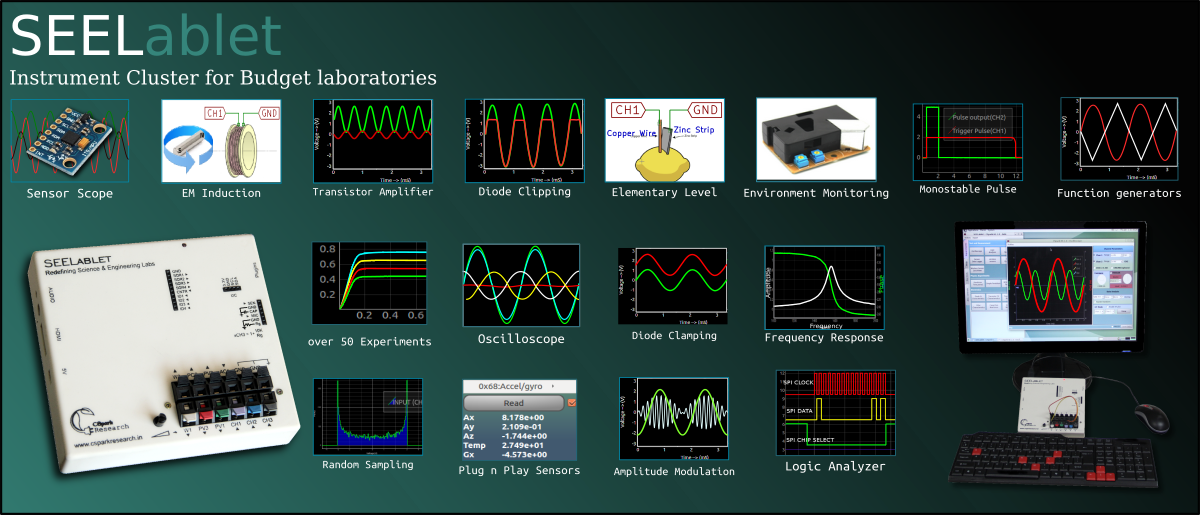
The software has over 70 different experiments, and a custom experiment designer.


Quarterfinal Video

Project logs!

Non contact, Short range position sensing. 10um resolution

Amplitude modulation with AD633

Calibrating with a 24-bit ADC and a Keithley 2100 multimeter

Developing a 24-bit ADC, 18-Bit DAC add-on

Wireless Node A . Wireless Node new

Plug and play arduino sensors for science experiments

Designing Laser cut enclosures

Prototype #5

Bandpass filter bode plots

Prototype #4 - 555 timers, IR sensors, wavegens.

Prototype #3

The very first board!

Here are a few short clips of some of the experiments carried out using this tool

A) Measuring the forward threshold voltage of a diode, and studying the effect of temperature on the band gap.

Several IV plots were obtained and plotted along a third axis as a 3D line plot. The diode was heated somewhere in the middle of the acquisition ( notice the inflection point ), and this added thermal energy changes the band gap, causing the threshold voltage to drop.

B) Characterizing an active band pass filter

An op-amp based multiple-feedback band pass filter was made with values calculated from simulation tools available at http://sim.okawa-denshi.jp/en/OPtazyuLowkeisan.htm . The transfer function was experimentally determined using the device's waveform generator, oscilloscope, and curve fitting routines from scipy.

*The PIC1572 based PWM waveform generators have since been replaced with a high resolution DDS, the AD9833.

C) Supporting a variety of SPI/I2C/UART protocols allows accomodating a variety of sensors in a plug and play fashion. A wide range of modules such as accelerometers, gyros, doppler radars, weighing sensors etc have been tested.

D) Inexpensive wireless nodes with unique addresses can be used to implement mesh networks for data collection. The wireless nodes are configured to use 3 byte addresses, and this leaves plenty of room for multiple sensing points/parameters.

The following is a demo with the MPU-6050( accelerometer + gyro + temperature sensor) used in the above video, except here the data transmitted back is being used to orient a 3D object in real time. IC temperature decides the object shading gradient.

The third prototype was presented at http://Scipy.in, a conference on scientific python held at IIT Bombay. The abstract can be found Here
Read more »

  • 4 × TL082 Amplifier and Linear ICs / Operational Amplifiers
  • 2 × TC1240A Power Management ICs / Switching Regulators and Controllers
  • 2 × ICL7660 Power Management ICs / Switching Regulators and Controllers
  • 1 × LM324 Amplifier and Linear ICs / Operational Amplifiers
  • 1 × LM311 Amplifier and Linear ICs / Comparator ICs

View all 42 components

  • Position sensing with a linear optical array

    Jithin08/13/2015 at 18:08 0 comments

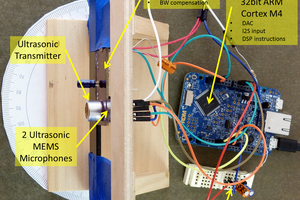
    Among non-contact position sensing methods used in mechanics laboratories, high speed cameras plus image processing is fairly common. However, this method is resource intensive, and a less expensive method is presented as a demo.

    The TCD1304AP is a 3648 element optical array available in a DIP package.
    It's basically 3648 photosensors aligned in a straight line, and each has a storage capacitor.
    In order to acquire data, the user first sends a pulse that connects each sensor with its capacitor for a fixed duration ( the equivalent of shutters in cameras).

    Once the shutter closes, the voltage on each sensor's capacitor represents the amount of light it received.
    A series of pulses must then be supplied by the host, and upon receipt of each pulse the TCD1304 connects the capacitors one by one to its analog output pin. The host must simultaneously read and digitize the output analog data with its ADC.


  • An even more affordable variant

    Jithin08/12/2015 at 14:29 0 comments

    https://hackaday.io/project/6490-a-versatile-labtool !

    WHY?
    The present form has several components that significantly add to the cost, and may not be required by the majority of users. Many of these can be provided in the form of add-on boards, thereby creating the need for a modular design.

    Most of the Add-on slots in the current state are separate Berg headers dedicated to specific data buses. Therefore, a unified, durable expansion port that supports all the available slots in addition to a few analog I/O has been implemented. Some remappable pins as well as the 16Mhz clock used by the DDS have been routed to the expansion slot.


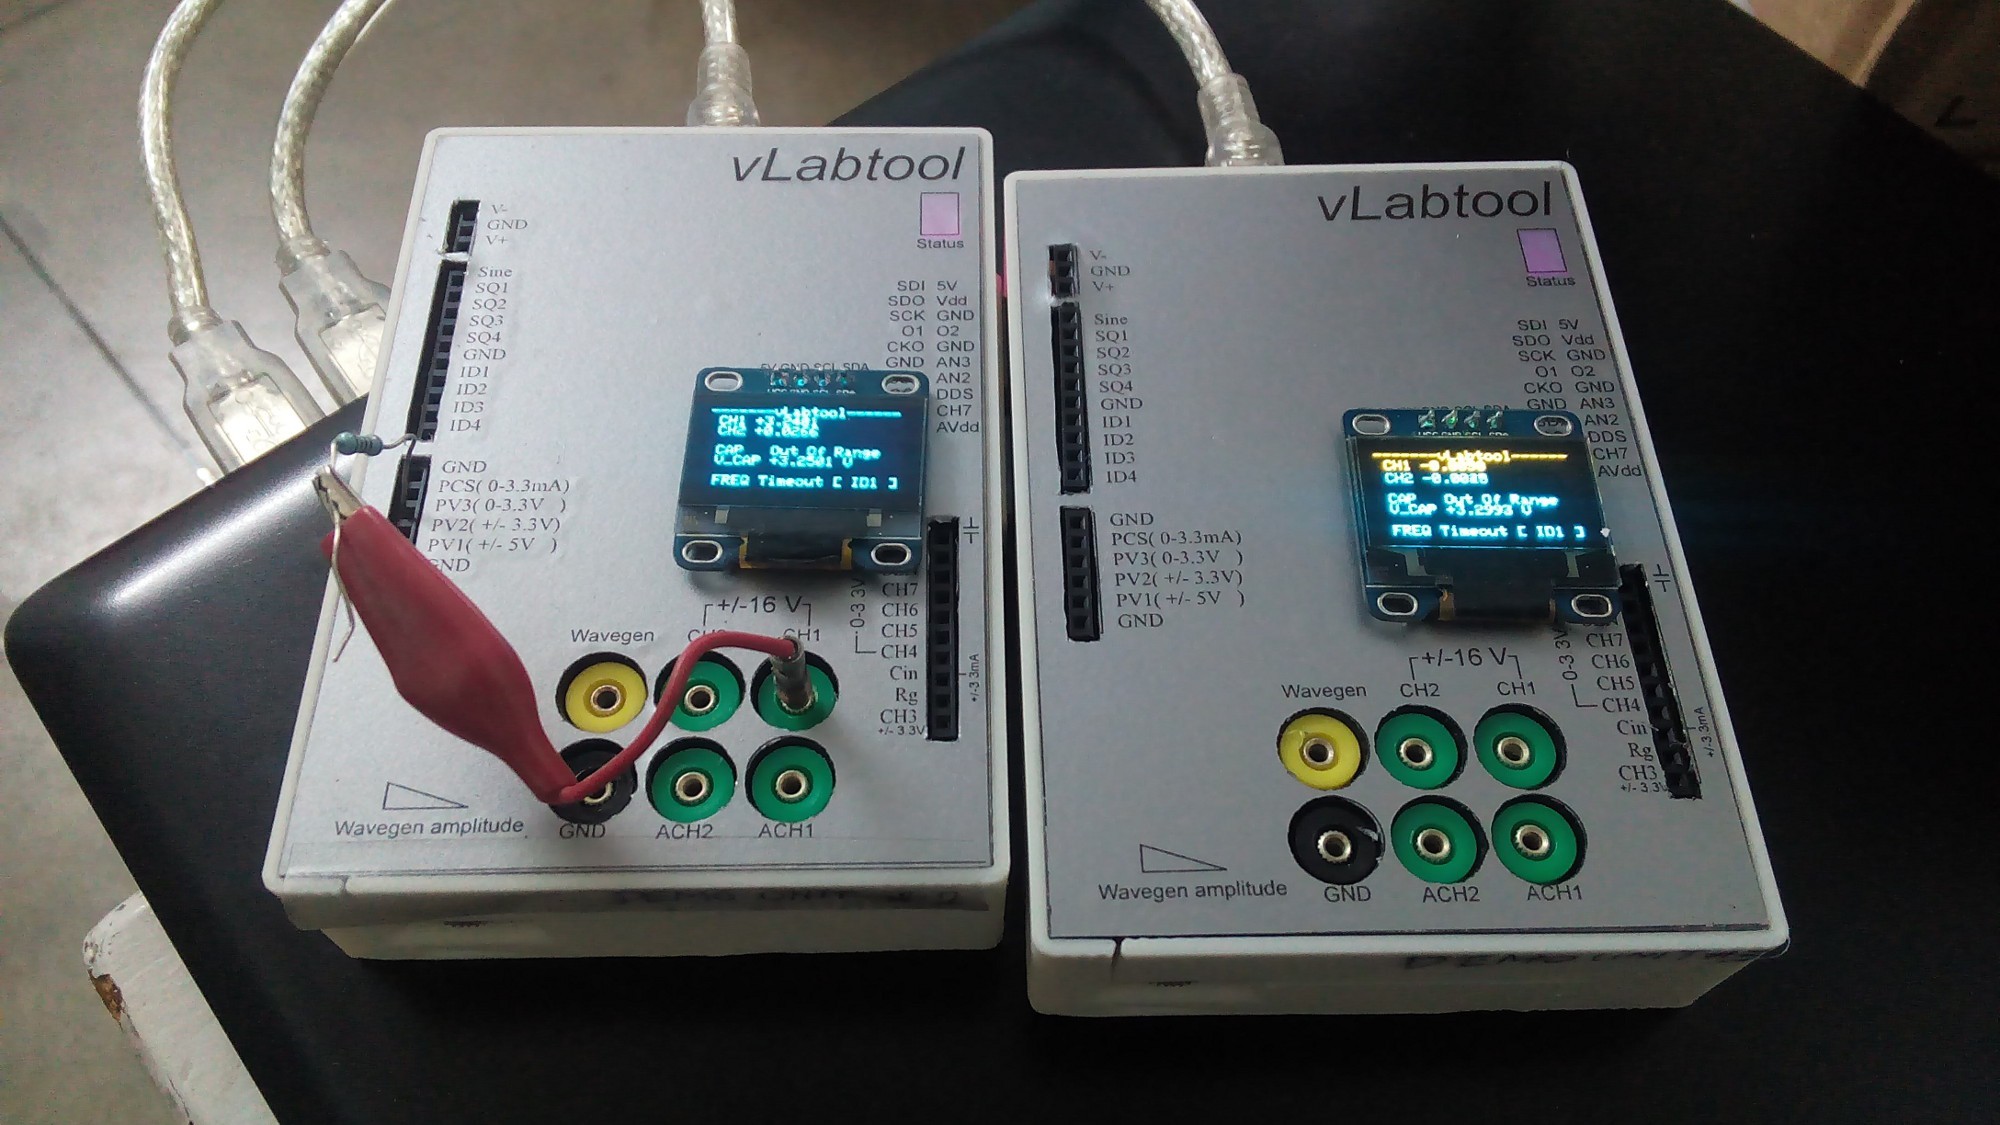
    Figure : Present state of development of the vLabtool. An optional standalone mode has been implemented.

    I'm trying to meet the deadline for the Best Product prize, so it will be taking up all of my time.

    The gist of differences is here. :

    + : BOM Less than $50 with component costs calculated with element14 prices.

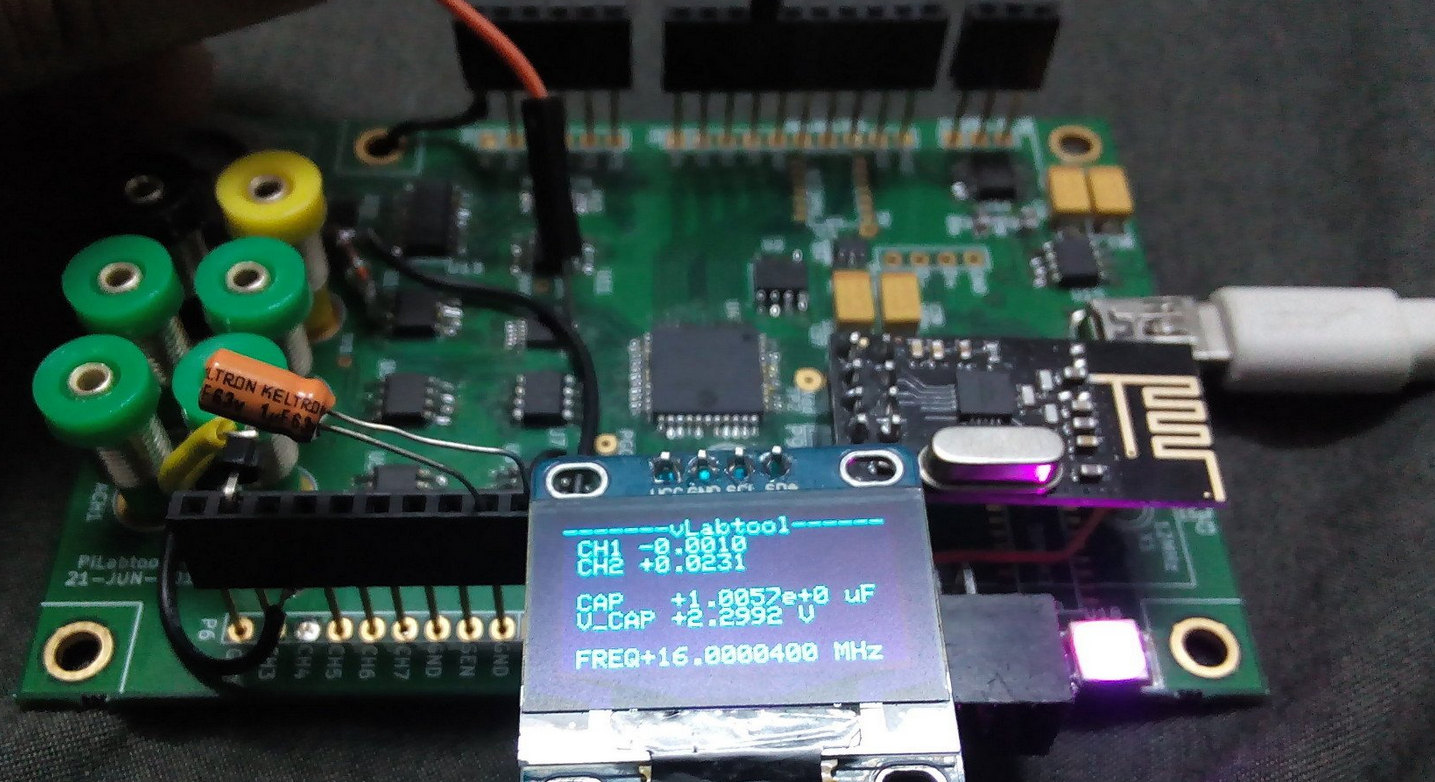
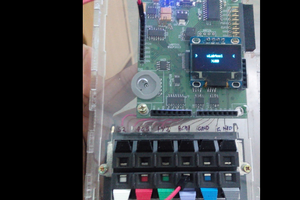
    + : An optional standalone mode. If the device detects an ssd1306 OLED plugged into an I2C slot during boot-up, it displays a few readings until the PC takes over. This allows it to be battery powered, and be made portable.

    - : 4-channel oscilloscope reduced to 2-channel.

    + : 12-bit offset control, and up to 32x gain for 8 analog inputs with various input ranges. These include 2x +/-16V inputs, +/-2V input, I2V convertor, Power supply ripple monitoring, and four unipolar inputs.

    + : NRF24L01+ transceiver added to base board. Firmware routines allow faster data transfer, and automatic node registration.

    - : Inductance to frequency converter removed. It can be easily redesigned as an add-on board which also measures capacitance faster than the CTMU.

    - : The AD9833 is pricey, and only one of them has been made part of the base board in the vLabtool.

    + : A 15KHz fixed amplitude sine wave generator has been added as compensation. It can be used in conjunction with the lone DDS for experiments such as amplitude modulation.

    + : A 2x10 pin expansion connector consisting of SPI, I2C, UART, 2xAnalog inputs, 16MHz output, raw output of the DDS , etc. A 4-pin, 3.5mm socket dedicated for I2C sensors is also included.

    + : 2.5ppm accuracy clock generator Fox925b. This provides much greater accuracy than the 30ppm crystals that were previously employed.

    - : Several hundred banana sockets

    - : TP4056 Li-ion charging IC. These are easily available as breakout boards, and may also be added to the wireless nodes at very little additional expense.

    *ESP8266 continues to enjoy PCB real estate as an alternate communication channel.

    -----------------------------------------------------------------------------------------------------------------------------------

  • Non-contact, short range position sensing

    Jithin06/19/2015 at 04:50 0 comments

    The inductance of a solenoid depends on the properties of its core. Adding a ferromagnetic material will raise it, and a diamagnetic material will do the opposite.

    The Inductance meter on the device simply pairs the externally plugged in inductor with a high stability capacitor on the inside. The resultant tank circuit is driven at its resonant frequency which is measured by the frequency counter. Frequency of oscillations is given byWhere the inductance L, depends on the solenoid, and its core. C is 1000pF.

    The video shows the frequency counter with a resolution of .2Hz connected to the L meter's output logging variations in a solenoid's inductance. Inserting a ferromagnetic material changes the frequency( A key in this case gives up to 6000 points after being pushed 1cm into the core . After calibrating, and accounting for noise, the resolution is less than 10 microns )

    This method has tremendous applications in mechanics labs. However , It won't match up to optical methods when it comes to being unobtrusive. The oscillating field of the solenoid should cause a minor perturbation in the ferromagnetic piece attached to the body being recorded.

  • Amplitude Modulation with an analog Multiplier

    Jithin06/17/2015 at 14:12 0 comments

    The expansion slots are meant to accommodate more complex instruments, and a lock-in amplifier is one of the add-ons I hope to make. Phase correlated sine waves are part of the package already, so only a multiplier and a low pass filter are needed.

    As a first step, I played around with the AD633 analog multiplier, and tried out amplitude modulation using only the tools available on board.

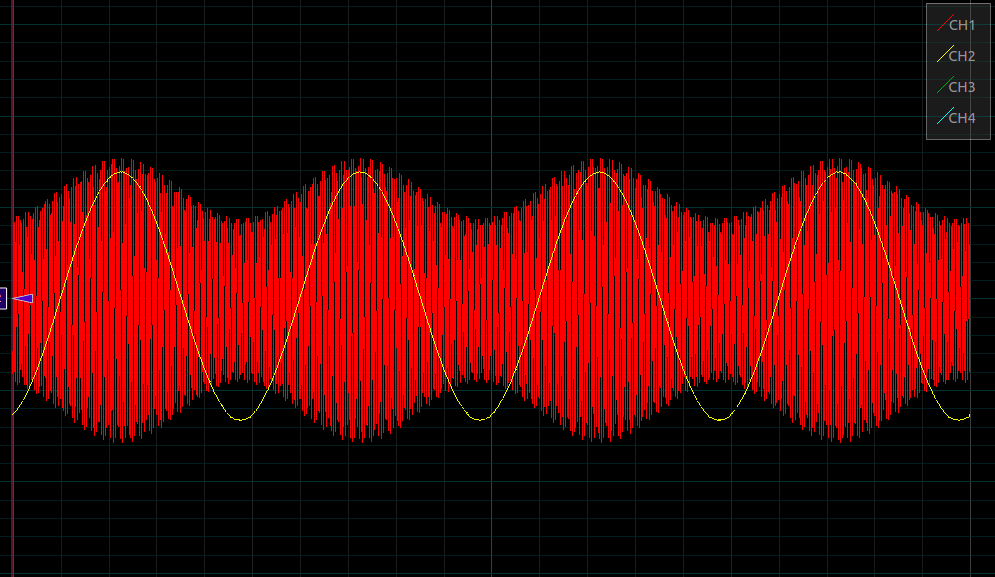
    The schematic is in the examples section of the AD633 datasheet. The red trace is the modulated output. A carrier of 10KHz was modulated with 150Hz.

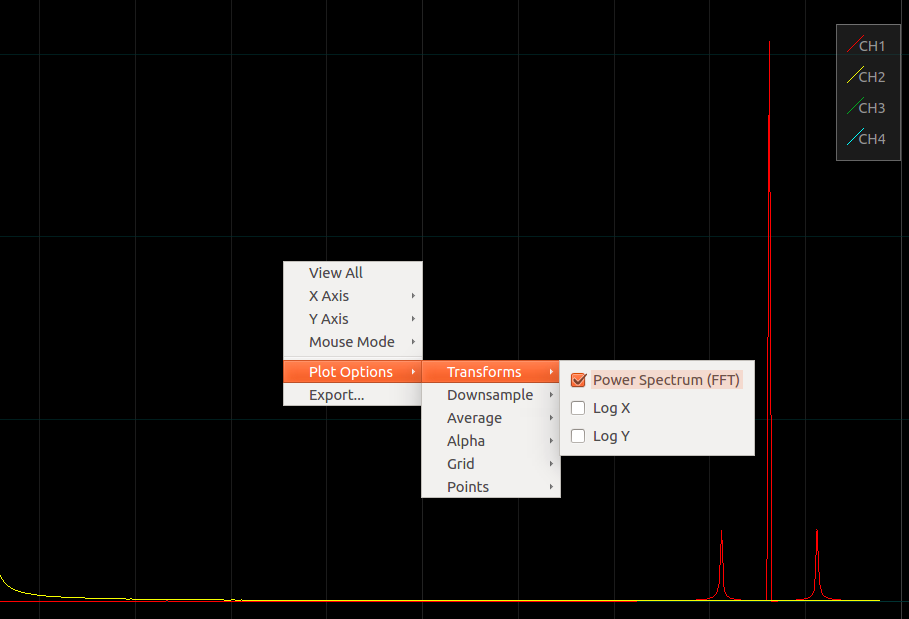
    A quick Fourier transform of the modulated wave shows the side bands.

    Read more »

  • Calibrating the calibrator

    Jithin06/17/2015 at 03:58 0 comments

    The last log dealt with testing a 24-bit ADC, the AD7718 , and I may have mentioned that its main aim for now was to serve as a calibration tool.

    However, In order to use it as one, It itself must first be calibrated against some industry standard high resolution DMM. Even though the datasheet for the AD7718 claims a pretty high accuracy, any measurement tool is only as accurate as its reference, which in this case is the REF196. The REF196 is an ultra stable voltage reference, but may have an initial offset.

    Another source of error is the OPA2277 level shifting op-amps.

    I have access to a Keithley 2100 multimeter, and am using it for this calibration.

    Using python-usbtmc, it can easily be interfaced . Code is as simple as

    import usbtmc
    DMM =  usbtmc.Instrument(0x05E6,0x2100) #V-id,P-id 
    print DMM.ask('*IDN?')
    DMM.write('SENS:VOLT:NPLC 1\n')
    DMM.write(':SENS:VOLT:DC:RES 1E-6\n')

    For now I've calibrated the unipolar inputs on the PCB.

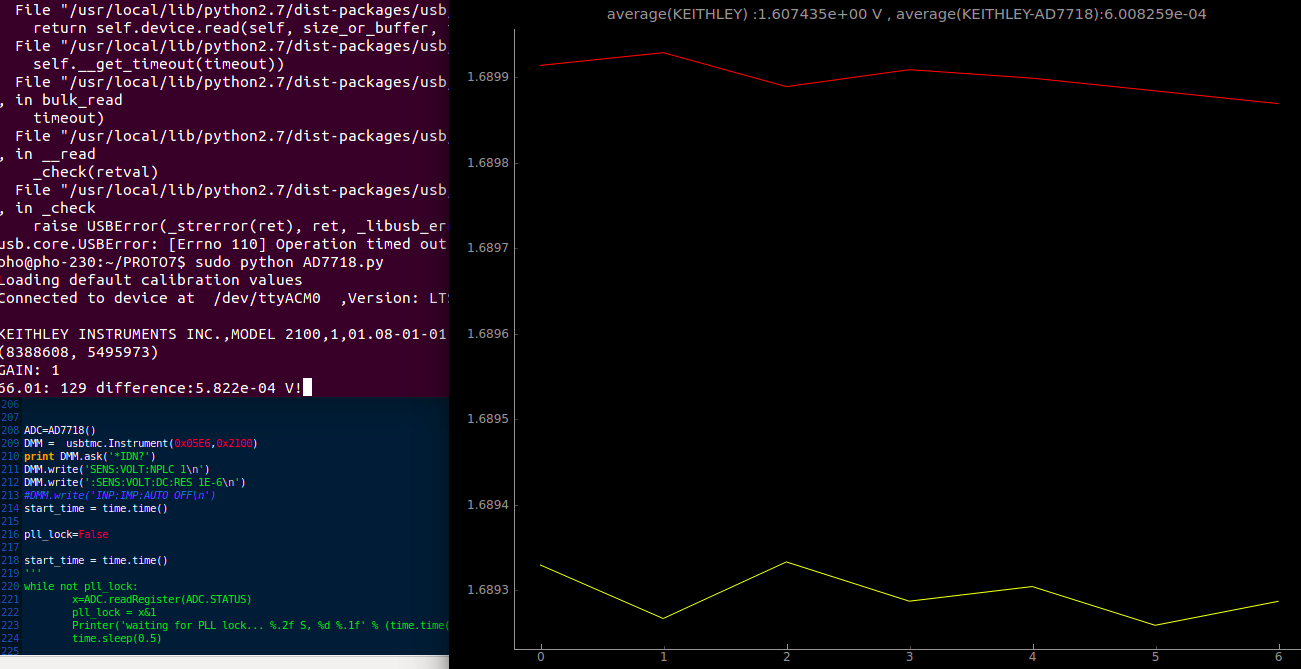
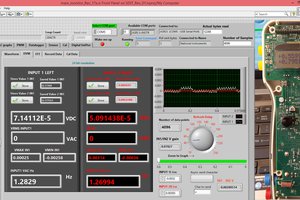
    Here's a screenshot of a simple calibration program that sweeps a voltage source and records the values read by the Keithley2100, and the AD7718. The data will be used to generate a fitting polynomial.

    At lower voltages, both agree pretty well, but en route to 3.3V, the gap increases to about 1.5mV roughly linearly. This offset is to be expected from the voltage reference, and calibration will take care of it. What's important is that the calibration be valid over a wide temperature range, and that's the whole point of using a voltage reference and low drift op-amps.

    Update: After applying the calibration factors, the readings from the AD7718 correspond to professional DDMs to within a +/-100uV margin. Averaging brings it down to <10uV, since the noise floor for this roughly designed board is around 100uV. Moving on to opto-isolation.

  • Add-ons : High resolution ADCs

    Jithin06/14/2015 at 19:10 0 comments

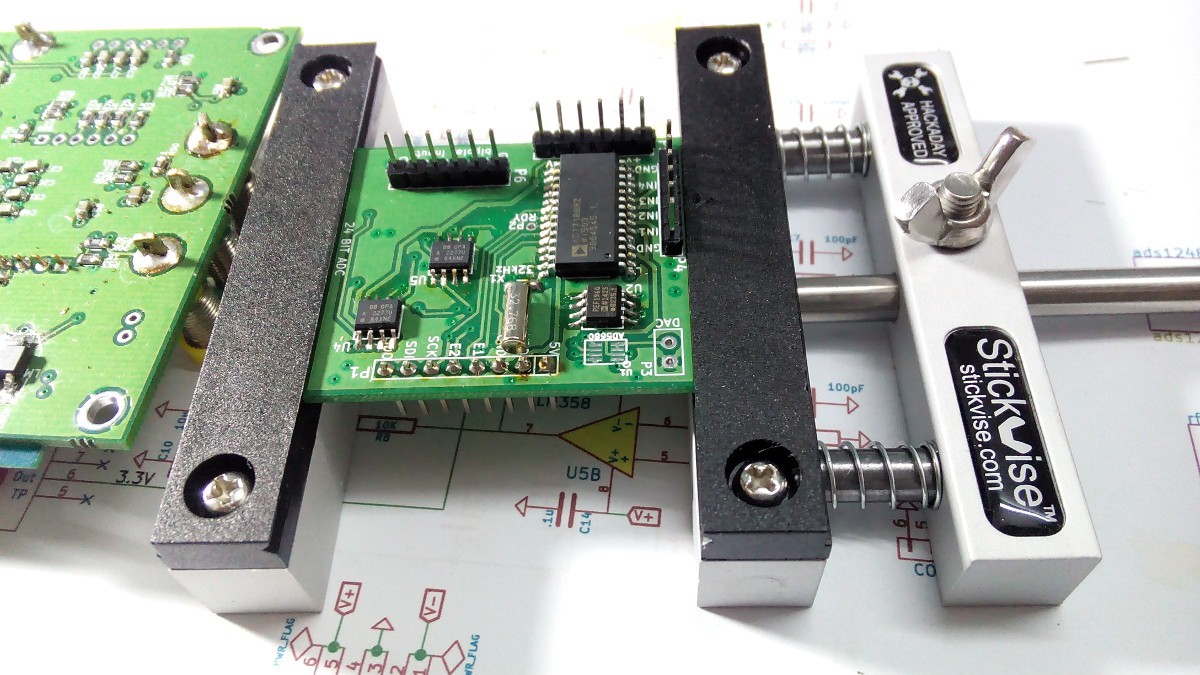
    Tested the AD7718 24-bit ADC with a custom PCB.

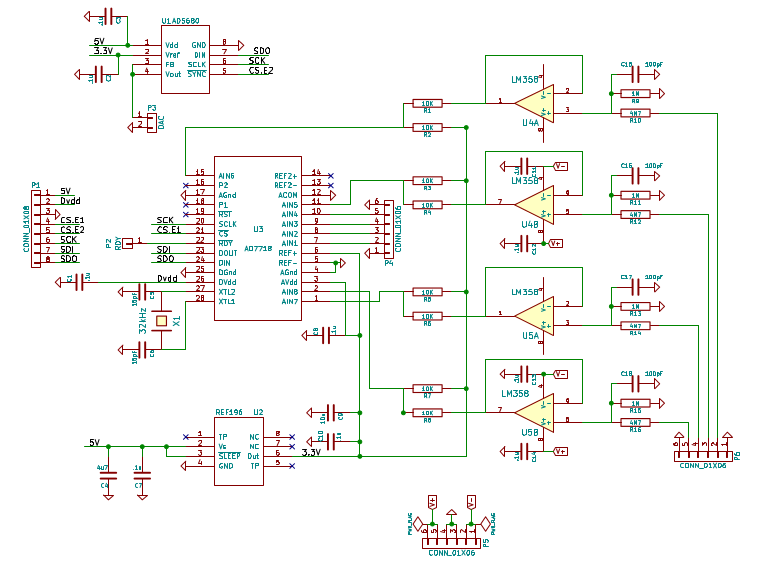
    AIN1-AIN4 have been broken out into pin headers directly , and can be used as unipolar inputs/differential pairs.

    AIN5-AIN8 will be used to measure bipolar signals. The inputs for these are attenuated and buffered using high precision Op-Amps OPA2277(offset<10uV , drift<0.1uV/C ), and then level shifted.

    The StickVise that Hackaday handed out a couple of weeks ago has turned out to be incredibly useful since I use surface mount parts a lot

    Fig : Schematic

    Now that its functionality has been reasonably tested in terms of software control, and noise spread is below 100uV, an opto-isolated version can be made which should give much better resolution. I hope to post histograms and other characterization results soon.

    Read more »

  • Wireless Nodes!

    Jithin06/04/2015 at 16:49 0 comments

    An easy to use RF link can be a very valuable addition for large scale experiments with multiple data acquisition points spread out over a wide area that rules out the use of wires due to hassles/expenditure/nature of the data.

    The NRF24L01+ radio modules offer data rates up to 2MbPS, and configurable addresses with up to five bytes each. So, technically speaking, you can implement more nodes than you'll ever need.

    Here's a demo. There's no sound, but I've tried to make up for it by annotating the whole thing.

    The master radio transmits using the ShockBurst mode, and the slave nodes acknowledge along with Payloads that contain whatever data they had been instructed to gather. They also handle dropped packets gracefully by attempting a few retransmits without user firmware intervention.

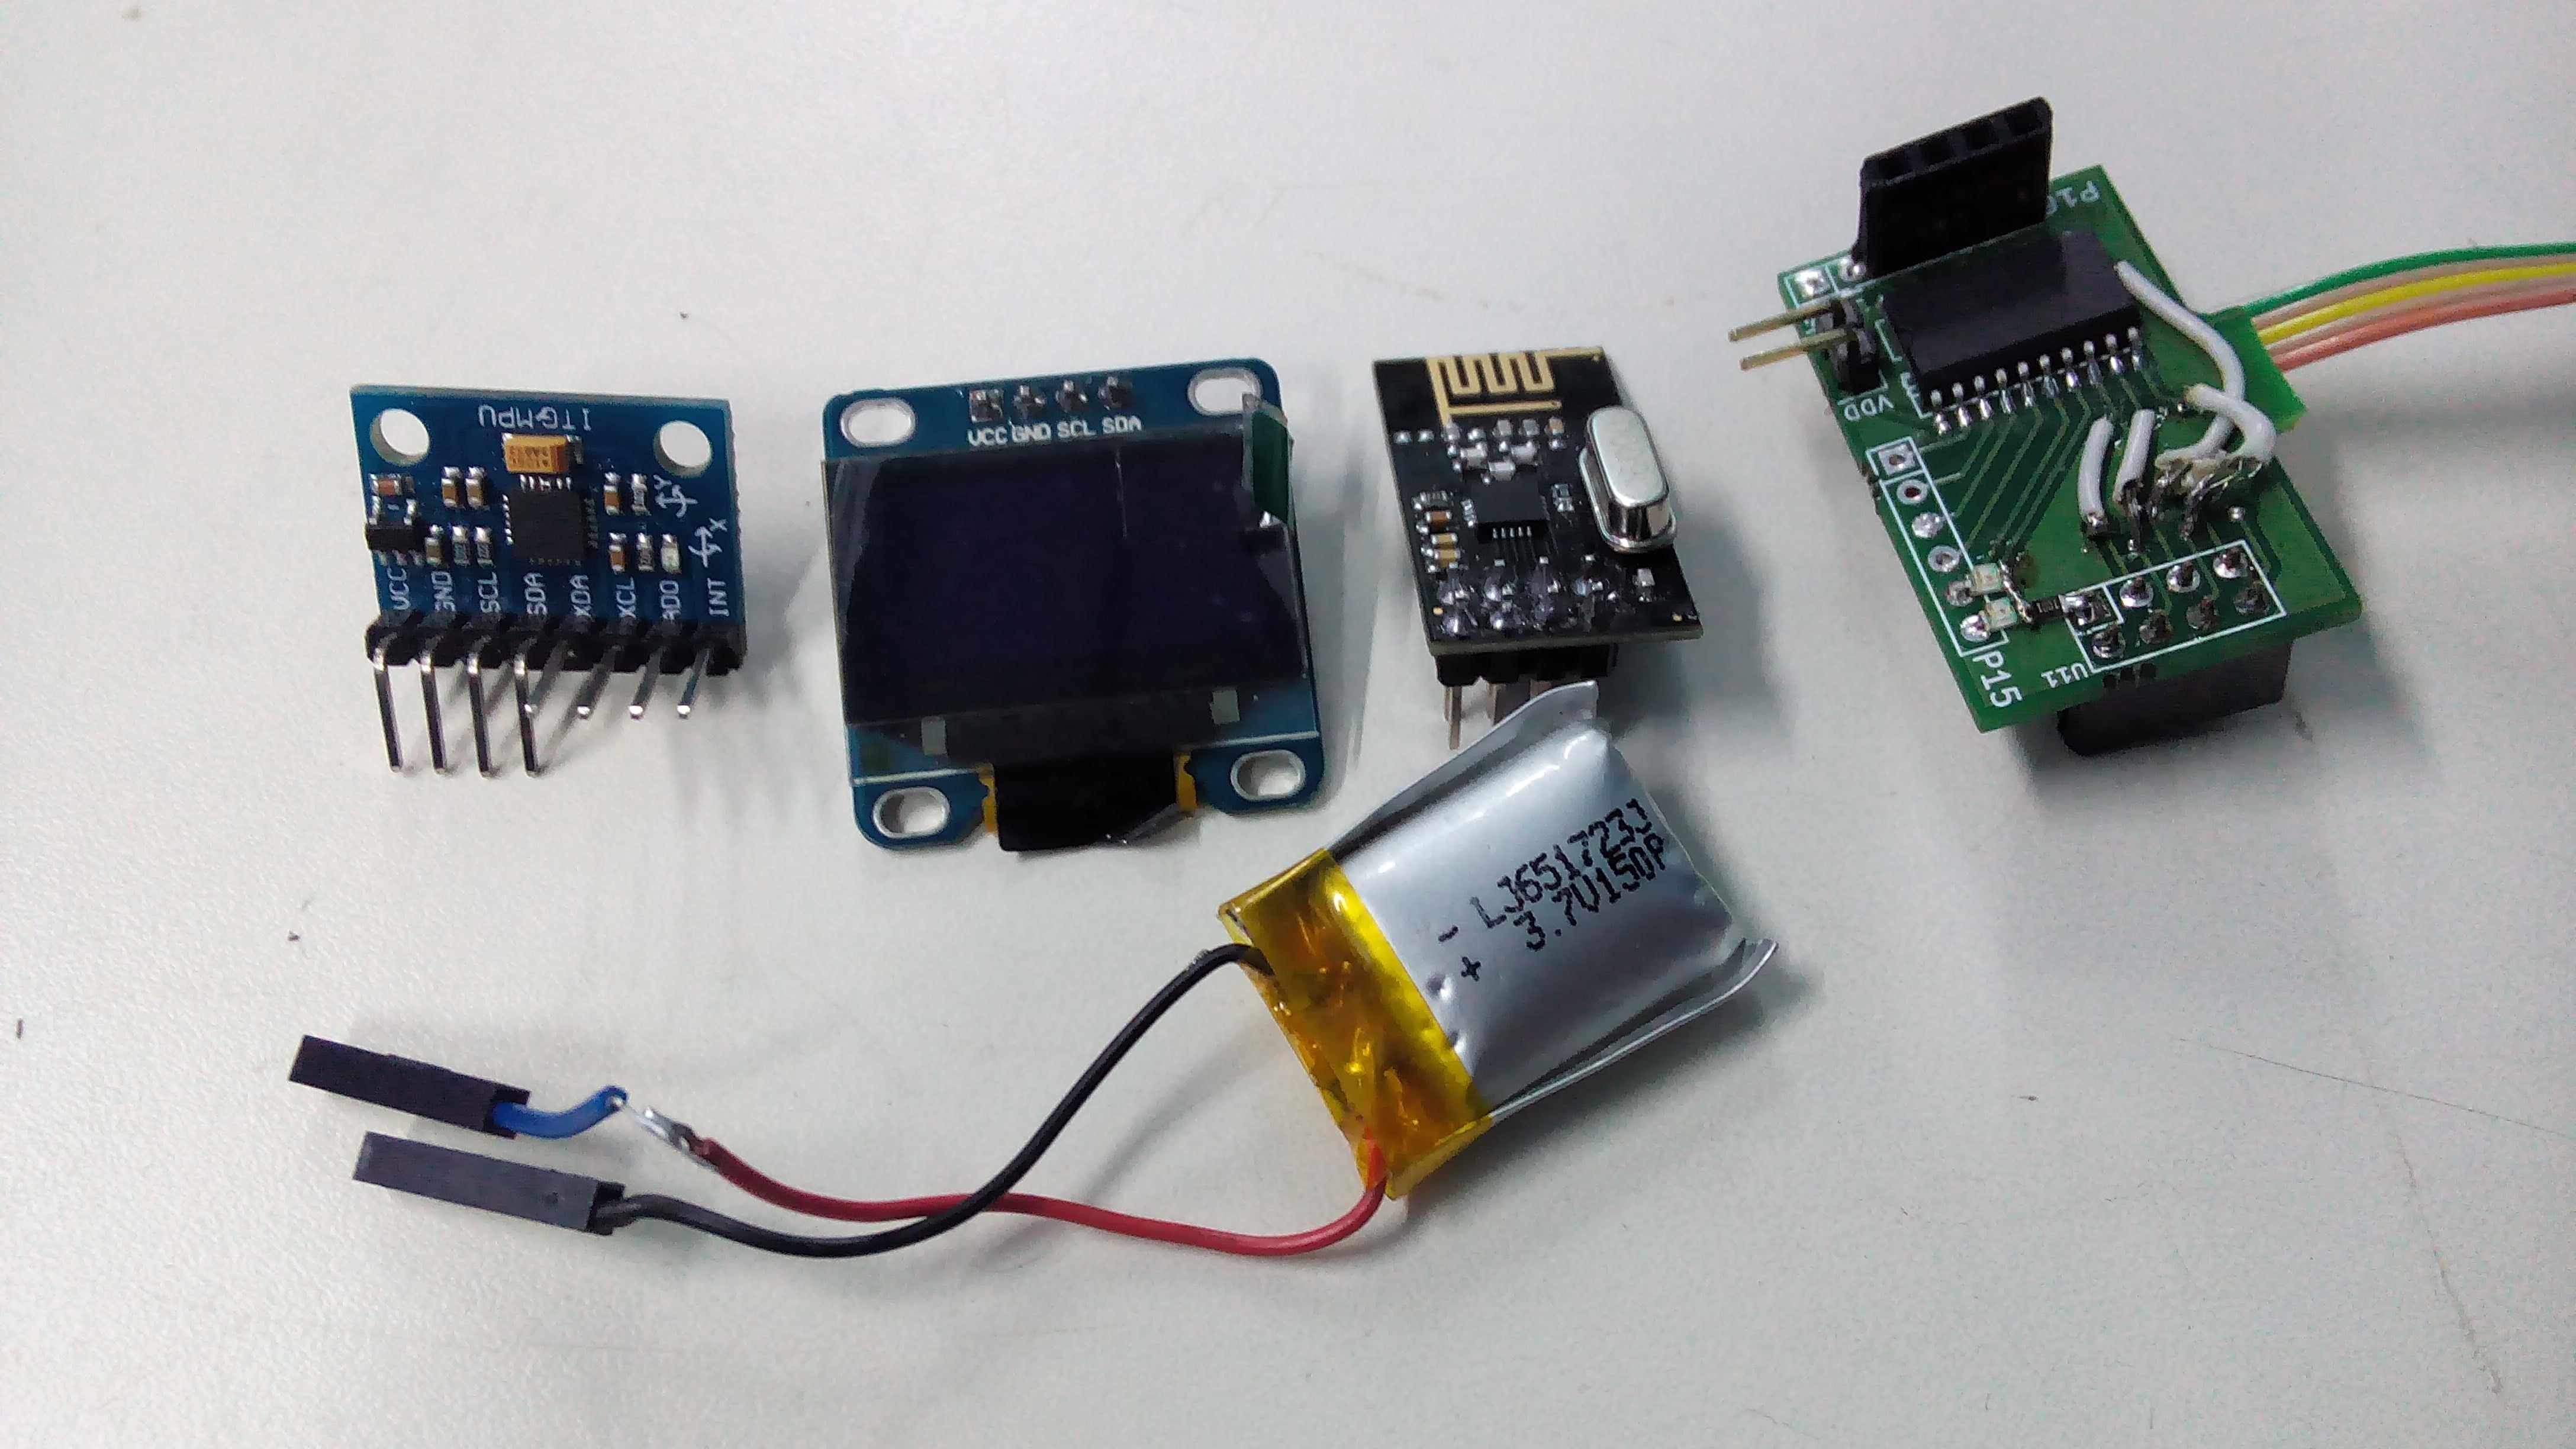
    Here's everything that went into making the slave node prototype featured in the video.

    The PIC used has a shared SPI, I2C peripheral module, so each time I2C data is required, a quick pin remapping is carried out to switch between the I2C sensor and the SPI NRF radio.

  • Incorporating commonly available sensors into the framework

    Jithin06/01/2015 at 05:34 2 comments

    Thanks to the vibrant hobbyist market, several sensors which would otherwise have remained inaccessible owing to their reflow-only footprints, are now available in amateur friendly breakout boards with clearly labeled pins.

    I bought up a bunch of these, and tested most of them. Several of these use SPI/I2C, and companion classes to support them can be coded on the PC side without having to touch the firmware. Some however, use non-standard/timing critical protocols, so I have added support for them in the firmware. These include ( I may have mentioned them in a previous log somewwhere ), the HX711 weighing sensor(24-bit fully differential, 128x PGA), DHT22(humidity), and a 3648 element optical array from Toshiba.

    Here's an example of what a Python side class for a sensor may look like.

    #HMC5883L 3-axis magnetometer
    import Labtools.interface as interface
    import time
    from numpy import int16
    
    class HMC5883L:
    	def __init__(self,ADDRESS=0x1E):
    		self.ADDRESS = ADDRESS
    		self.I = interface.Interface()
    
    	def connect(self):
    		self.I.I2C.start(self.ADDRESS,0) #writing mode
    		self.I.I2C.send(0x01) #gain
    		self.I.I2C.send(0<<5) #smallest range
    		self.I.I2C.stop()
    
    
    		self.I.I2C.start(self.ADDRESS,0) #writing mode
    		self.I.I2C.send(0x02) #Mode
    		self.I.I2C.send(0)    #Continuous measurement
    		self.I.I2C.stop()
    	
    	def __getVals__(self,addr,bytes):
    		self.I.I2C.start(self.ADDRESS,0)
    		self.I.I2C.send(addr) #read raw values starting from address
    		self.I.I2C.restart(self.ADDRESS,1)
    		vals=self.I.I2C.read(bytes)
    		self.I.I2C.stop()
    		return vals
    
    	def read(self):
    		vals=self.__getVals__(0x03,6)
    		x=int16((vals[0]<<8)|vals[1])	#conversion to signed datatype
    		y=int16((vals[2]<<8)|vals[3])
    		z=int16((vals[4]<<8)|vals[5])
    		return x,y,z
    
    
    '''		
    a=HMC5883L()
    a.connect()
    while 1:
    	print a.read()
    '''	

    The above code ignores error codes returned by the I2C functions, and needs much work.

    refer to http://pythonhosted.org/LabtoolSuite/interface.html for a rough programmer's manual generated using Sphinx.

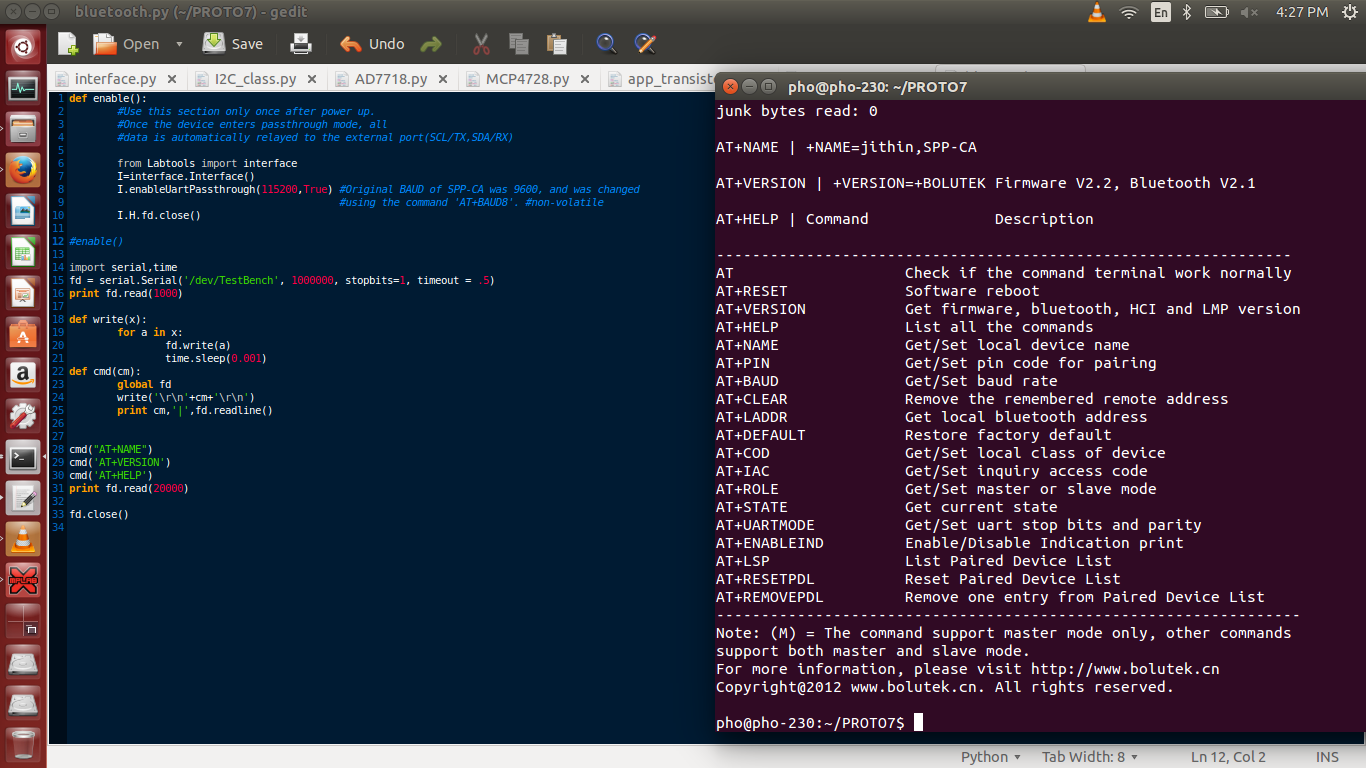
    A UART relay has been implemented, but it's fairly buggy at this point. When activated, all data sent to the device is ignored, and relayed directly to the output port, and vice versa. It can be used to test UART devices like bluetooth modems with little overhead.

    There are two modes. One where the device returns to normal functionality if no data is exchanged for more than one second, and another where a power cycle is required for the device to return to normal functioning. Can possibly be used for programming secondary microcontrollers with bootloaders such as the ESP8266.

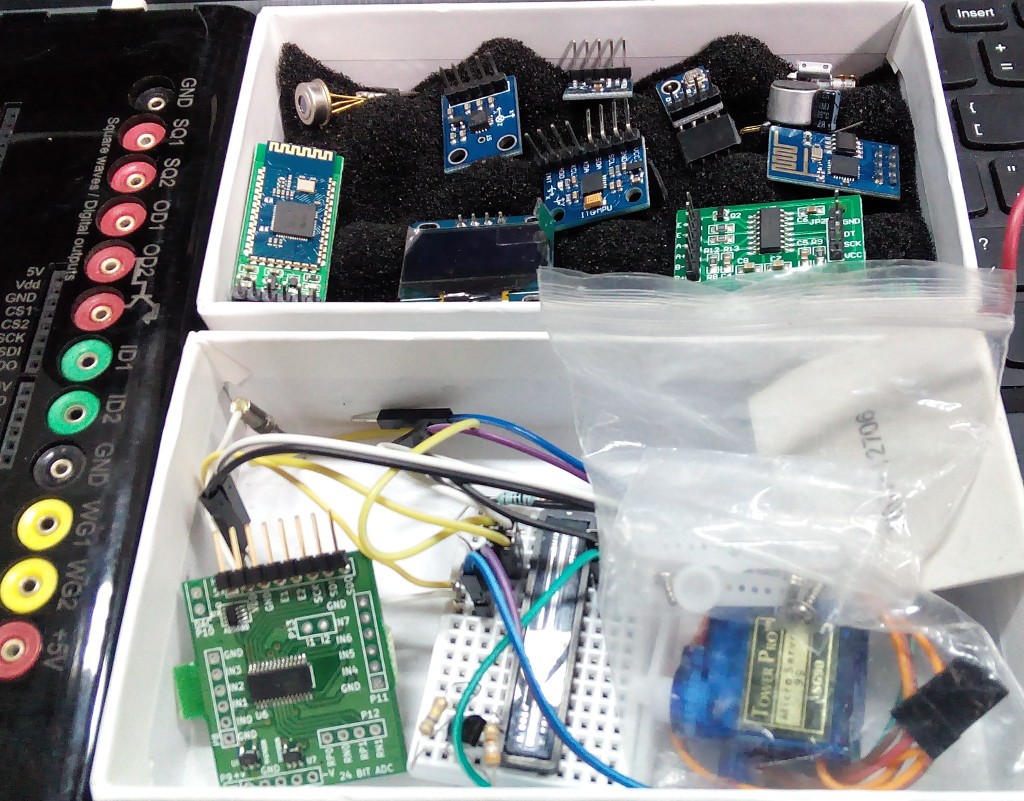
    Here's some example output from a BOLUTEK bluetooth modem(left side of the box in the picture above), after I activated the relay.

    The 1ms delay between characters is to prevent buffer overflows caused by the much lower BAUD rate of the modem. I could alter the vLabtool's BAUD rate to keep up, but like I said, there are many problems with this feature that need to be looked at.

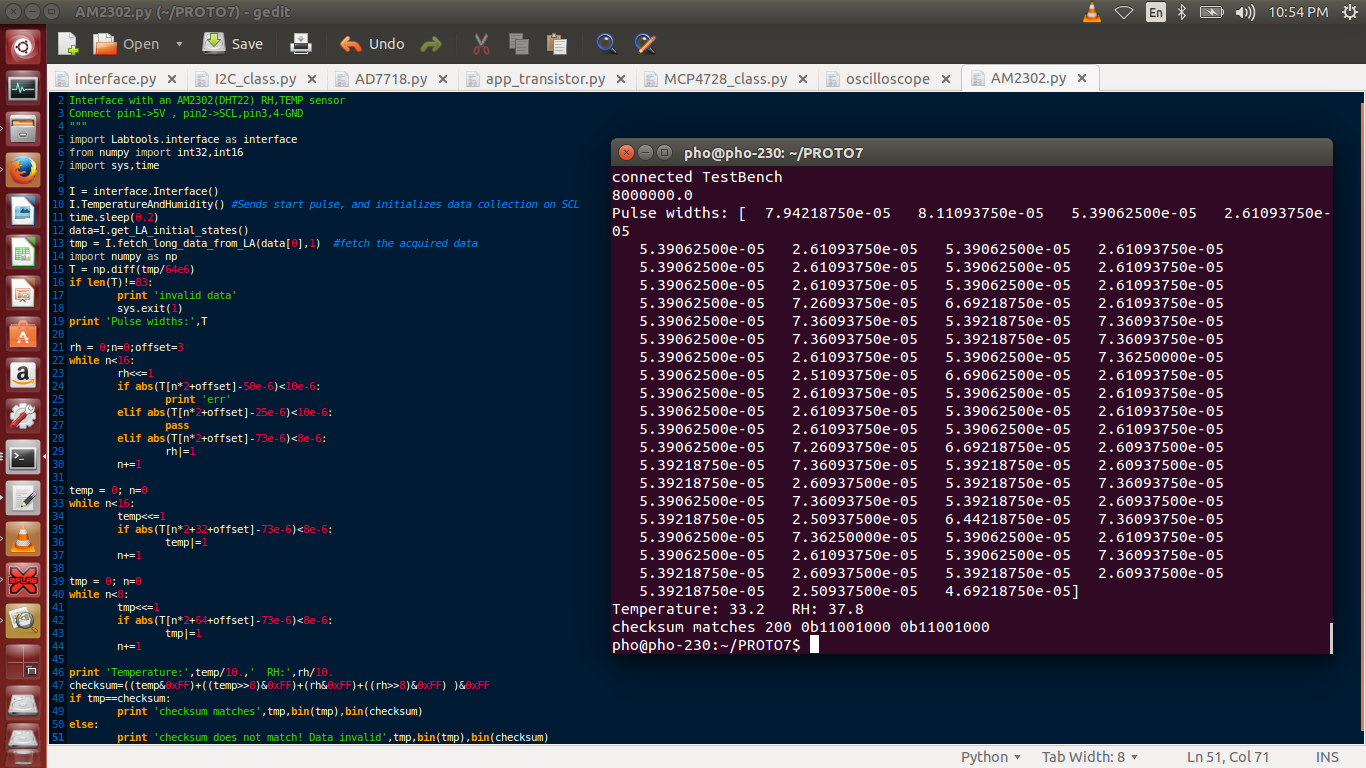
    Here's an elaborate explanation on how the DHT-22 sends data, along with the timing details for all the pulses. I will soon write a dedicated loop in the firmware which collects and sorts the pulse width encoded data in real time, but using the logic analyzer first gave me an accurate idea of what the timing details are.

    The code is self explanatory.

    Currently testing a PIC16F1618+NRF24L01+ combo for making wireless sensor nodes.

  • Laser cutting enclosures

    Jithin05/28/2015 at 08:09 0 comments

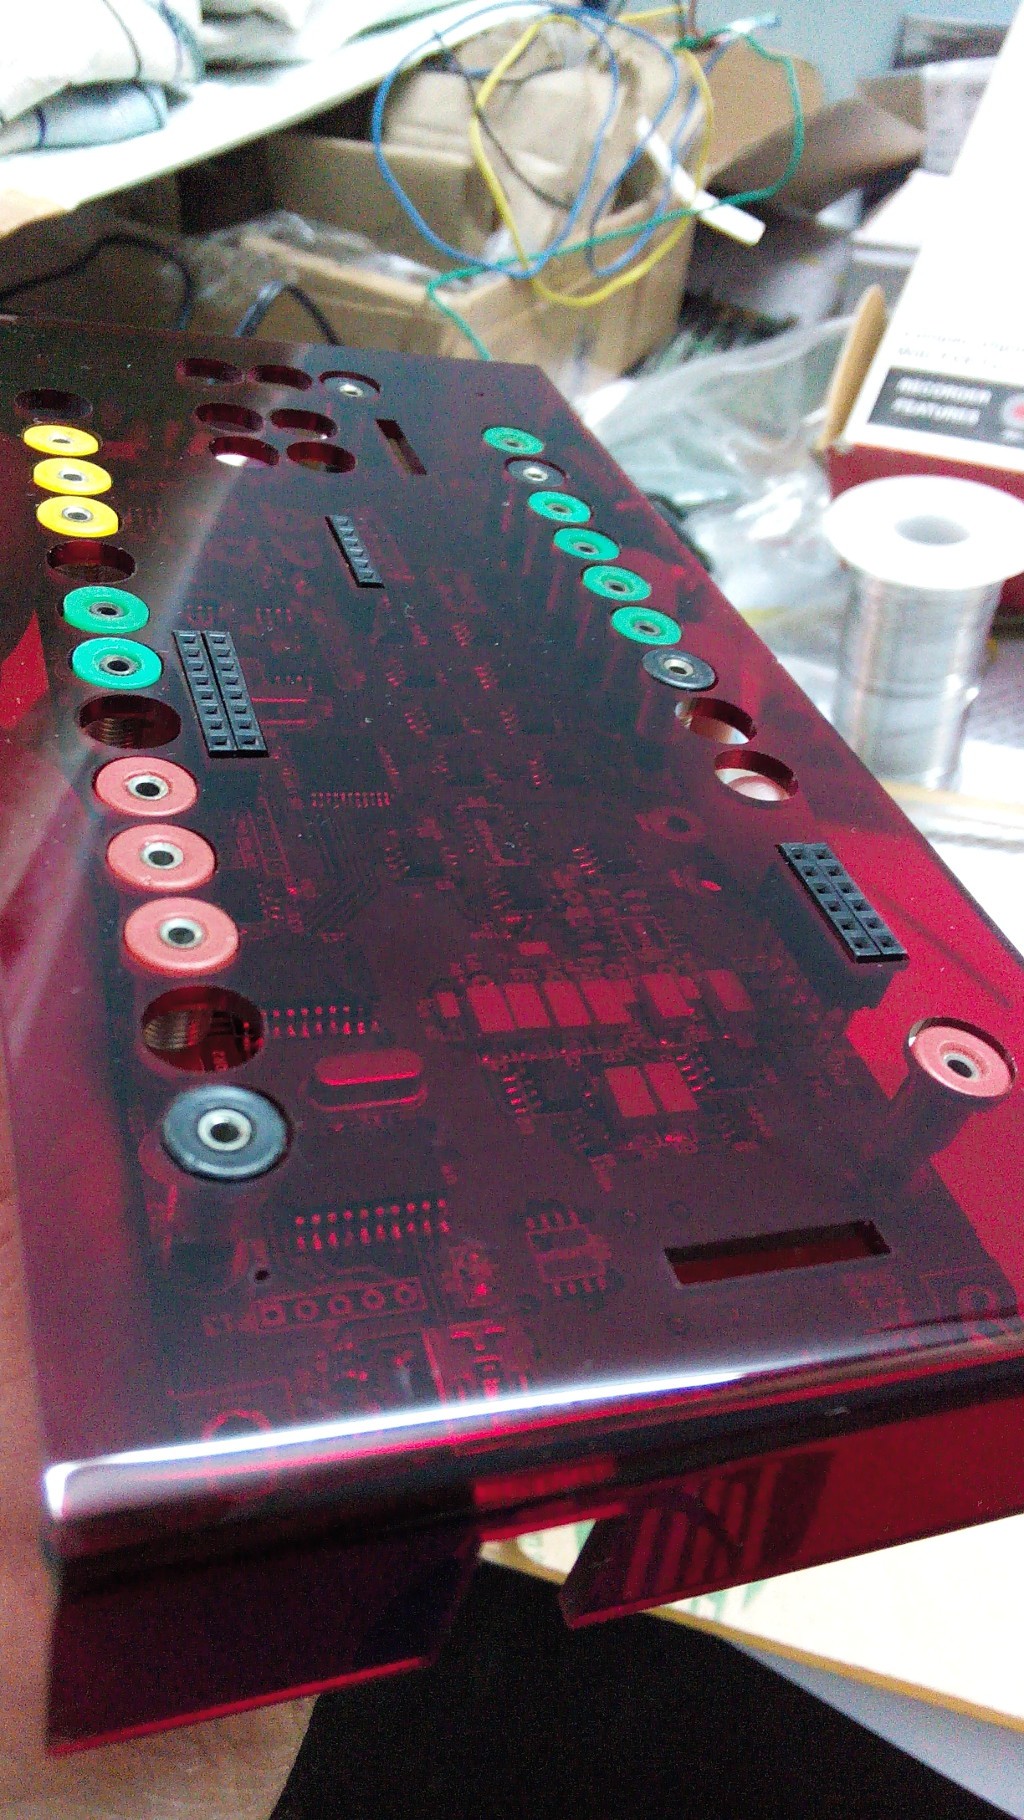
    An enclosure needed to be designed for the prototypes, so I proceeded to visit several laser cutting facilities armed with a few different designs.

    Top panel cut out from translucent red acrylic. The edge was bent by heating .

    Read more »

  • Streaming ADC data

    Jithin05/28/2015 at 07:40 0 comments

    While the oscilloscope can capture up to 10K samples, and then dump them into the PC for processing, the streaming mode dumps datapoints continuously at the maximum speed possible . If the python program reading the data fails to keep up, buffer overflows will lead to lost datapoints. ADC data can currently be streamed at 125KSPS.

    PyQtGraph is amazingly adept at plotting large datasets being updated in real time. Right-click and drag to zoom along either axis


    A 50Hz sine wave was initally monitored, and then changed to 500Hz.

    Screencast recorded using RecordMyDesktop.

View all 15 project logs

  • 1
    Step 1

    Installing the Toolchain


    All the software is hosted on github as well as PyPI

    Installing from git

    sudo apt-get install python-qt4 python-qt4-gl python-opengl python-setuptools ipython-qtconsole
    
    git clone https://github.com/jithinbp/LabToolSuite.git
    cd LabToolSuite
    sudo python setup.py install
    

    Installing from PyPI

    -Install the dependencies listed in the previous block

    sudo easy_install LabtoolSuite

  • 2
    Step 2

    Running a few apps

    Scope, Logic Analyzer, variety of control widgets

    oscilloscope
    Streaming utility
    Stream

  • 3
    Step 3

    Writing your own code

    The programmer's manual with examples is hosted on PyPI
    http://pythonhosted.org/LabtoolSuite/interface.html

View all 4 instructions

Enjoy this project?

Share

Discussions

Similar Projects

Does this project spark your interest?

Become a member to follow this project and never miss any updates