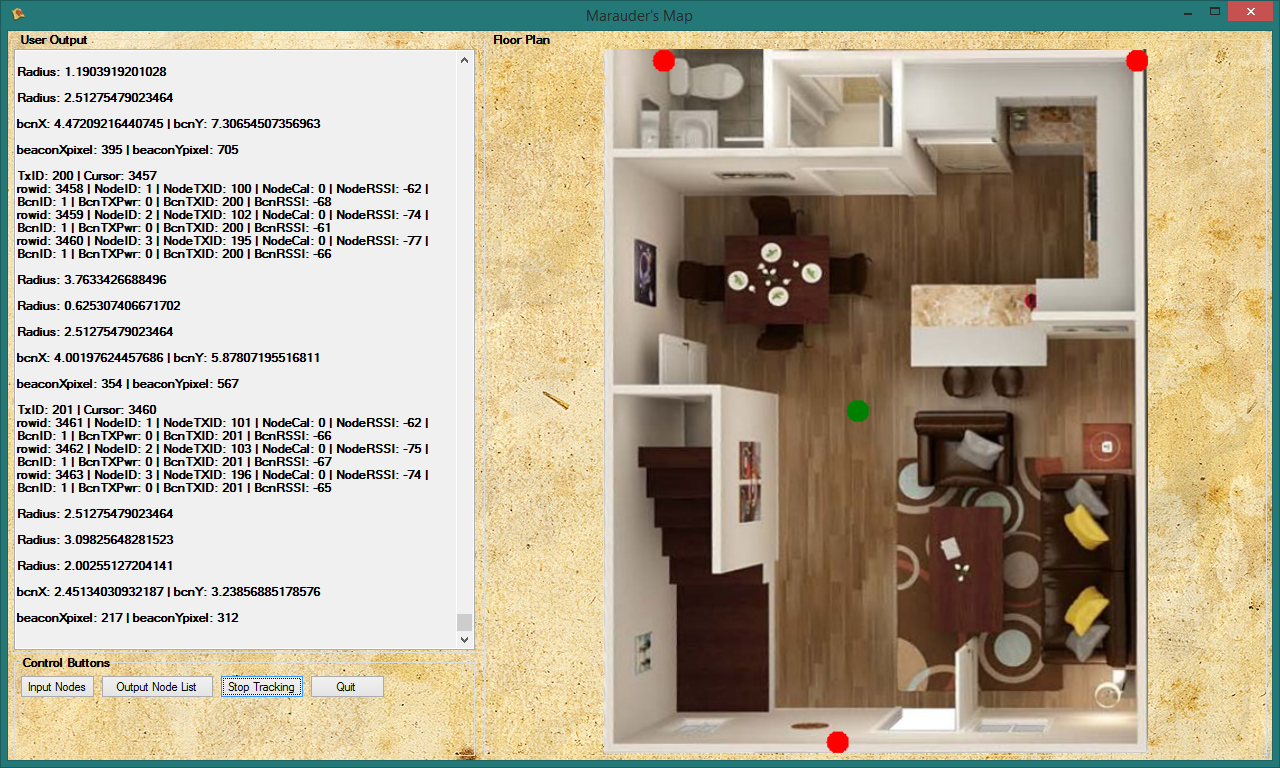
The software has seen a lot of improvements since the last update. First of all, we officially have tracking. The screenshot below shows three nodes (red dots) and one beacon (green dot). The program can process data in real time and is currently only limited to how often the nodes send data to the base station (1Hz). When the 'Start Tracking' button is pressed, the program will make the following query on the database:
'SELECT * FROM Data WHERE BcnTXID = transactionID AND ID > cursor'
Since John incorporated a transaction ID, I can choose groups of readings easily by selecting a certain transaction ID. The cursor handles placement within the database, making sure previously selected rows aren't selected again. Once the database returns the resulting tuples from the database, if there are more than two rows the program can begin triangulation. The program then runs through various calculations in order to return a coordinate for the beacon (green dot).

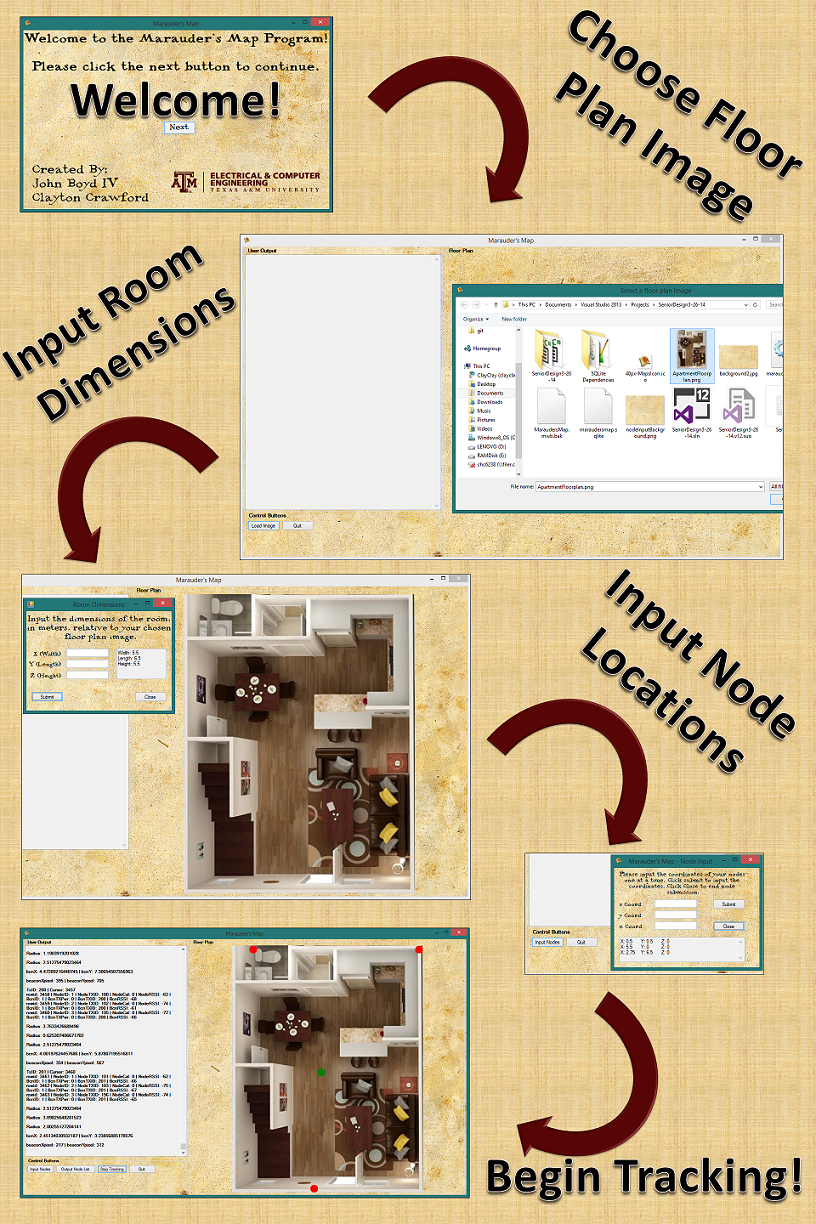
The image below just shows a simple program flow that the user would take when running the program. The user sees a welcome screen and clicks the Next button to go to the main program window. From here, the user must select the Load Image button in order to load a floor plan image. As soon as the user selects and opens the image, another window appears to allow the user to input the dimensions of the room. The user is led back to the main program window where they can output the list of nodes and begin tracking.

Overall, the project is complete, however there is room for some slight improvement and modification that will be looked into by John and I.
 wahwahweewahh
Discussions
Become a Hackaday.io Member
Create an account to leave a comment. Already have an account? Log In.