 Victor
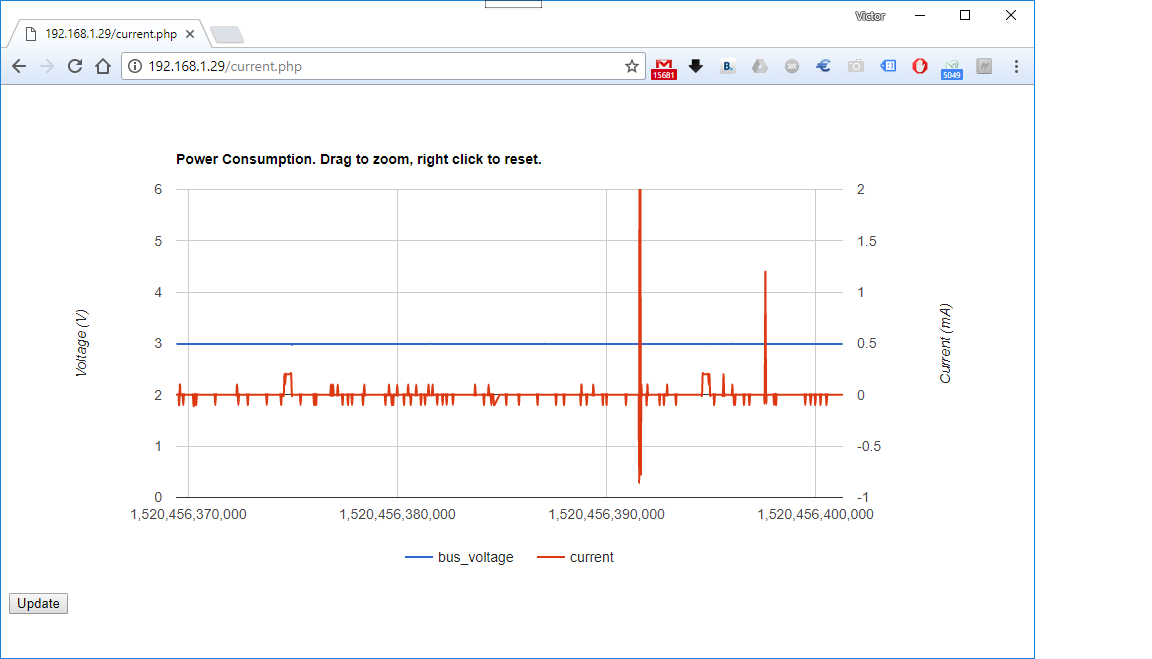
Measuring. X-axis is in milliseconds
Current going to negative values also. Very strange.
Useful libraries:
Python library for INA219
https://github.com/chrisb2/pi_ina219
I will share my code soon
A project log for Power logger with Raspberry Pi
The idea is to take Raspberry Pi, current/voltage meter INA219, and visualize the data by the web interface.
Measuring. X-axis is in milliseconds
Current going to negative values also. Very strange.
Useful libraries:
Python library for INA219
https://github.com/chrisb2/pi_ina219
I will share my code soon
Discussions
Become a Hackaday.io Member
Create an account to leave a comment. Already have an account? Log In.