Update 07.05.18: See new plots + description:)
I invite you to have a look at my first week of data. We will see a lot of nice things
I am quite pleased with the results of the first week of logs. This is mainly because I logged at 1 minute intervalls instead of the planned 15 minutes... So I got 9700 data points. My poor old laptop! It keeps lagging, handling that.

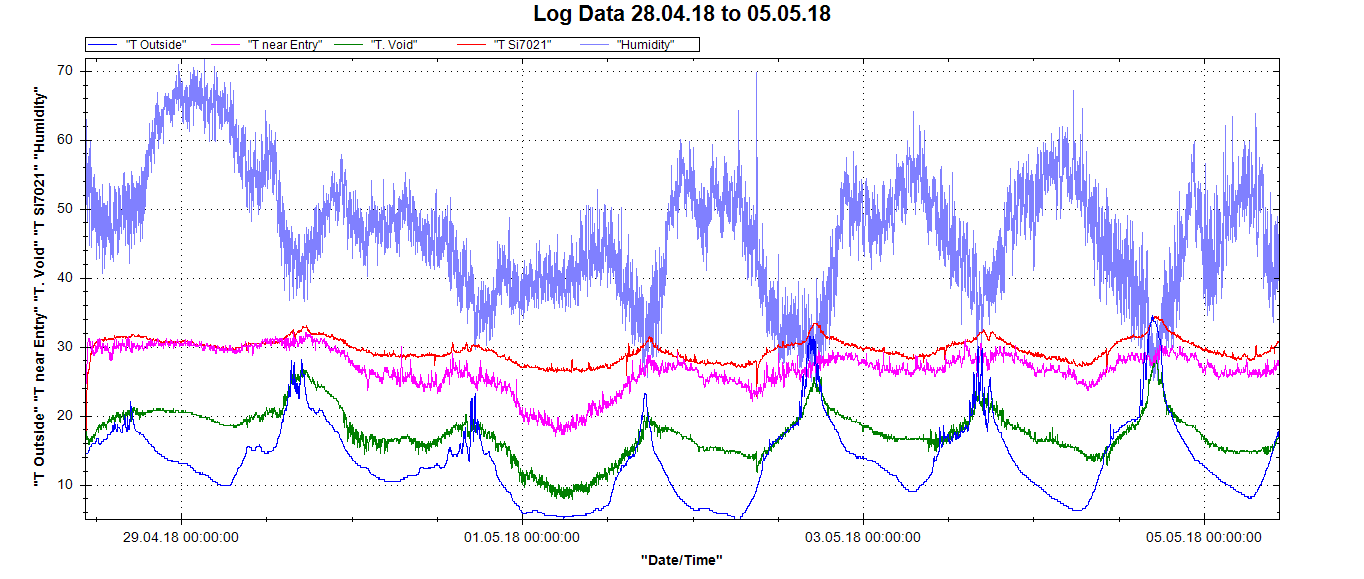
Above: one week worth of data
First thing I'd like to emphasize is the connection between the outside temperature and the temperature in the void of the hive. Bees exclusively heat their brood and their honey combs. Heating huge voids is a waste of energy, thus they avoid that!
Another interesting thing is how steady the temperature above their brood combs is (red chart). The temperature near the entry is only a few degrees C lower than that. Mainly because the opening is so small at the moment.
Humidity changes in opposite to the outside temperature! When the outside temperature rises, the humidity in the hive drops. This is kind of strange, as warm air can take much more water. So the bees must do something to actively change the humidity in the hive?
Update 07.05.18: I just looked up the data for our town for that period:

My chart closely follows the official weather data. And now I know why: the hive is open on the bottom! So it kind of has to resemble the outside weather. Nice!
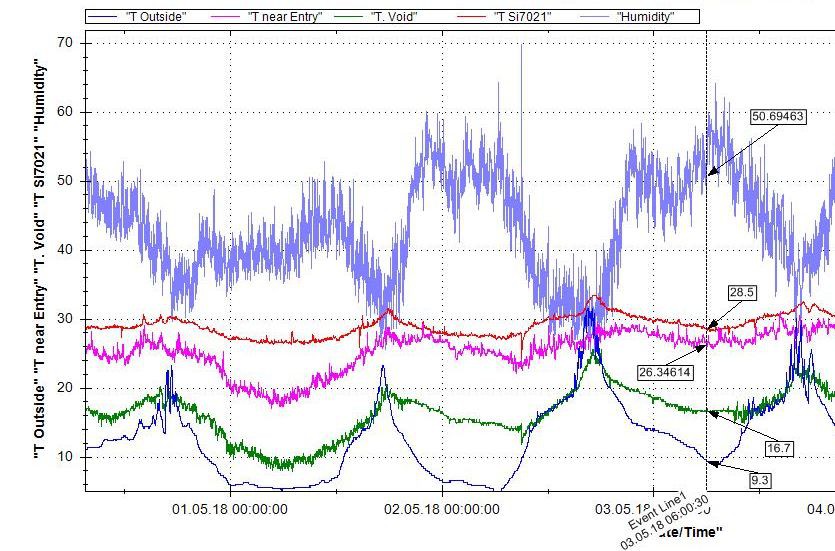
Here's a close-up of May 3rd, 2018 06:00 in the morning:

And this is the official weather data for my area:

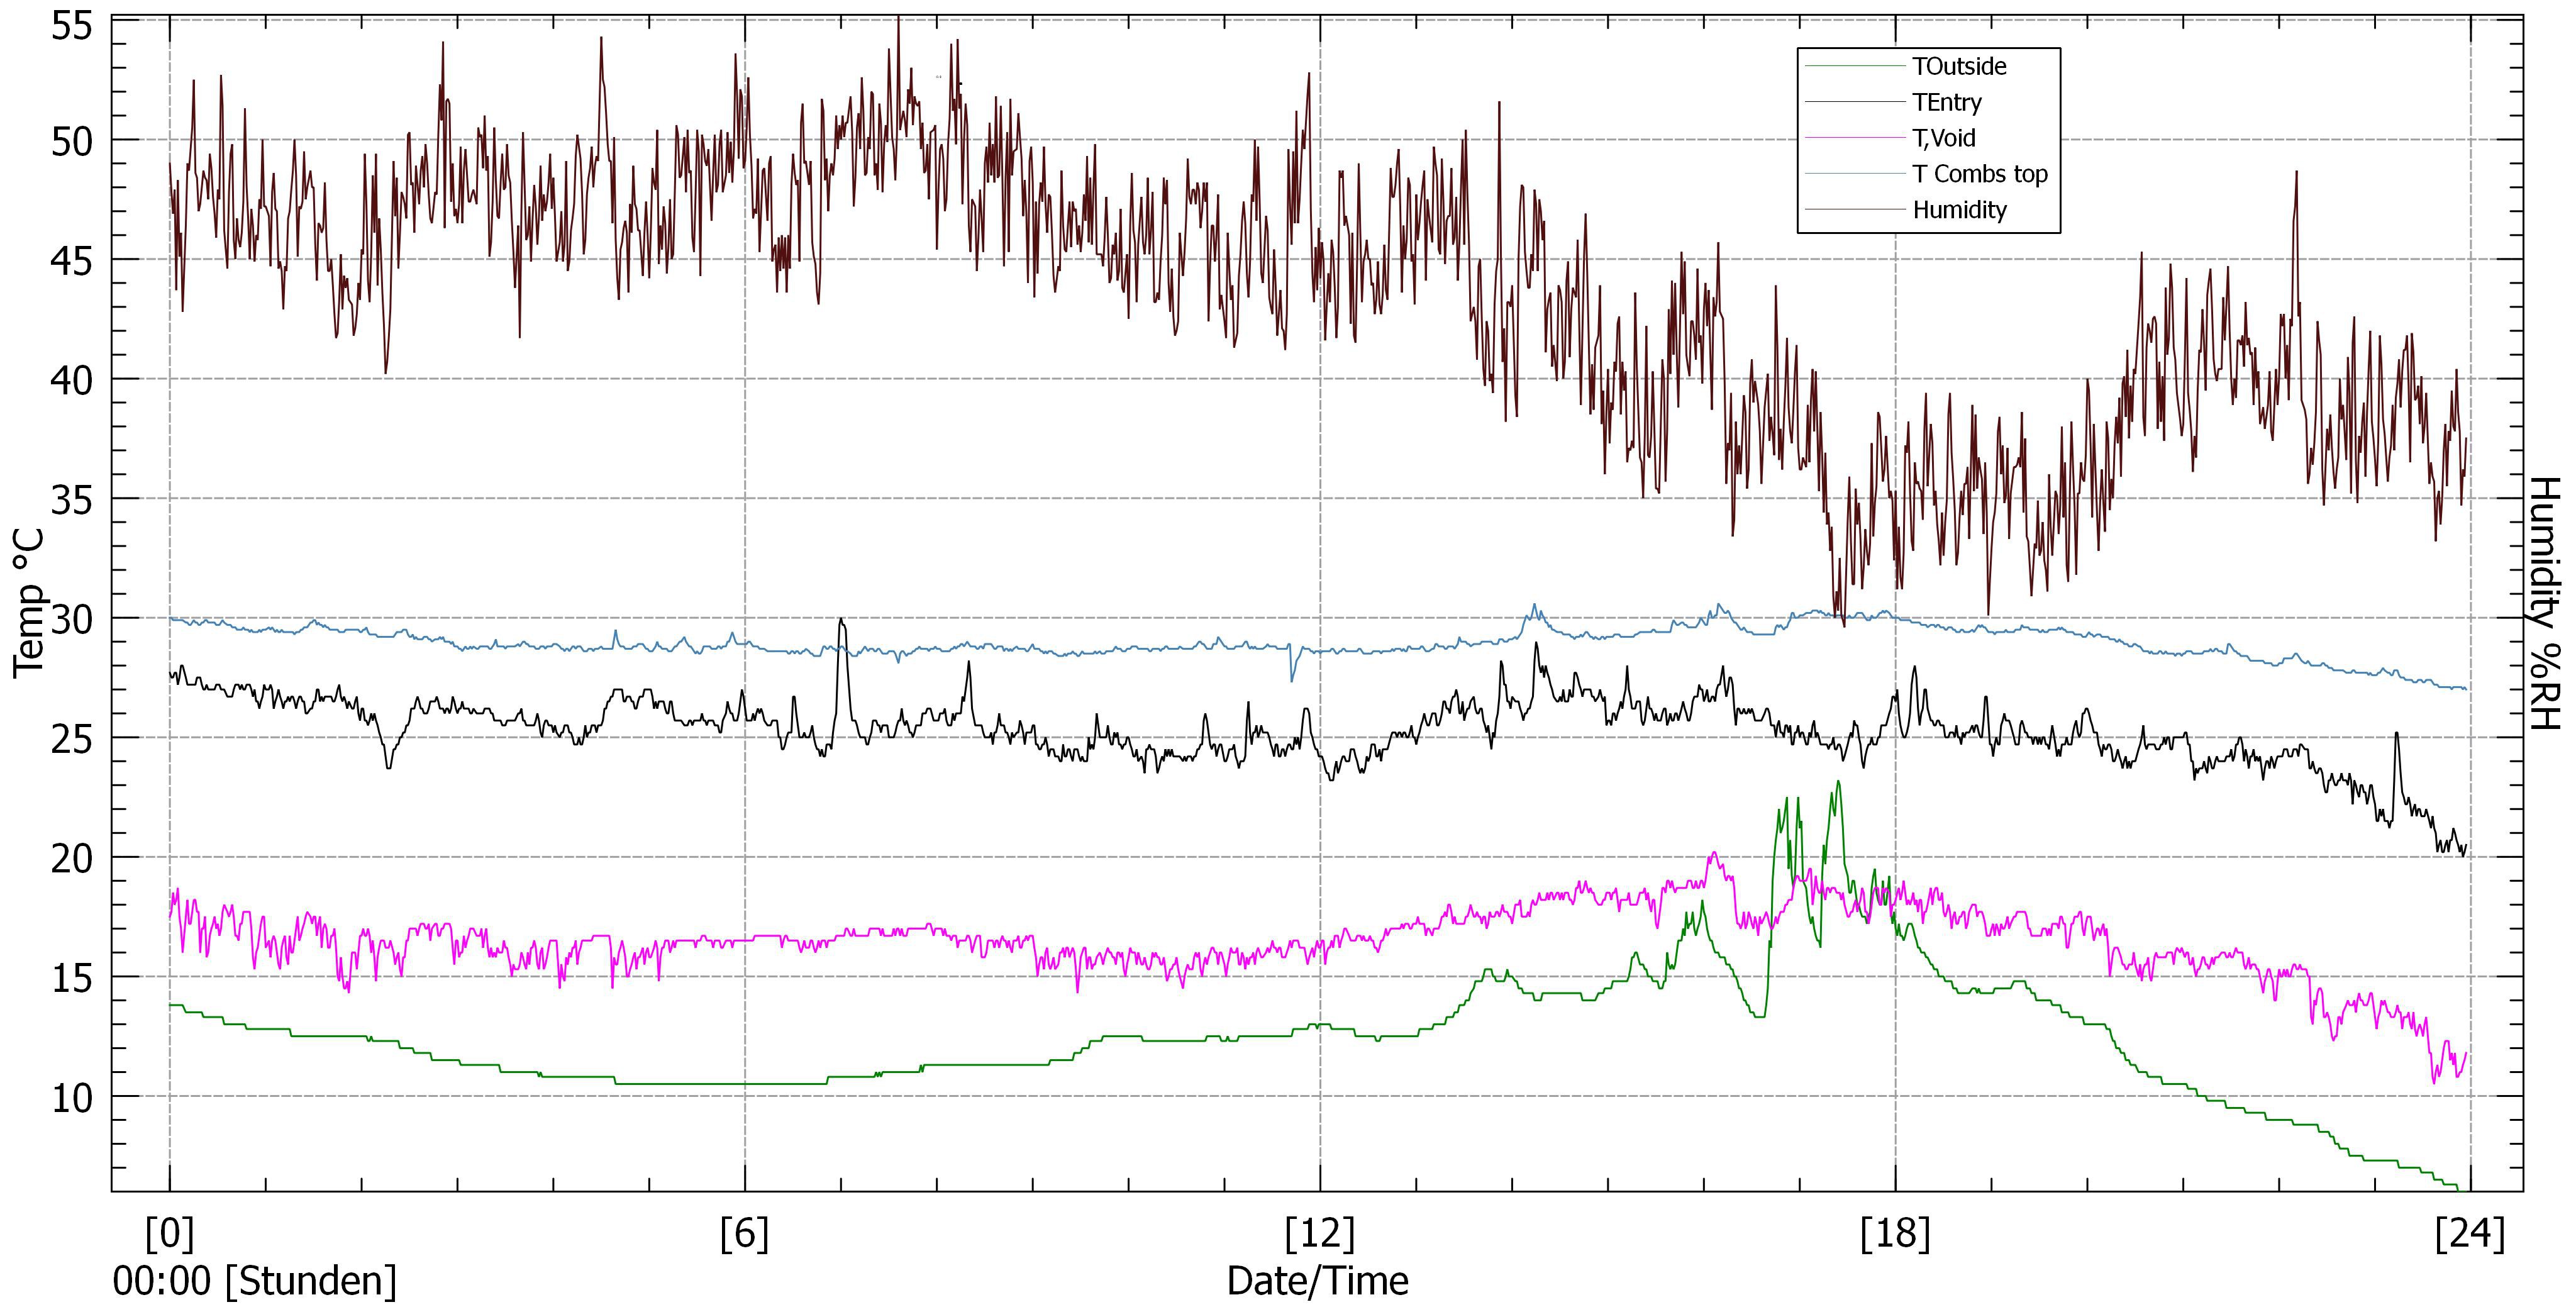
Here's a plot (done in Kst 2) for just one day, April 30th:

Outside temperature jumps a bit around 17:00 - 18:00 because the sunlight gets through the vegetation. Temperature in the empty space inside the hive smoothens this a bit. The temperature measured on top of the brood combs is always within a range of 3°C. I really have to shove one of the sensors in between two combs!
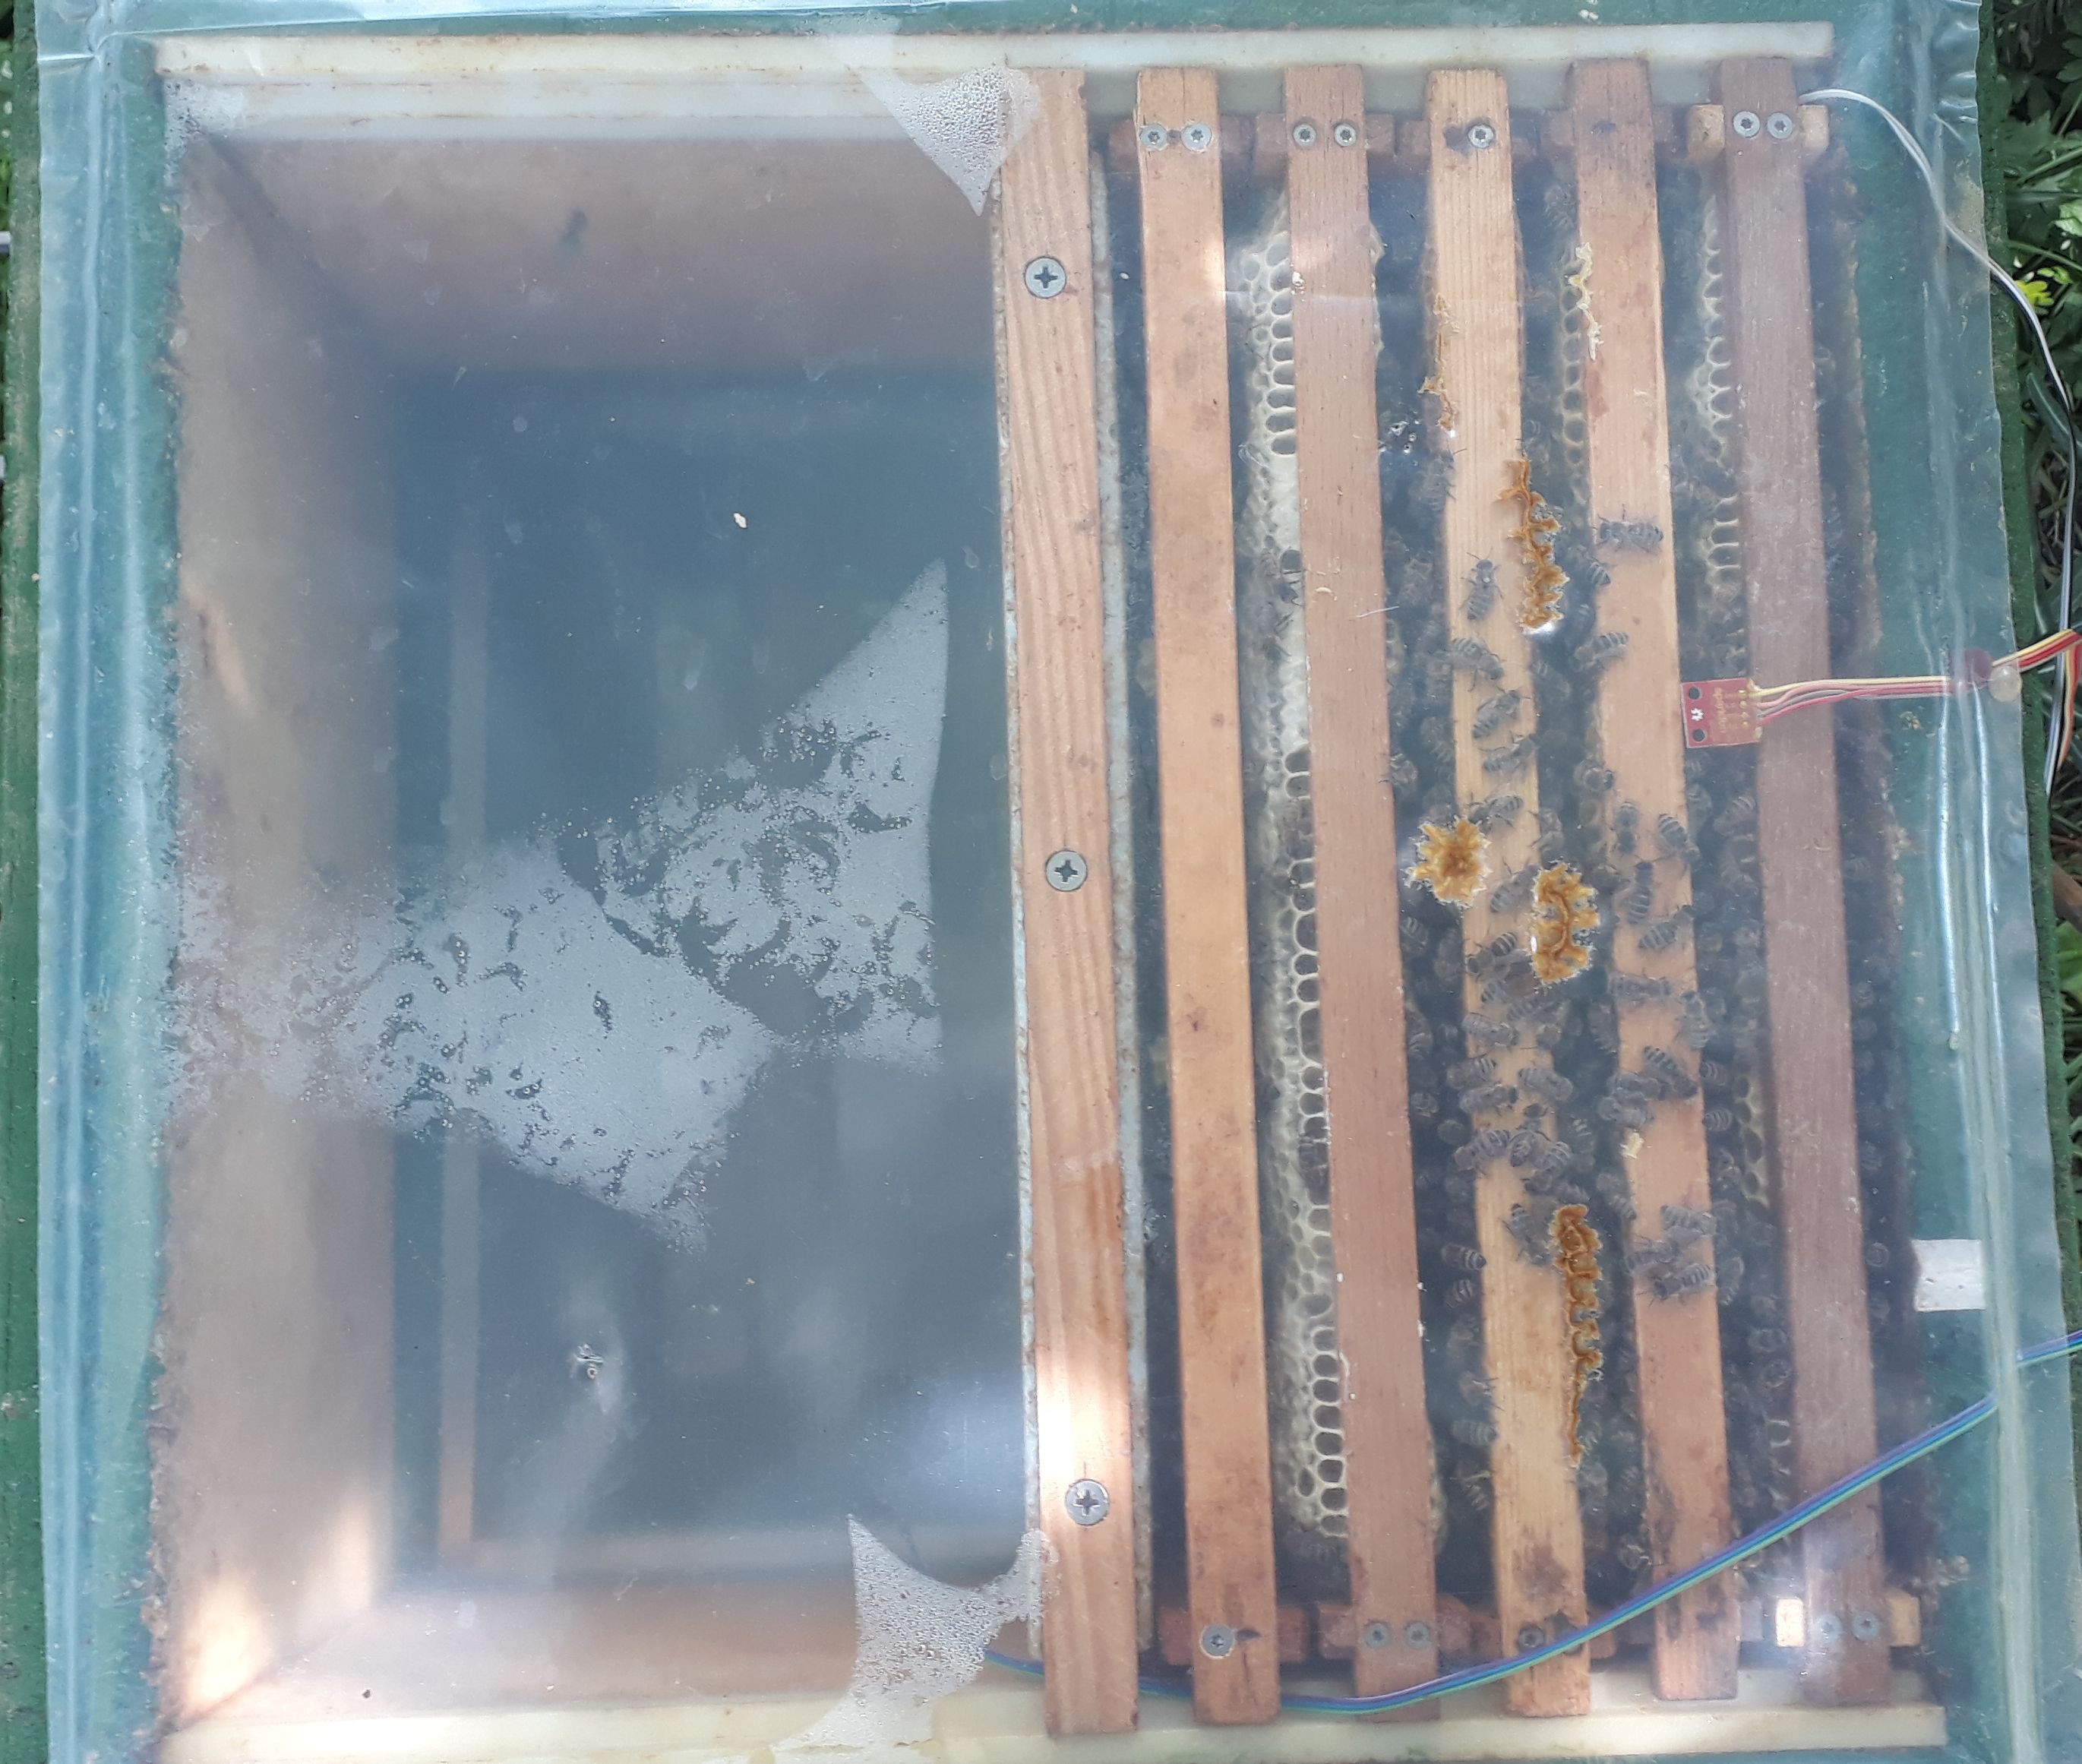
This is the hive today:

 Jan
Jan
Discussions
Become a Hackaday.io Member
Create an account to leave a comment. Already have an account? Log In.