 David Scholten
After leaving the computer on for an hour straight (and teaching MATLAB not to move the graph in front of my web browser) I have some interesting results:
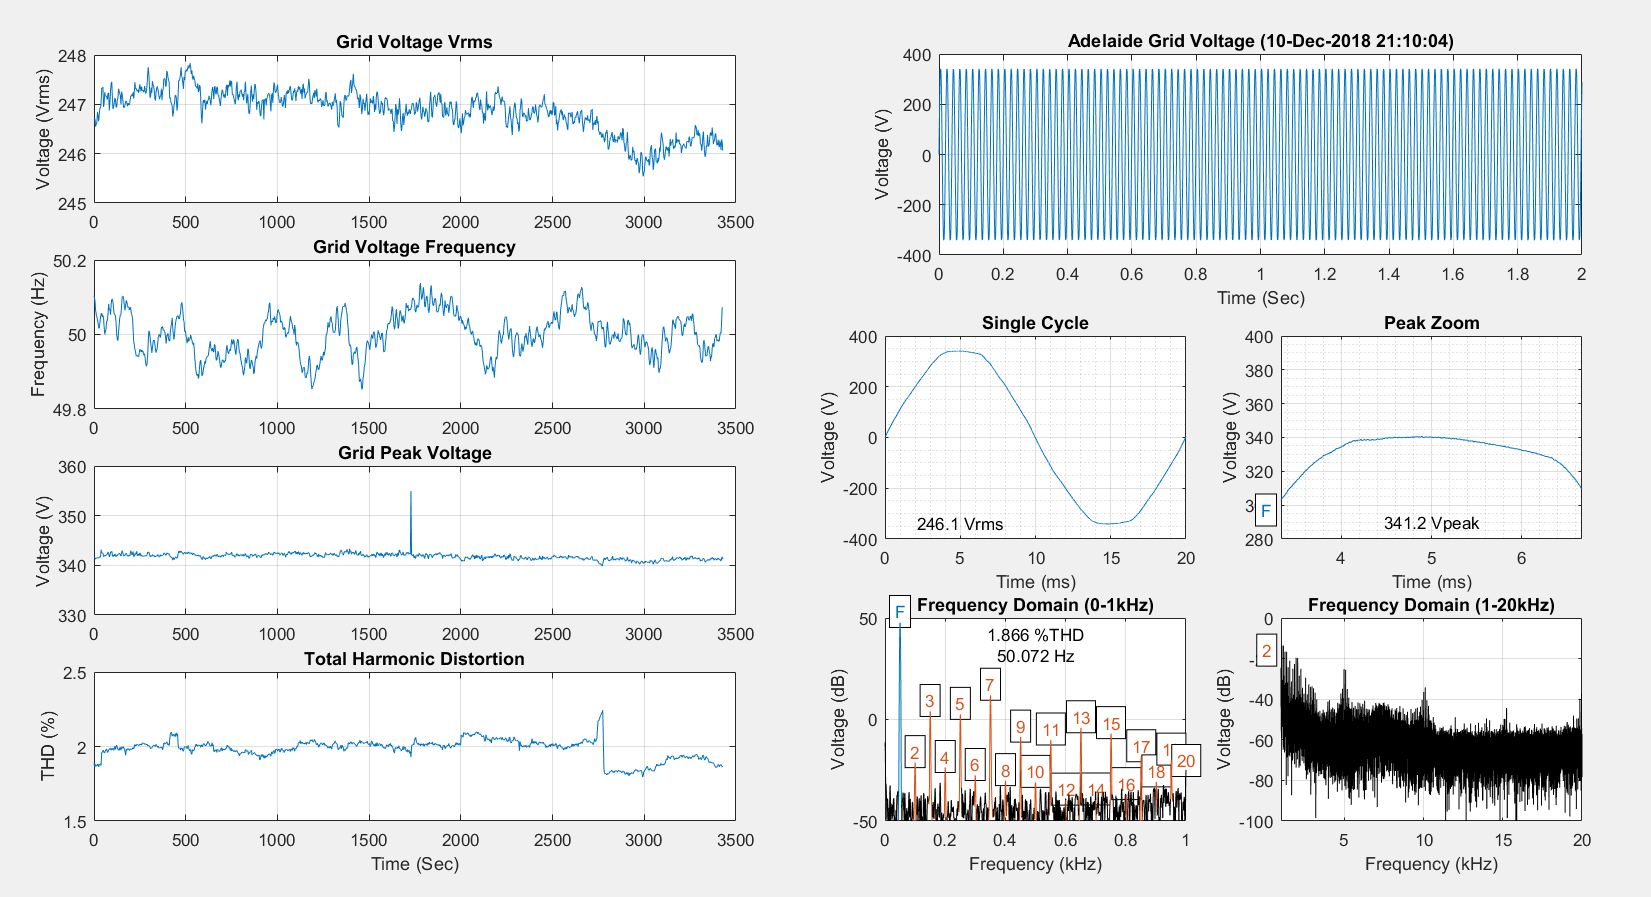
I seems to have captured a significant peak voltage surge and 15 minutes later, a sudden rise and drop in the THD.
What's interesting is that the 5, 10 and 15kHz signals came in at exactly the same time that the THD dropped.
As the THD is calculated only from the first 40 harmonics (<2kHz), it is not the signals causing the THD change. Rather, this may be some kind of signalling from the energy distributor?
Anyway, I'm installing MATLAB on a laptop so I can monitor for longer periods of time (and have battery power to allow for the capture of blackouts!)
This plot is currently uploaded as a MATLAB figure file for a limited time.
Discussions
Become a Hackaday.io Member
Create an account to leave a comment. Already have an account? Log In.