 Laser Developer
-
11Step 11
USB hack # 2
The menu structure of the SF02/F allows for two types of activity: entering settings or taking measurements. This is true for every menu, both in the user area and the factory area. So from the System settings menu, pressing the space bar to switch to measuring mode displays a bunch of system information. Pressing the < SPACE > again takes you back to the System settings menu.
![]()
The information that you can see from the measuring mode of the System settings menu is:
Column 1: Live, unfiltered distance readings.
Column 2: Filtered distance readings if the filter is switched on.
Column 3: The strength of the returning laser signal.
Column 4: The current noise level due to background lighting conditions.
Column 5: The CPU activity monitor. -
12Step 12
USB hack # 3
Near the bottom of the System settings menu there is a curious item “D: Dump graph”.
![]()
If you press the upper case < D > character (or lower case d), a stream of data will be shown in the Terminal window. This text data can be used make a detailed graph of the analog signals inside the SF02. To capture this data you can use the “Log” icon and save it as a text file and then import it into any spreadsheet package to make a graph. The saving sequence is as follows:
- Using the arrow keys, take the SF02/F to the System settings menu.
- Press the “Log” icon and enter a file name and location for the text file.
- Press D to transmit the text file from the SF02 to the computer.
- Wait for the file to upload.
- Press the “Stop Log” icon to close the file on the computer.
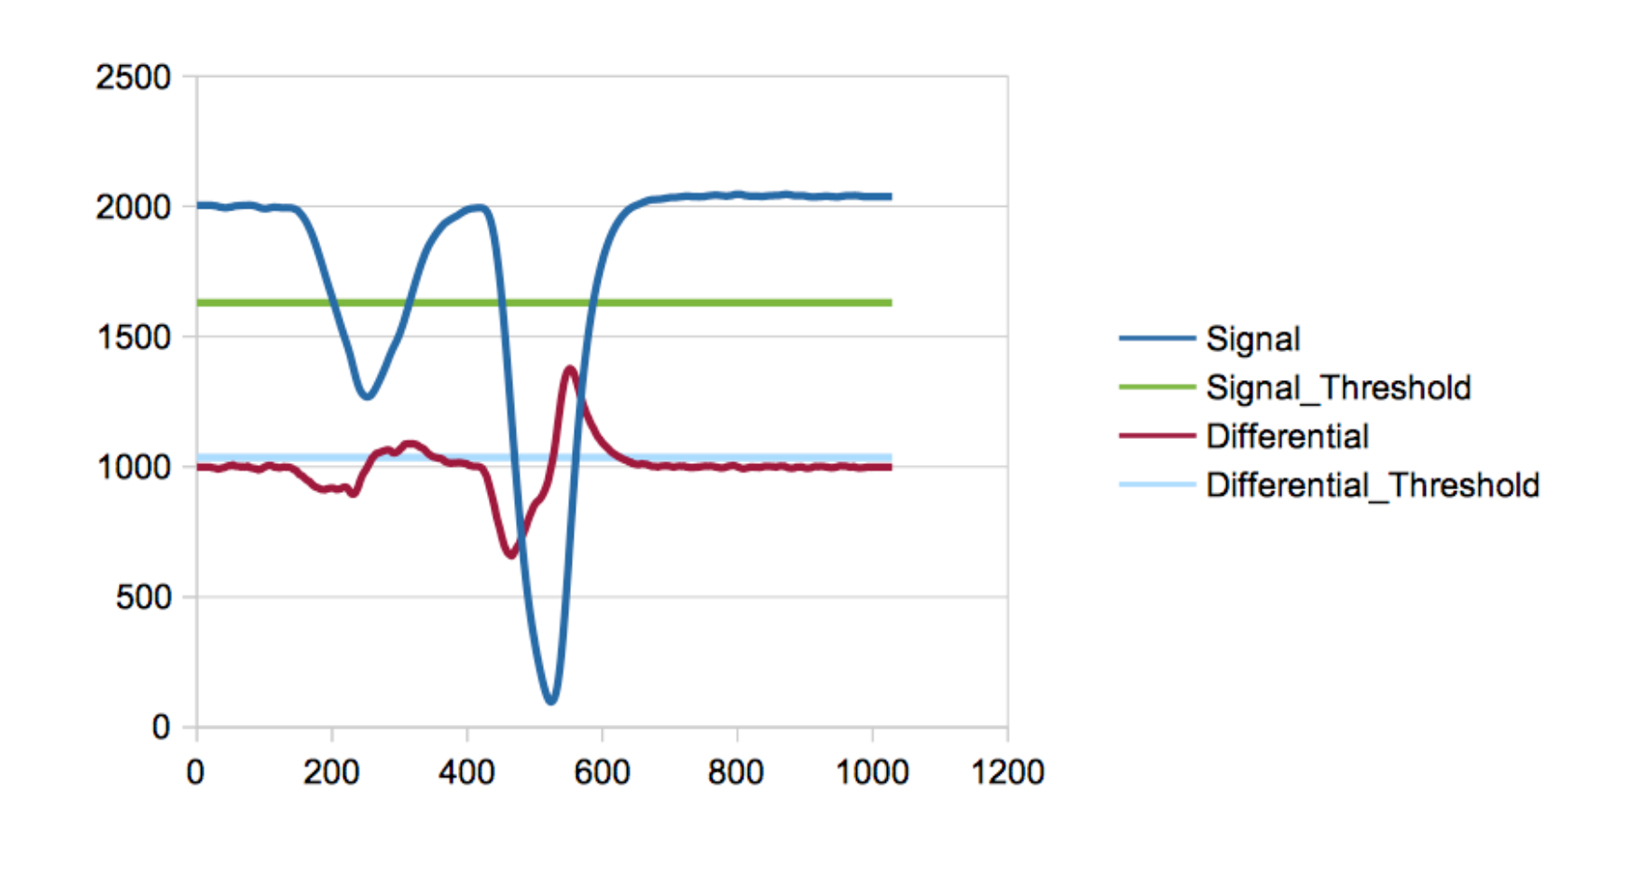
The graph below shows a typical set of data after it has been imported into Excel and graphed using the X-Y scatter plot function.
![]()
-
13Step 13
The SF02/F digitizes the signals using ADCs (analog to digital converters) and stores them in memory. What you see in the graph is a memory dump of the last reading taken. Each line is an internal signal and they can be interpreted as follows:
- Zero - this is the outgoing laser pulse and it is used to define the moment that the light leaves the laser diode.
- Signal - this is the return signal and you will notice that it is shown upside down. This is because the amplifiers invert the signal during the process of making it big enough for the ADC to read.
- Signal threshold - this is the level at which the signal will be measured in order to calculate the distance. This is a dynamic threshold and it changes as the size of the signal changes.
- Differential - this is the first order differential of the return signal and it is used to help identify valid signals when there is more than one target that is detected. In this graph, you can see a small bump at the front edge of the return signal. This comes from reflections off the window that the SF02/F was aiming through when this measurement was taken.
- There are number of thresholds and other constant levels shown. These identify certain important features in the return signal, such as its amplitude, and they are used by the SF02/F to confirm that the signal is valid.
Some interesting effects can be seen on these graphs, especially when measuring through windows to targets a long way off. The graph below shows two large return signals, the first is from a window and the second is from a parked car outside. You can see how big the reflection from a window can be and in this case the SF02/F has determined that the window is the first valid target and is calculating its distance in preference to that of the parked car.
![]()
-
14Step 14
The analog port
Graphing the return signal from a memory dump is interesting but not the same as seeing the live return signal. If you have access to a dual channel oscilloscope, even a slow one, you can watch the signal changing as you aim the SF02 at different targets.
The analog port is the place to see the live signals and since this port isn't populated, it makes an ideal place to hang the ‘scope probes.
-
15Step 15
Analog hack # 1
Hook up the signal probe to analog port pin number 1 and the trigger probe to pin number 5 as shown in the picture below.
![]()
Set both ‘scope channels to 1V/div and the timebase to 5 ms per division and you should see a live trace similar to the one shown below. The blue line is the trigger and the yellow line is the return signal.
![]() The falling edge of the blue trigger trace is the moment when the laser is given the signal to fire. It takes some time before the light comes out of the laser, so even for close targets the return signal will appear some time later than this falling edge.
The falling edge of the blue trigger trace is the moment when the laser is given the signal to fire. It takes some time before the light comes out of the laser, so even for close targets the return signal will appear some time later than this falling edge.Looking at the traces you can see that the measuring cycle is repeated every 31.3 ms. The distance that this represents is the maximum range that the SF02/F can measure (after taking into account the laser firing delay) which is 73.3 m. We can use this information to calculate the speed of light:
c = d / t
= 73.3 / 0.0313
= 2341.7 m/sFor those of you who know something about physics, this answer should be 299700000 m/s. Instead, it looks as though light is traveling 128000 times too slow. This is because the SF02/F uses a system called “sequential, equivalent time sampling” (SETS) to change the timebase of the signals to a much slower one. This has the advantage of letting us use a much slower oscilloscope to see the signals and it lets the SF02/F use slower ADCs to convert the analog signals into digital values to store in its memory.
-
16Step 16
All the menus
![]()
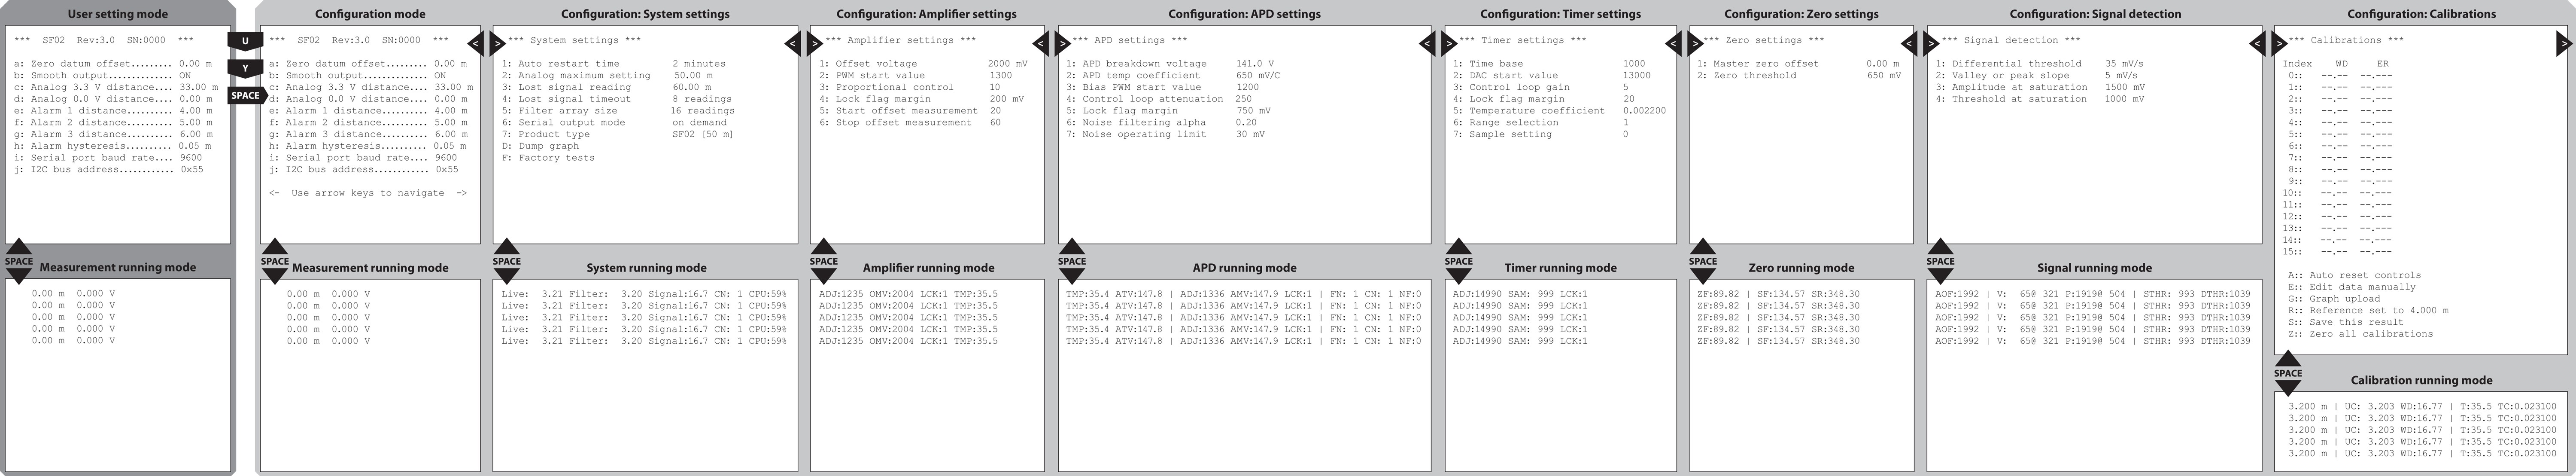
The image above shows all the factory (and user) menus (click on the image to see it in more detail). This menu map shows everything that the factory uses to build, calibrate and test the SF02. Once you've unlocked the factory section, the left and right arrow keys scroll between the different menu types and the up and down arrow keys (or SPACE bar) toggle between the static data entry screens and the scrolling live data section. The scrolling data is related to the menu that you are currently viewing, so for the standard user menu this shows the distance and output voltage. Each of the other sections shows a different set of scrolling data that is affected by the settings in that section.
Here is a brief summary of what each of the factory menus does:
- System settings - control the overall operation of the SF02.
- Amplifier settings - control the way the amplifiers handle the analog return signal.
- APD settings - manage the super-sensitive avalanche photo diode (APD) that detects the return laser signal.
- Timer settings - controls the resolution and update rate of the SETS (sequential-equivalent-time-sampling) timer.
- Zero settings - adjust the zero starting point of the outgoing laser pulses.
- Signal detection - controls the return signal detection and analysis algorithms.
- Calibrations - correct for non-linear distortions on the return signal due to the wide dynamic range of signal strengths.
SF02/F laser rangefinder hack
See what’s going on inside an SF02/F by accessing the additional ports.


Discussions
Become a Hackaday.io Member
Create an account to leave a comment. Already have an account? Log In.
Hi,
Is this module readable by a Raspberry pi? Is there a python SDK / module available to configure it?
Are you sure? yes | no
Thanks for such a quick reply! So I basically need to find the phase angle between the laser firing signal and the return signal?
Are you sure? yes | no
In principle, yes. Unfortunately, there may not be a direct measurement that you can make because on most range finders the modulation frequency of the laser changes in order to overcome aliasing. Some devices "chirp" the laser. However, you might be lucky and find that your particular model only uses one frequency in which case you might be able to extract the phase.
Are you sure? yes | no
Hi, I am trying to hack a laser distance meter here: https://hackaday.io/project/12767-peek-inside-uni-t-ut390b
Does the analog signal I have found look like something that could be used by a microcontroller to make distance measurements without needing to talk to the STM32F? Thanks for any help.
Are you sure? yes | no
Hey Simon, there's a big difference between the frequency modulated type that you're working with and the time-of-flight SF02. Frequency modulated devices do not show a direct return signal, instead they look for a phase shift at different modulation frequencies whilst TOF devices actually time a pulse of light.
Are you sure? yes | no