 Radu Motisan
To collect enough data I drove for a few hours across the city of Timisoara. Thanks to my beautiful assistant I got to have a demo video of the entire procedure:
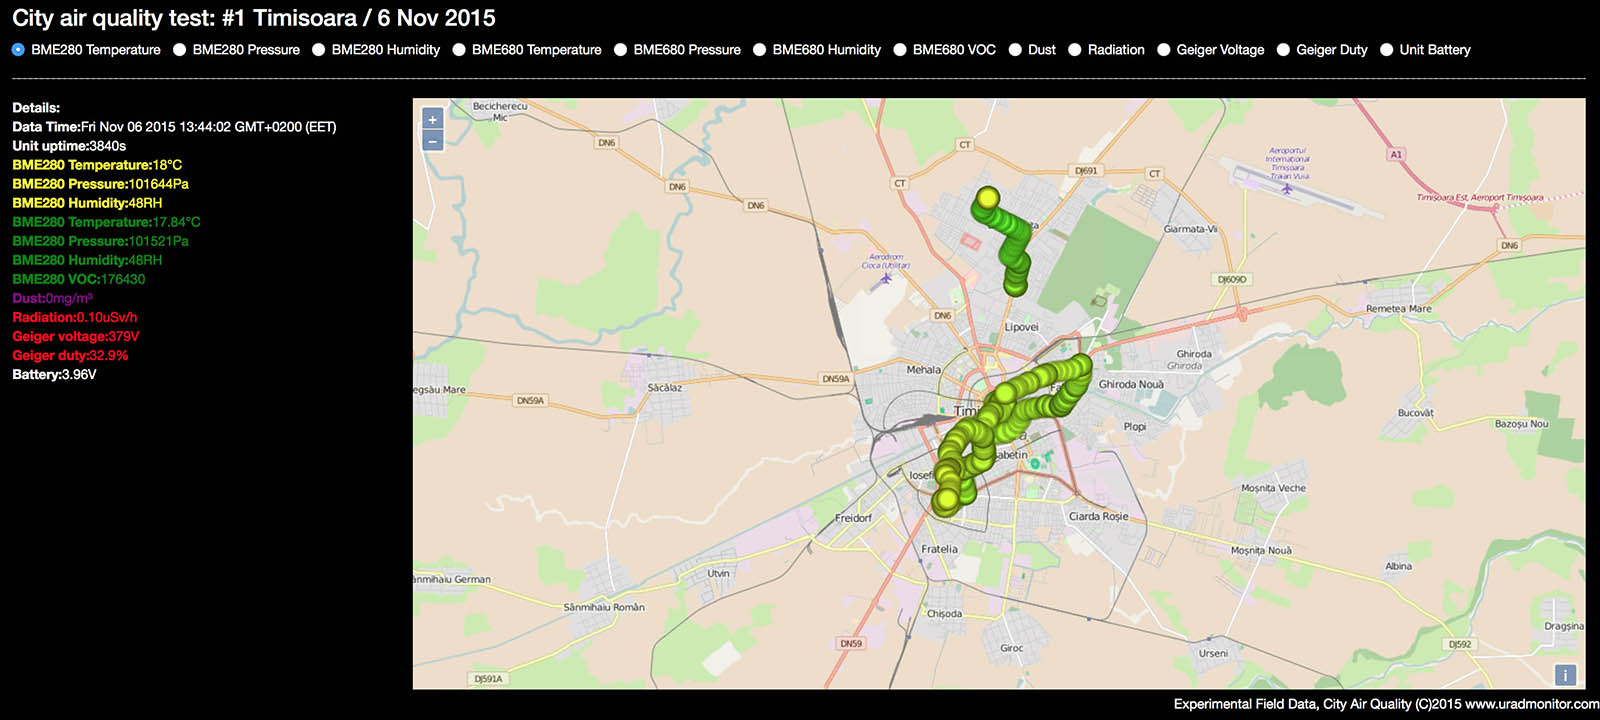
To better analyse the results of this first test, I had to built a web interface that plots all data across an OpenLayers map of Timisoara. While the sensor unit only features 5xSBM19 for sensitive radiation detection, a BME280 sensor mounted inside the unit's case (for temperature, barometric pressure, humidity), a BME680 sensor (temperature, barometric pressure, humidity, VOC) mounted inside the air tube, a Sharp GP2Y1010 dust sensor, the smartphone also adds GPS details including latitude, longitude, altitude and speed. All this together results in valuable information regarding the environmental quality, mapped geographically to exact location. The data can be accessed on the interactive map.
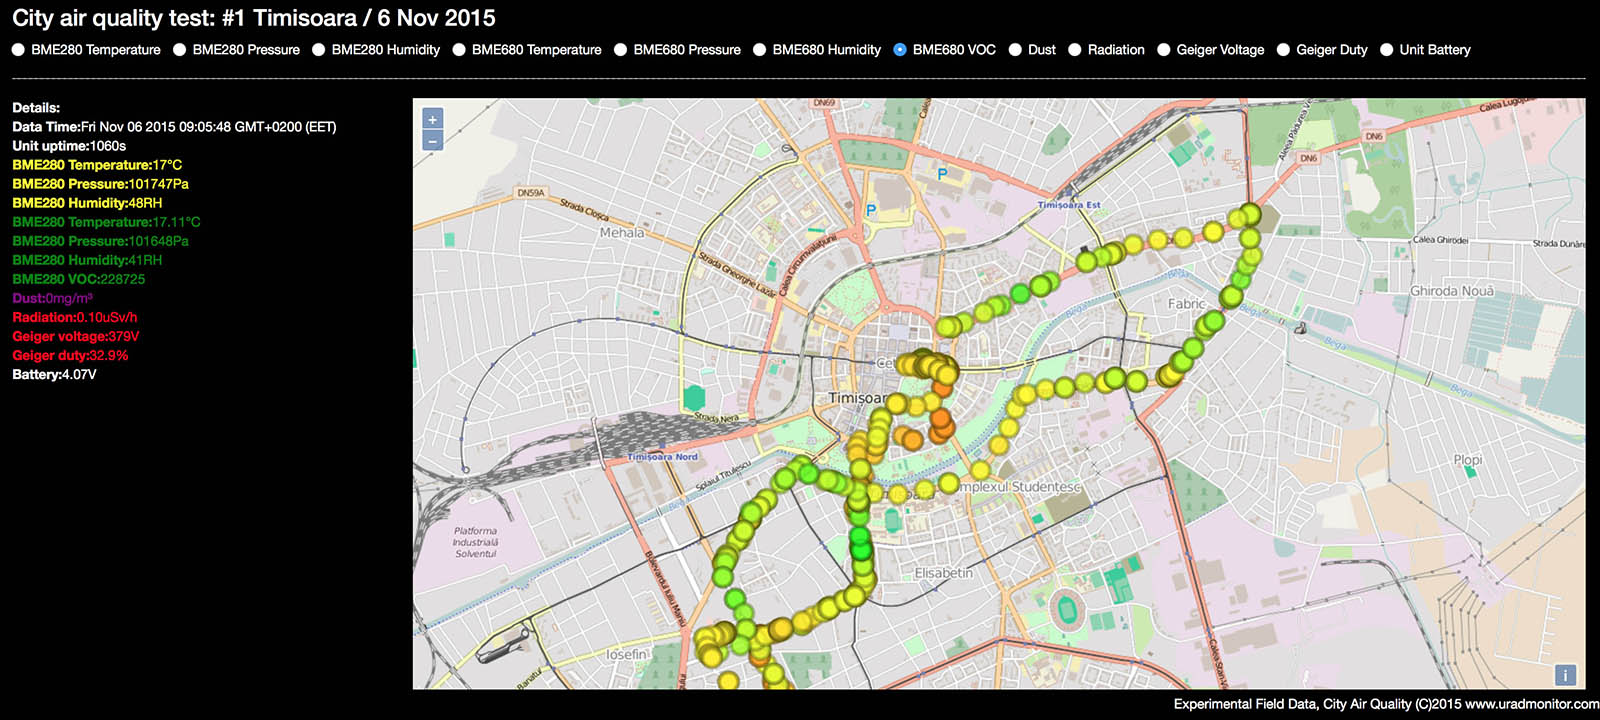 The Dust and VOC parameters need some additional work, so as said, this entire project so far is experimental, and has the purpose of identifying the starting point for providing this kind of environmental surveillance at a city level. A very interesting discovery is a raised radiation measurement, in the North side, where increasing readings are consistent to approaching to a radiation source, while departing the area shows the expected decrease, unlike an isolate spike in readings. See the second photo below for a closer look:
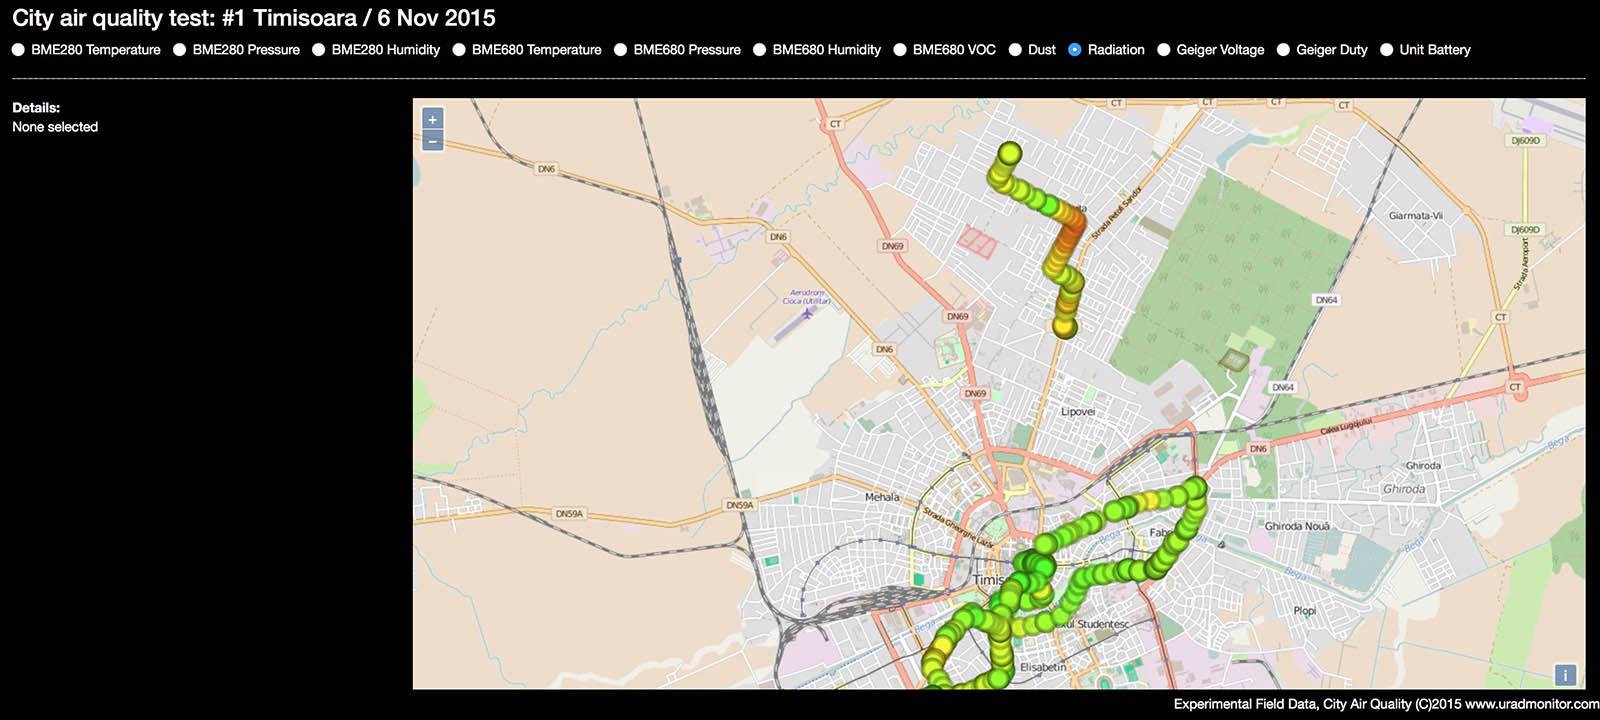
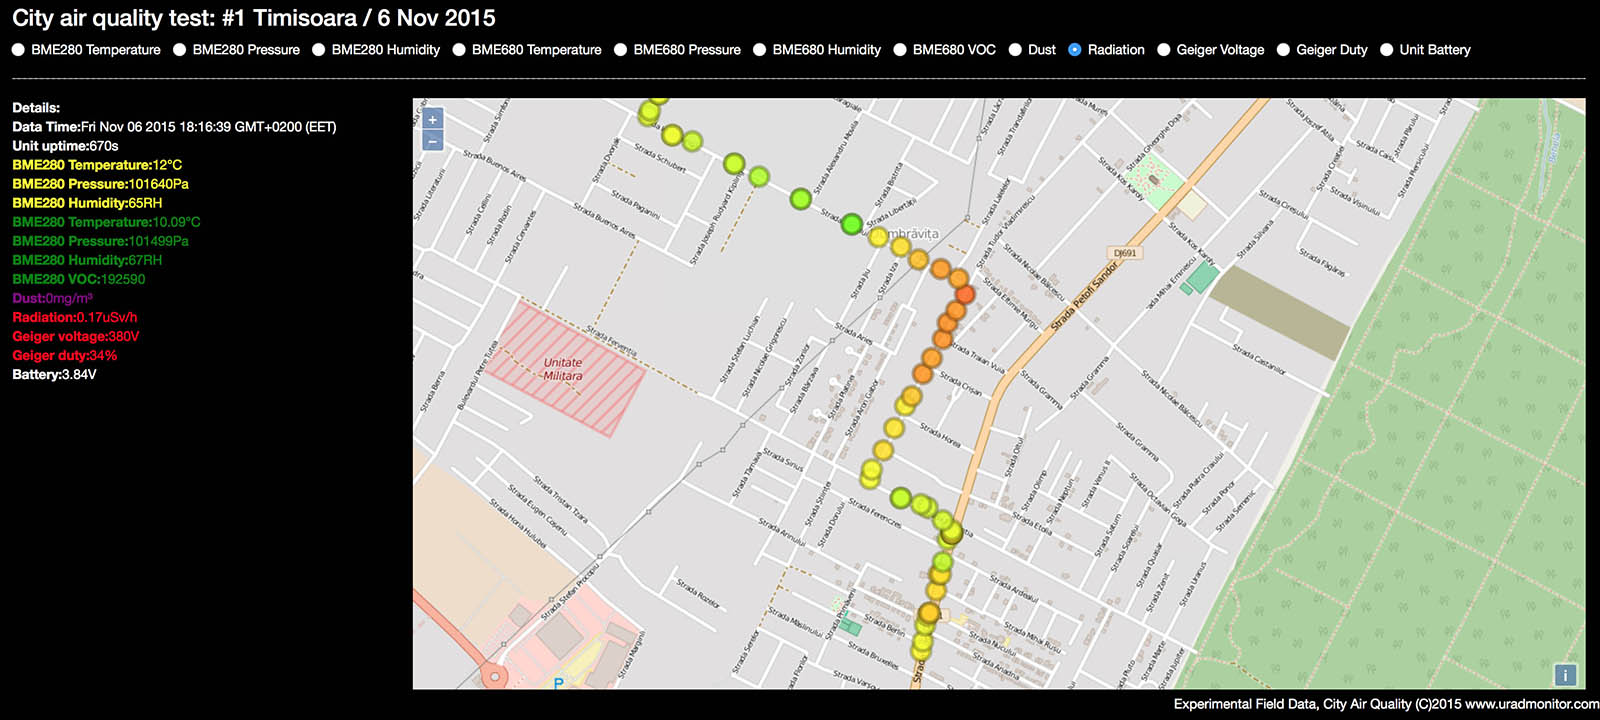
I'm definitely curious about the elevated radiation readings in that area, while the numbers are not big, there must be a cause, especially given the increased detection distance. Here the sensitive Geiger detector played its role. I will research the phenomenon further and report back with more details.
Discussions
Become a Hackaday.io Member
Create an account to leave a comment. Already have an account? Log In.
!
Are you sure? yes | no