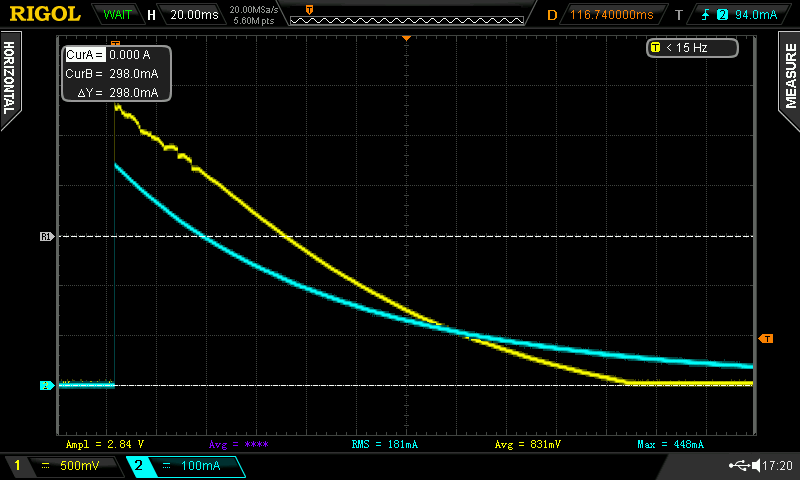
For the first measurement, I read out the data from the captured screenshot of the oscillogram. It's good enough, but after repeating the process for a slower decay, I felt like it's too much trouble, so I started experimenting on extracting the data directly off oscilloscope. So I captured a waveform, and exported it into each and every format the oscilloscope can write.
Some of the files were binary, with sizes ranging from large (1MB) to very large(10MB). Export of full data into a csv made me play with a whopping 111 MB csv file. And it looks like it contains only one channel, I want two.
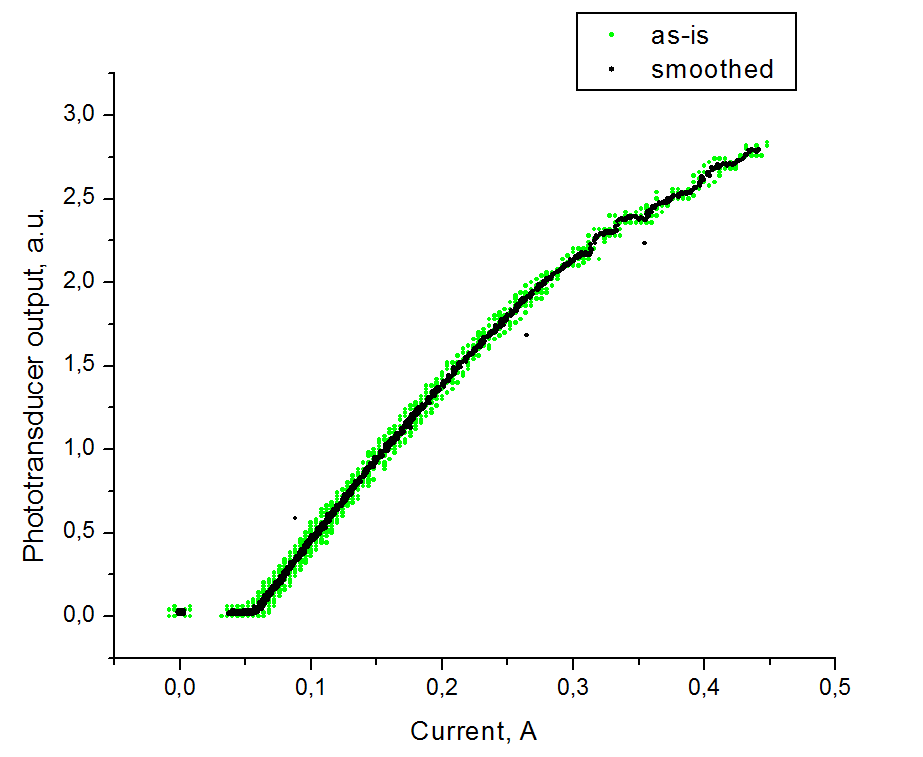
The best way so far is to export displayed data. It puts out reasonable amount of data, but with lots of noise. So the only thing I have to do to plot them is to boxcar-average it. The results follow.


This time, the L/I curve was measured much slower, with total length of the light pulse of about half a second. As you can see, the behavior isn't much different form the previous one, acquired in about 10 ms.
 DeepSOIC
Discussions
Become a Hackaday.io Member
Create an account to leave a comment. Already have an account? Log In.